| Param | Original file | Final file |
|---|---|---|
| Filename | modeM0/AS1A11_082T01_9000005356_38001cztM0_level2.fits | modeM0/AS1A11_082T01_9000005356_38001cztM0_level2_quad_clean.evt |
| Size (bytes) | 367,392,960 | 89,631,360 |
| Size | 350.4 MB | 85.5 MB |
| Events in quadrant A | 3,592,665 | 607,952 |
| Events in quadrant B | 2,922,231 | 609,324 |
| Events in quadrant C | 2,568,334 | 619,856 |
| Events in quadrant D | 4,124,030 | 523,617 |
| Mode M0 | |||
|---|---|---|---|
| Quadrant | BADHDUFLAG | Total packets | Discarded packets |
| A | 0 | 14372 | 3 |
| B | 0 | 11834 | 2 |
| C | 0 | 10550 | 2 |
| D | 0 | 15538 | 2 |
| Mode SS | |||
|---|---|---|---|
| Quadrant | BADHDUFLAG | Total packets | Discarded packets |
| A | 0 | 102 | 0 |
| B | 0 | 102 | 0 |
| C | 0 | 102 | 0 |
| D | 0 | 102 | 0 |
| Mode M9 | |||
|---|---|---|---|
| Quadrant | BADHDUFLAG | Total packets | Discarded packets |
| A | 0 | 34 | 0 |
| B | 0 | 34 | 0 |
| C | 0 | 34 | 0 |
| D | 0 | 35 | 0 |
| Quadrant | Total seconds | Saturated seconds | Saturation percentage |
|---|---|---|---|
| A | 5044 | 32 | 0.634417% |
| B | 5044 | 186 | 3.687550% |
| C | 5044 | 6 | 0.118953% |
| D | 5044 | 406 | 8.049167% |
Noise dominated data is calculated using 1-second bins in cleaned event files. If a bin has >2000 counts, and if more than 50% of those come from <1% of pixels, then it is considered to be noise-dominated and hence unusable.
| Quadrant | # 1 sec bins | Bins with >0 counts | Bins with >2000 counts | High rate bins dominated by noise | Noise dominated (total time) | Noise dominated (detector-on time) | Marked lightcurve |
|---|---|---|---|---|---|---|---|
| A | 7017 | 5045 | 18 | 18 | 0.26% | 0.36% | 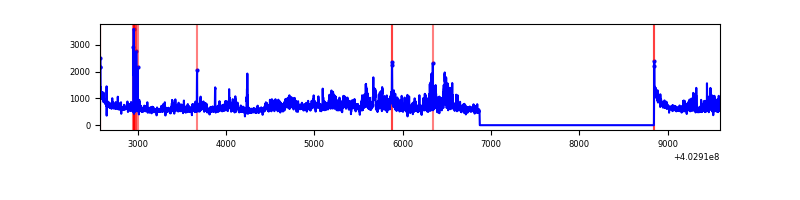 |
| B | 7017 | 5045 | 163 | 163 | 2.32% | 3.23% | 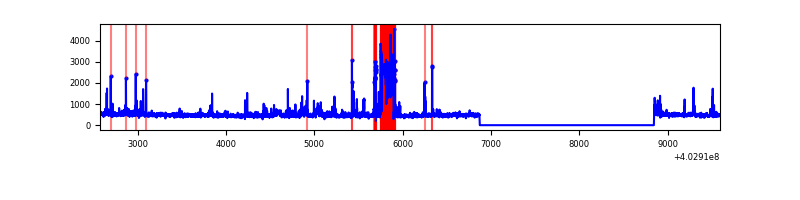 |
| C | 7017 | 5045 | 5 | 5 | 0.07% | 0.10% | 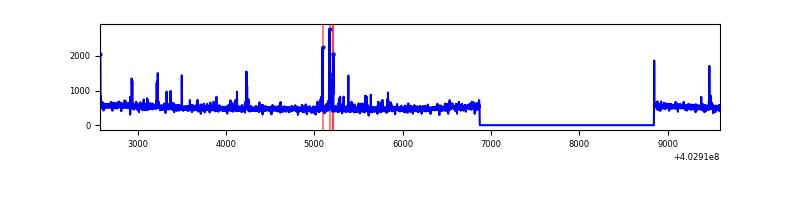 |
| D | 7017 | 5045 | 331 | 331 | 4.72% | 6.56% | 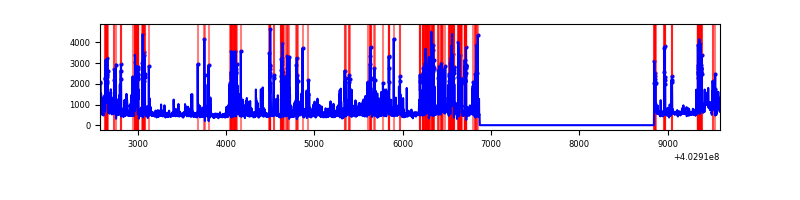 |
Top three noisy pixels from each quadrant. If the there are fewer than three noisy pixels in the level2.evt file, extra rows are filled as -1
| Pixel properties | Quadrant properties | ||||||
|---|---|---|---|---|---|---|---|
| Quadrant | DetID | PixID | Counts | Sigma | Mean | Median | Sigma |
| A | 15 | 222 | 489767 | 4119.71 | 586 | 574 | 118.7 |
| A | 10 | 83 | 376590 | 3166.6 | 586 | 574 | 118.7 |
| A | 12 | 16 | 302267 | 2540.69 | 586 | 574 | 118.7 |
| B | 5 | 172 | 460272 | 4188.12 | 575 | 560 | 109.8 |
| B | 5 | 184 | 47077 | 423.78 | 575 | 560 | 109.8 |
| B | 5 | 255 | 42050 | 377.99 | 575 | 560 | 109.8 |
| C | 15 | 214 | 217976 | 1635.99 | 574 | 576 | 132.9 |
| C | 14 | 254 | 60884 | 453.83 | 574 | 576 | 132.9 |
| C | 1 | 23 | 21599 | 158.2 | 574 | 576 | 132.9 |
| D | 1 | 52 | 1607802 | 11778.06 | 553 | 537 | 136.5 |
| D | 7 | 223 | 108265 | 789.43 | 553 | 537 | 136.5 |
| D | 13 | 249 | 62194 | 451.82 | 553 | 537 | 136.5 |
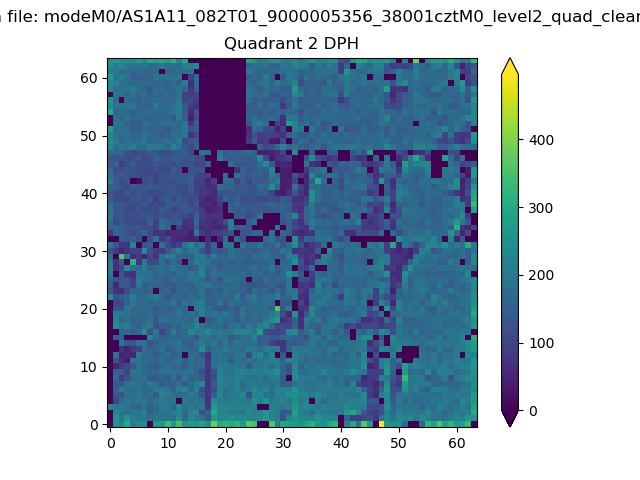
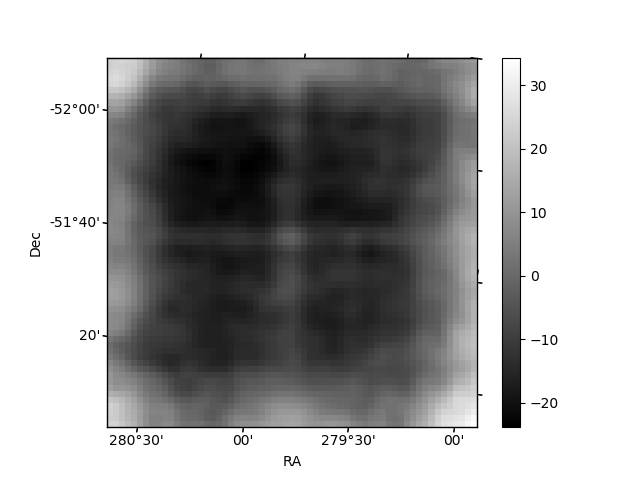
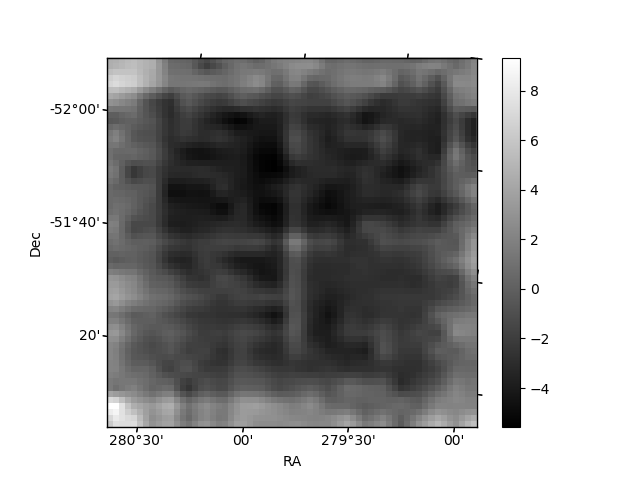
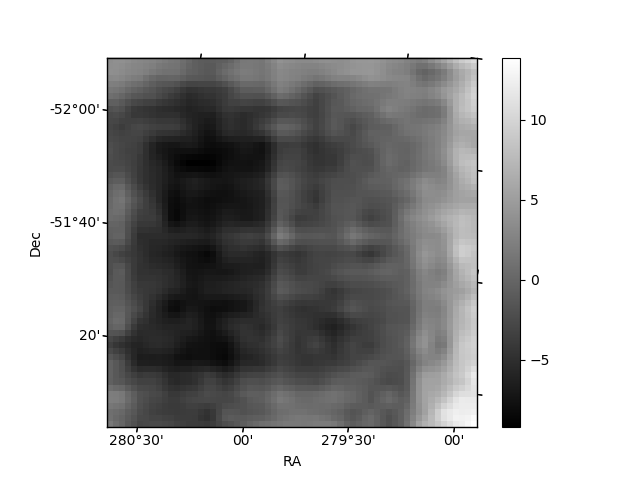
Histogram calculated using DETX and DETY for each event in the final _common_clean file
| Quadrant A | 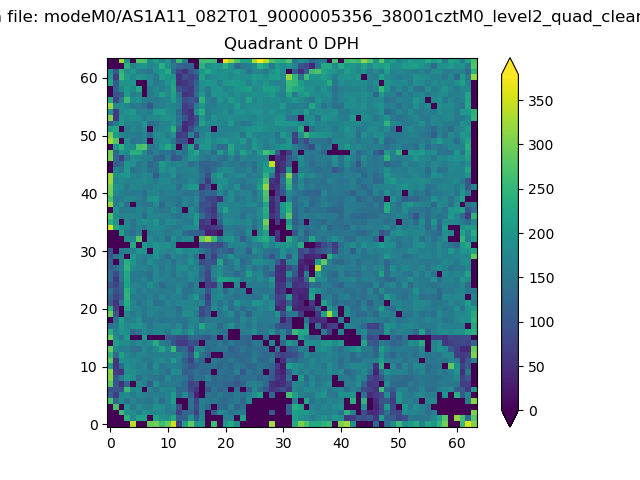 |
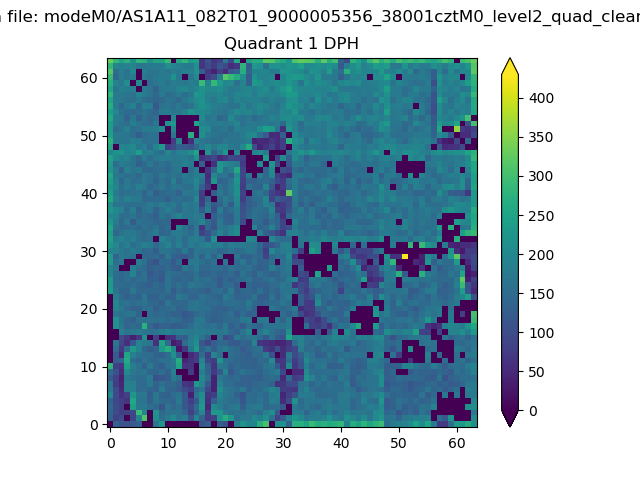 |
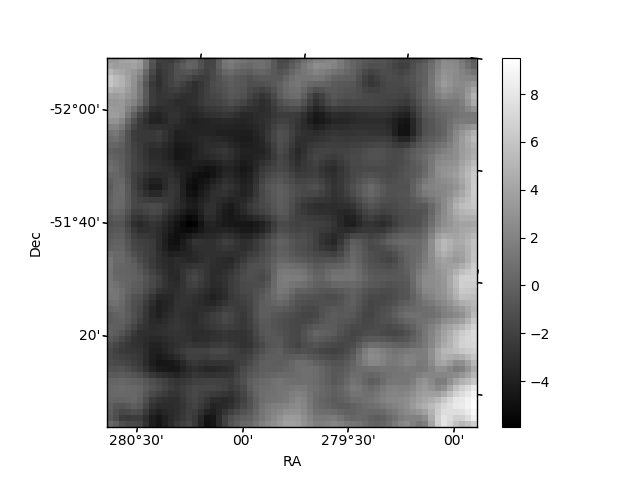
Quadrant B |
|---|---|---|---|
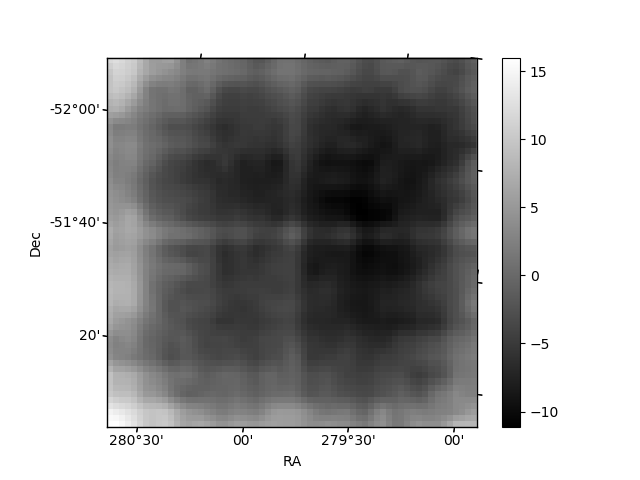
| Quadrant D | 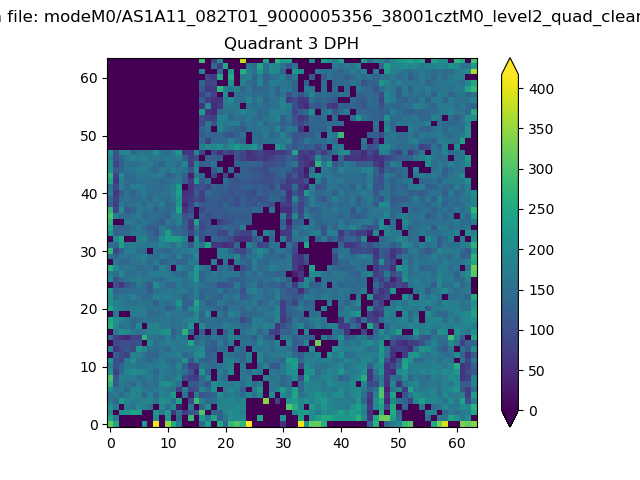 |
 |
Quadrant C |
| Plot type | Count rate plots | Images |
|---|---|---|
| Comparison with Poisson distribution Blue bars denote a histogram of data divided into 1 sec bins. Red curve is a Poisson curve with rate = median count rate of data. |
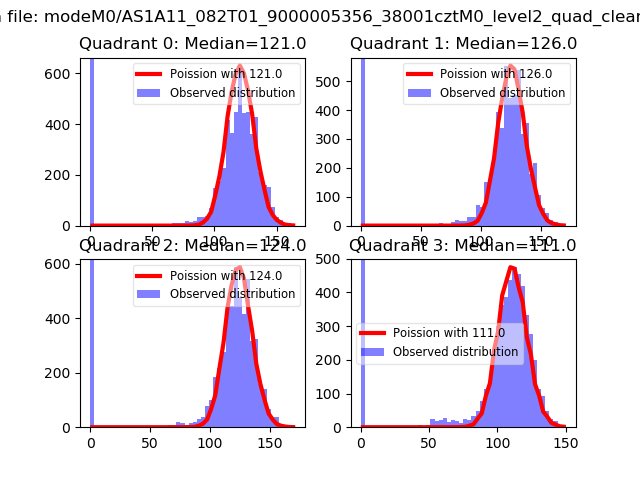 |
 |
| Quadrant-wise count rates Data is divided into 100 sec bins |
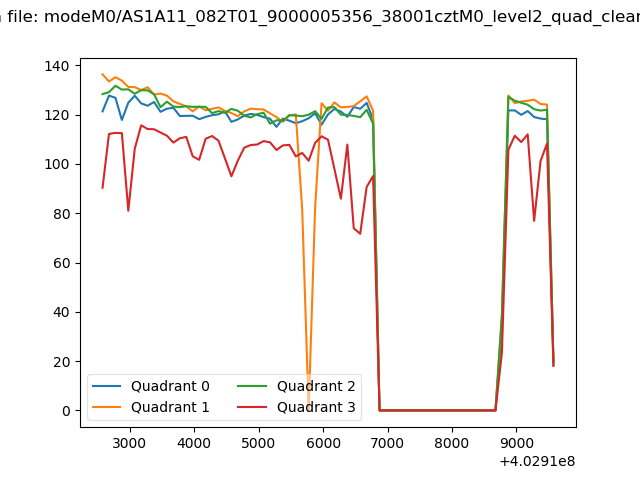 |
|
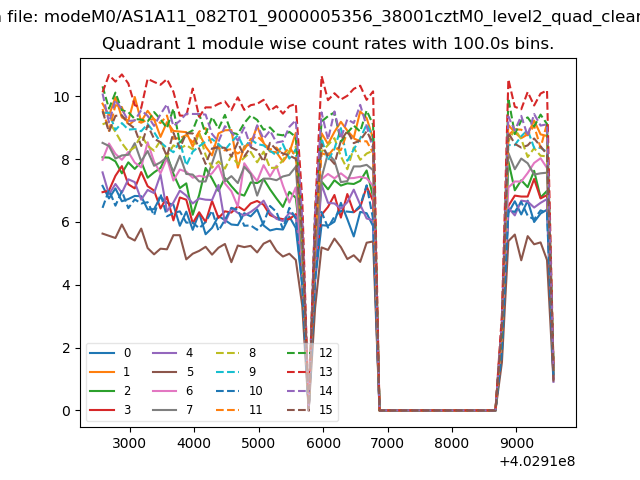
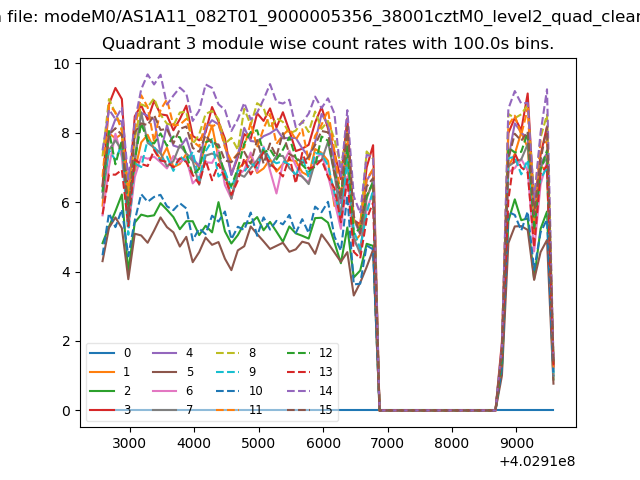
| Module-wise count rates for Quadrant A Data is divided into 100 sec bins |
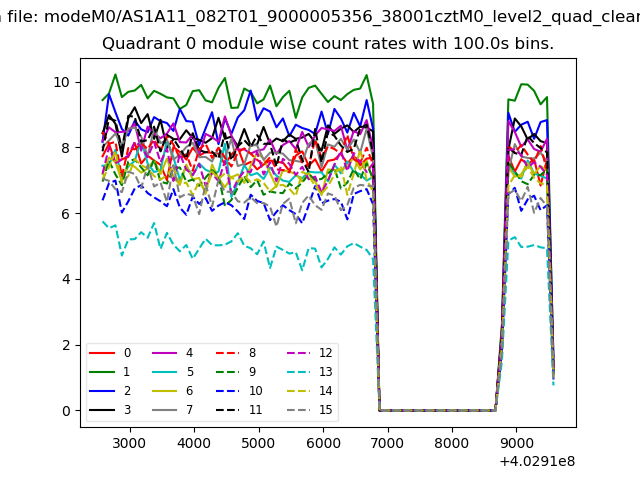 |
 |
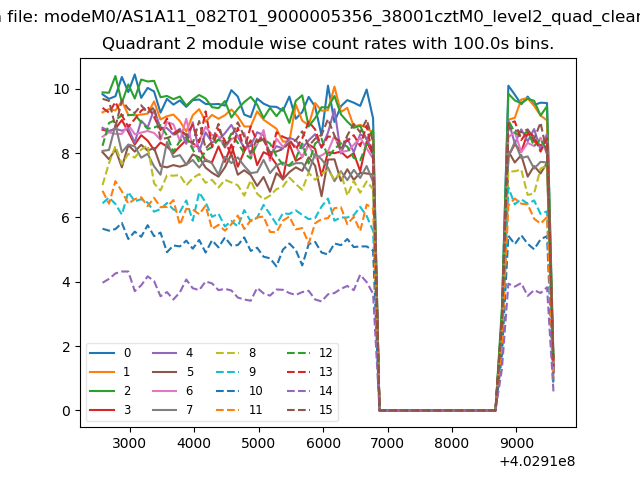
| Module-wise count rates for Quadrant B Data is divided into 100 sec bins |
 |
 |
| Module-wise count rates for Quadrant C Data is divided into 100 sec bins |
 |
 |
| Module-wise count rates for Quadrant D Data is divided into 100 sec bins |
 |
 |
| Parameter | Plot |
|---|---|
| CZT HV Monitor |  |
| D_VDD |  |
| Temperature 1 | 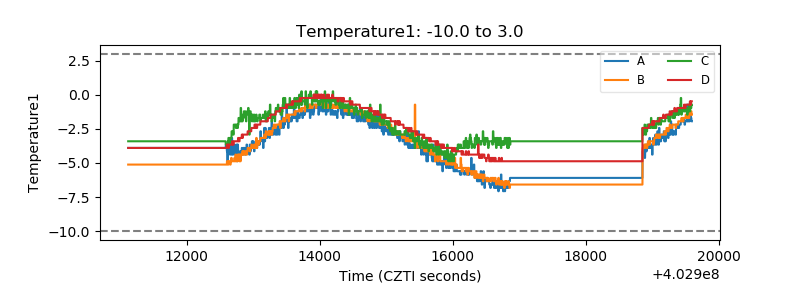 |
| Veto HV Monitor | 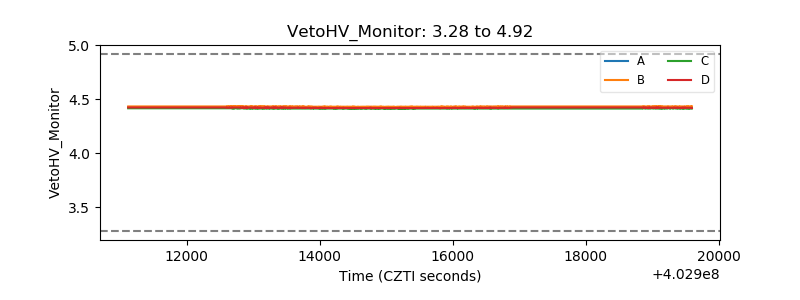 |
| Veto LLD | 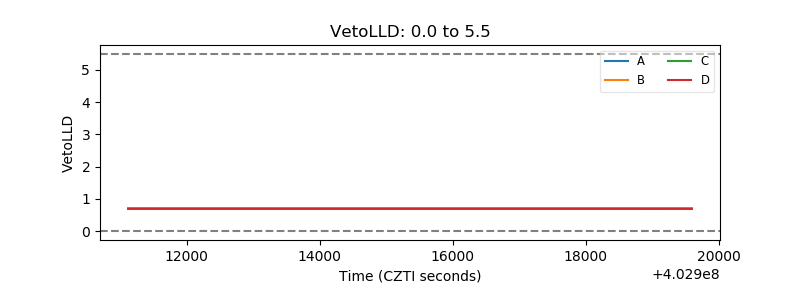 |
| Alpha Counter | 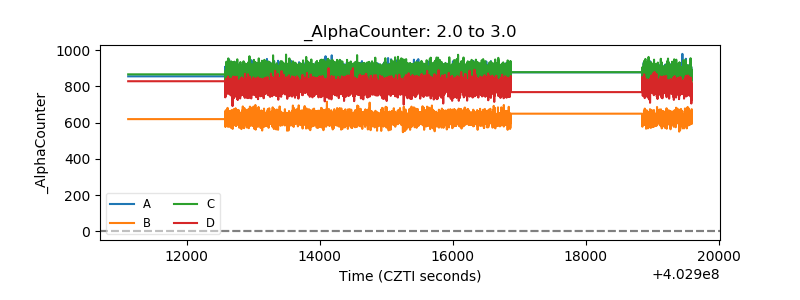 |
| _CPM_Rate | 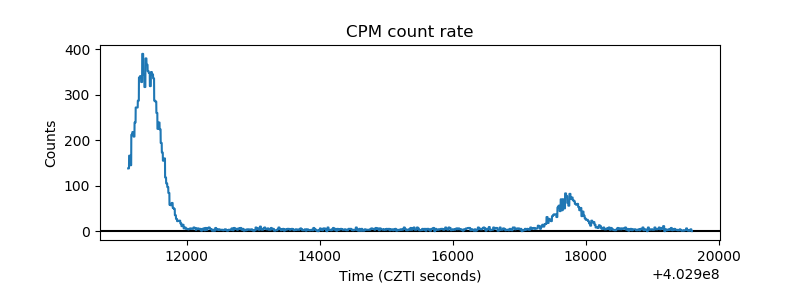 |
| CZT Counter | 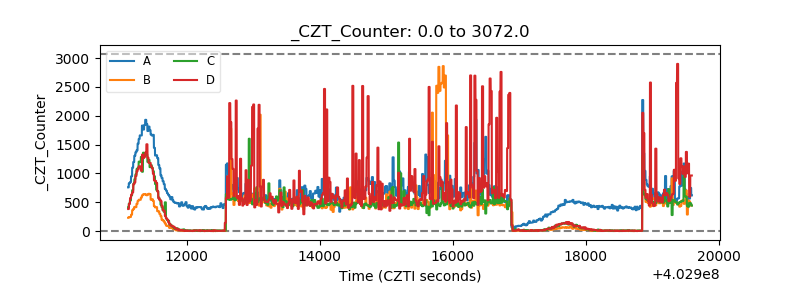 |
| +2.5 Volts monitor | 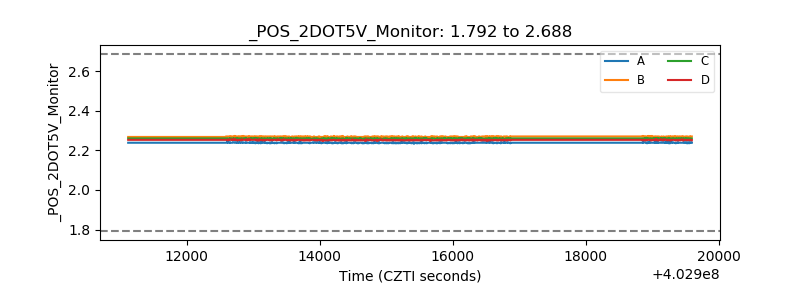 |
| +5 Volts monitor | 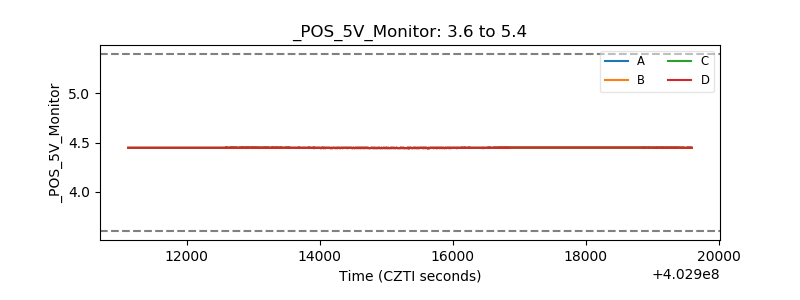 |
| _ROLL_ROT | 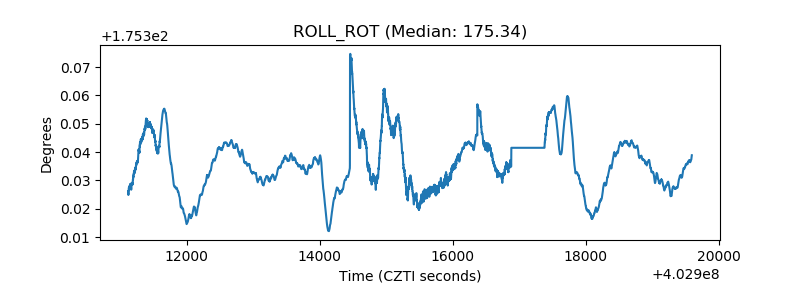 |
| _Roll_DEC | 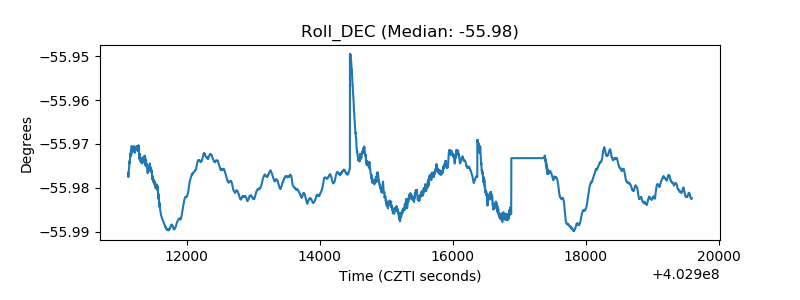 |
| _Roll_RA | 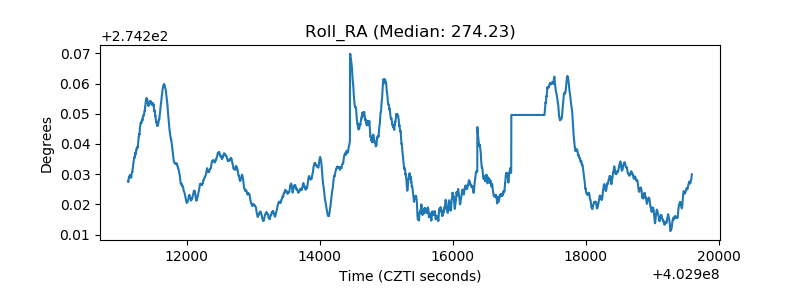 |
| Veto Counter | 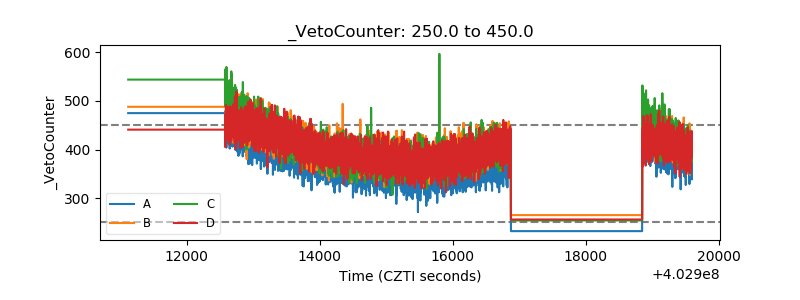 |