| Param | Original file | Final file |
|---|---|---|
| Filename | modeM0/AS1A11_082T01_9000005356_38002cztM0_level2.fits | modeM0/AS1A11_082T01_9000005356_38002cztM0_level2_quad_clean.evt |
| Size (bytes) | 394,315,200 | 93,078,720 |
| Size | 376.0 MB | 88.8 MB |
| Events in quadrant A | 4,336,445 | 598,230 |
| Events in quadrant B | 2,711,290 | 650,945 |
| Events in quadrant C | 2,669,414 | 635,161 |
| Events in quadrant D | 4,457,442 | 554,304 |
| Mode M0 | |||
|---|---|---|---|
| Quadrant | BADHDUFLAG | Total packets | Discarded packets |
| A | 0 | 16421 | 3 |
| B | 0 | 11547 | 2 |
| C | 0 | 11168 | 2 |
| D | 0 | 16797 | 2 |
| Mode SS | |||
|---|---|---|---|
| Quadrant | BADHDUFLAG | Total packets | Discarded packets |
| A | 0 | 112 | 0 |
| B | 0 | 112 | 0 |
| C | 0 | 112 | 0 |
| D | 0 | 112 | 0 |
| Mode M9 | |||
|---|---|---|---|
| Quadrant | BADHDUFLAG | Total packets | Discarded packets |
| A | 0 | 30 | 0 |
| B | 0 | 30 | 0 |
| C | 0 | 30 | 0 |
| D | 0 | 31 | 0 |
| Quadrant | Total seconds | Saturated seconds | Saturation percentage |
|---|---|---|---|
| A | 5420 | 398 | 7.343173% |
| B | 5420 | 28 | 0.516605% |
| C | 5420 | 7 | 0.129151% |
| D | 5420 | 330 | 6.088561% |
Noise dominated data is calculated using 1-second bins in cleaned event files. If a bin has >2000 counts, and if more than 50% of those come from <1% of pixels, then it is considered to be noise-dominated and hence unusable.
| Quadrant | # 1 sec bins | Bins with >0 counts | Bins with >2000 counts | High rate bins dominated by noise | Noise dominated (total time) | Noise dominated (detector-on time) | Marked lightcurve |
|---|---|---|---|---|---|---|---|
| A | 7093 | 5421 | 303 | 303 | 4.27% | 5.59% | 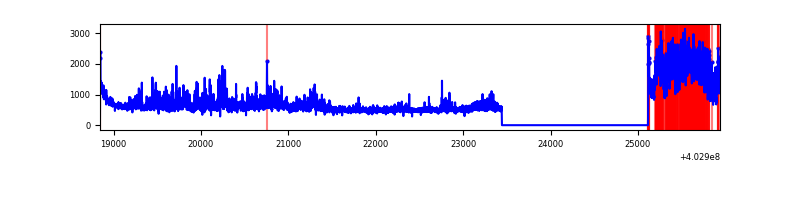 |
| B | 7093 | 5421 | 14 | 14 | 0.20% | 0.26% | 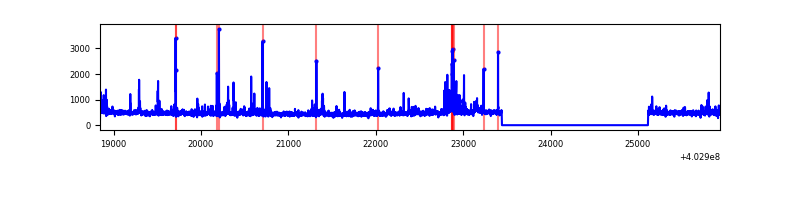 |
| C | 7093 | 5421 | 4 | 4 | 0.06% | 0.07% | 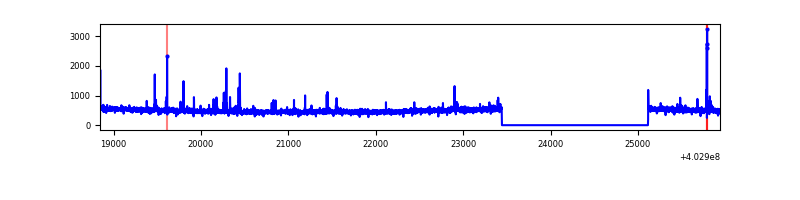 |
| D | 7093 | 5421 | 280 | 280 | 3.95% | 5.17% | 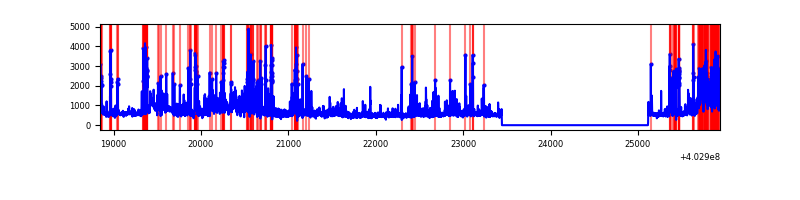 |
Top three noisy pixels from each quadrant. If the there are fewer than three noisy pixels in the level2.evt file, extra rows are filled as -1
| Pixel properties | Quadrant properties | ||||||
|---|---|---|---|---|---|---|---|
| Quadrant | DetID | PixID | Counts | Sigma | Mean | Median | Sigma |
| A | 15 | 222 | 1057734 | 8591.28 | 609 | 597 | 123.0 |
| A | 12 | 16 | 439159 | 3564.16 | 609 | 597 | 123.0 |
| A | 10 | 83 | 380266 | 3085.54 | 609 | 597 | 123.0 |
| B | 5 | 255 | 86649 | 728.6 | 616 | 600 | 118.1 |
| B | 5 | 200 | 37231 | 310.16 | 616 | 600 | 118.1 |
| B | 4 | 171 | 30018 | 249.09 | 616 | 600 | 118.1 |
| C | 15 | 214 | 231085 | 1650.77 | 601 | 604 | 139.6 |
| C | 14 | 254 | 54937 | 389.15 | 601 | 604 | 139.6 |
| C | 1 | 23 | 13964 | 95.69 | 601 | 604 | 139.6 |
| D | 1 | 52 | 1173882 | 8128.75 | 587 | 570 | 144.3 |
| D | 7 | 223 | 339805 | 2350.23 | 587 | 570 | 144.3 |
| D | 13 | 171 | 308829 | 2135.63 | 587 | 570 | 144.3 |
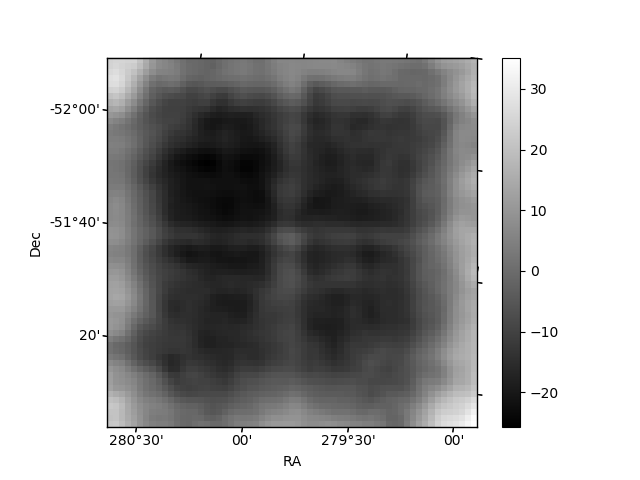
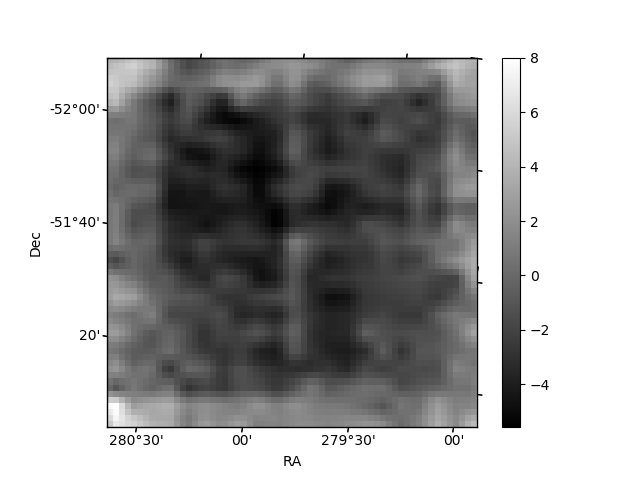
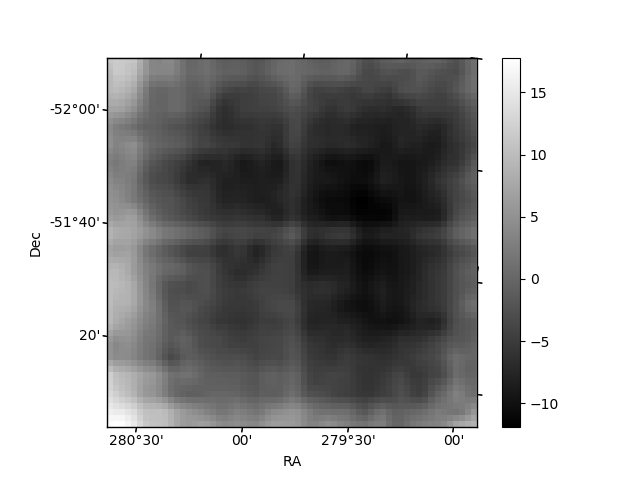
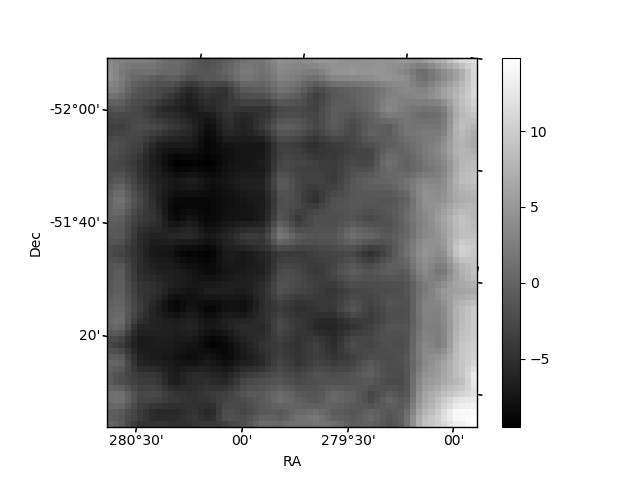
Histogram calculated using DETX and DETY for each event in the final _common_clean file
| Quadrant A | 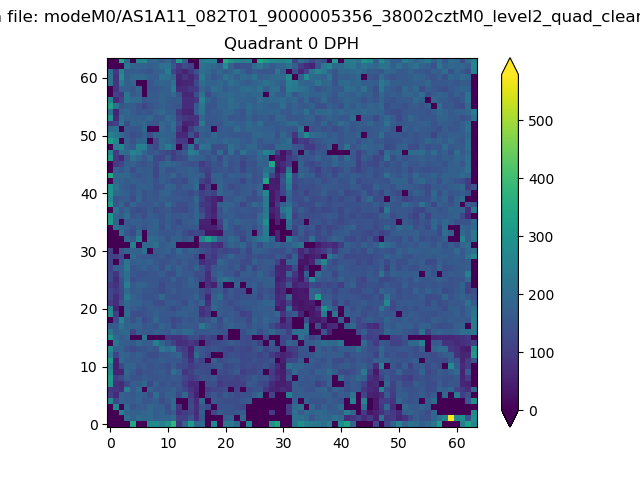 |
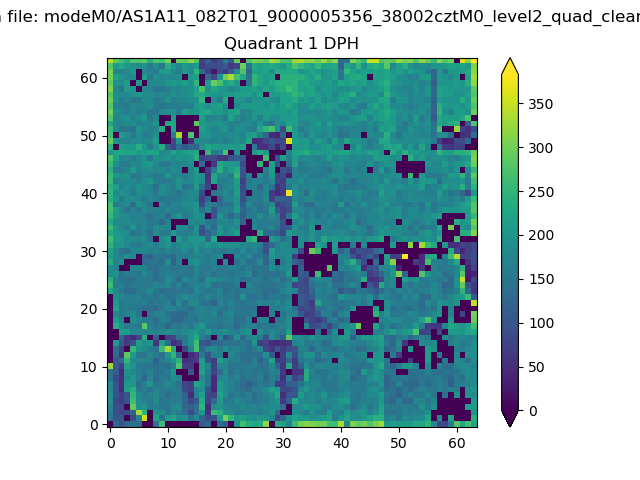 |
Quadrant B |
|---|---|---|---|
| Quadrant D | 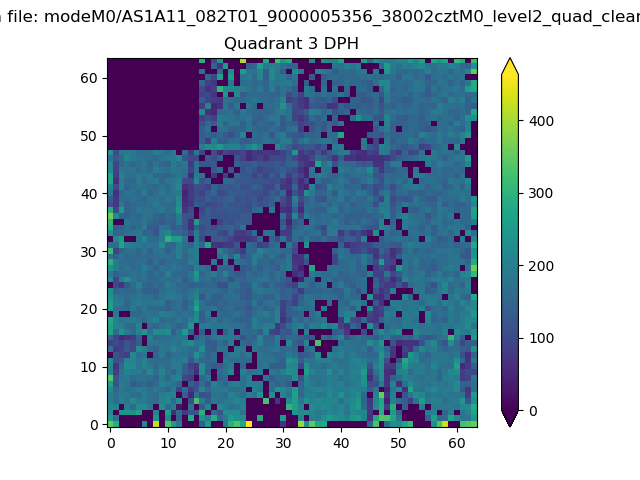 |
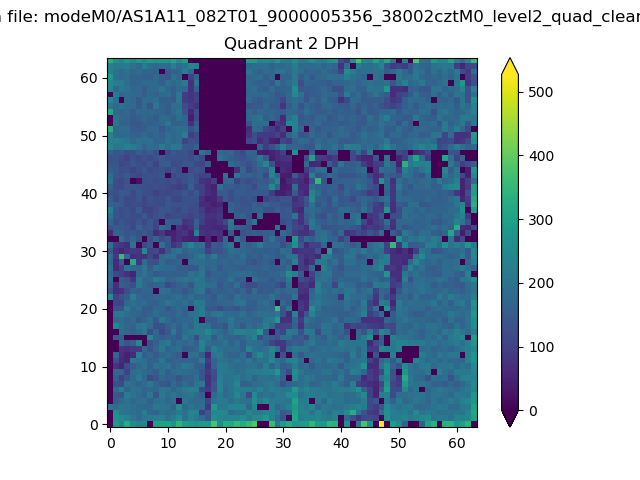 |
Quadrant C |
| Plot type | Count rate plots | Images |
|---|---|---|
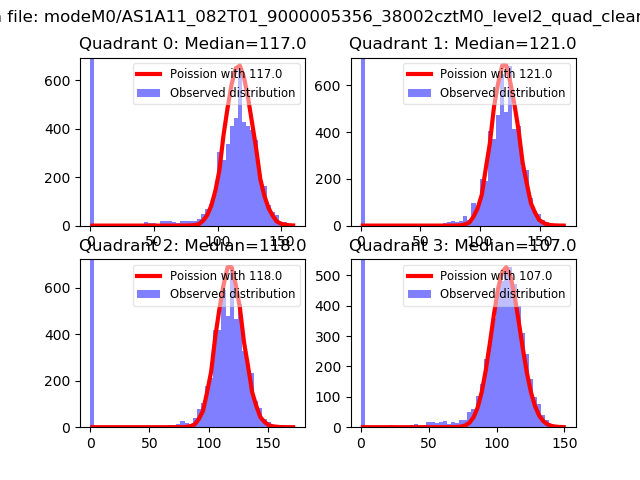
| Comparison with Poisson distribution Blue bars denote a histogram of data divided into 1 sec bins. Red curve is a Poisson curve with rate = median count rate of data. |
 |
 |
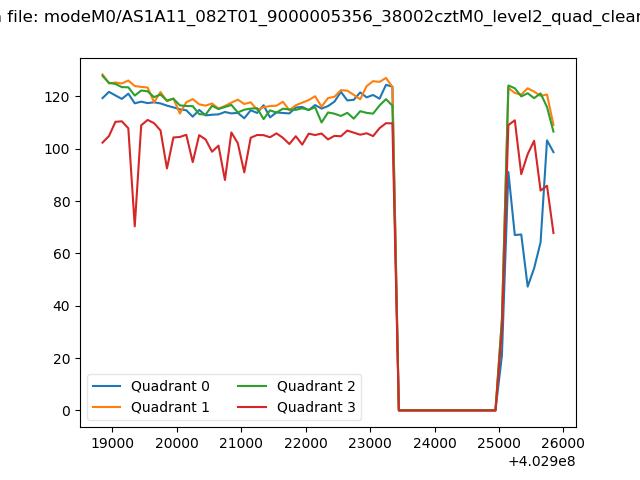
| Quadrant-wise count rates Data is divided into 100 sec bins |
 |
|
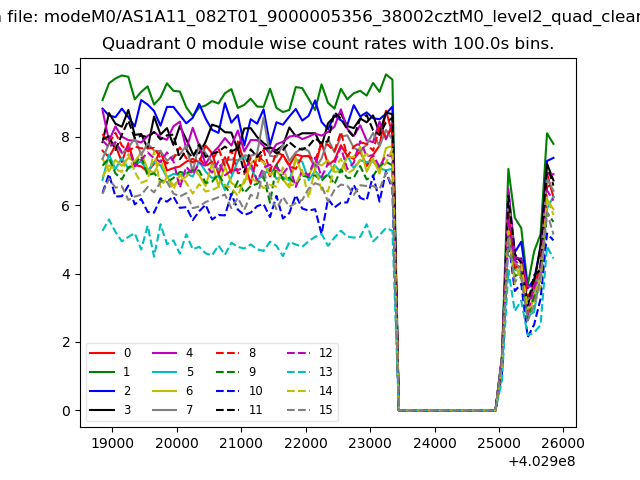
| Module-wise count rates for Quadrant A Data is divided into 100 sec bins |
 |
 |
| Module-wise count rates for Quadrant B Data is divided into 100 sec bins |
 |
 |
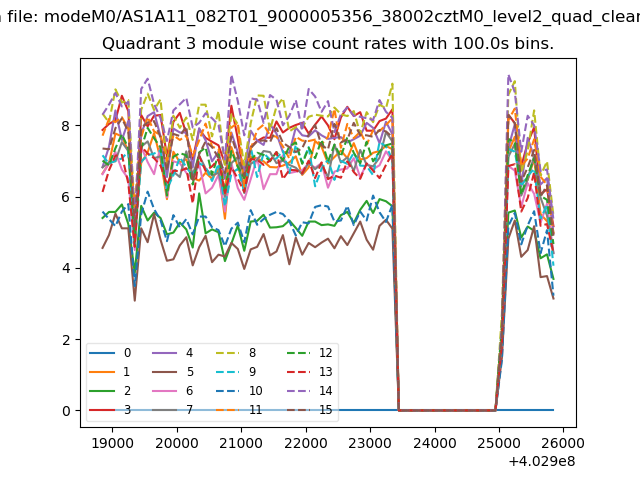
| Module-wise count rates for Quadrant C Data is divided into 100 sec bins |
 |
 |
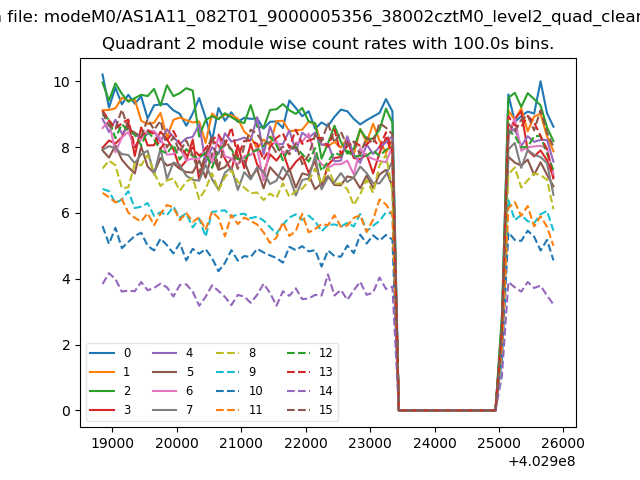
| Module-wise count rates for Quadrant D Data is divided into 100 sec bins |
 |
 |
| Parameter | Plot |
|---|---|
| CZT HV Monitor |  |
| D_VDD | 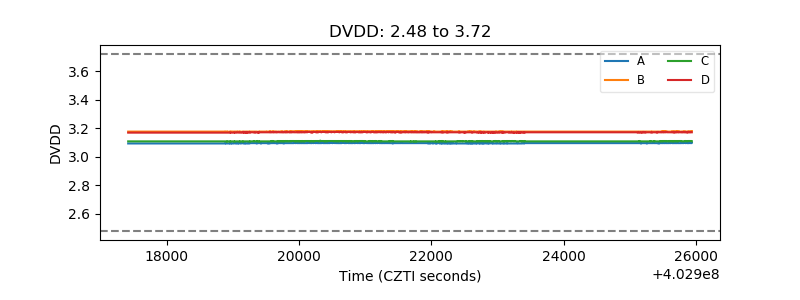 |
| Temperature 1 | 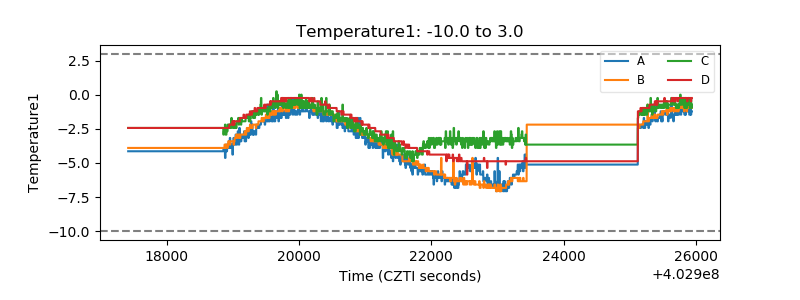 |
| Veto HV Monitor | 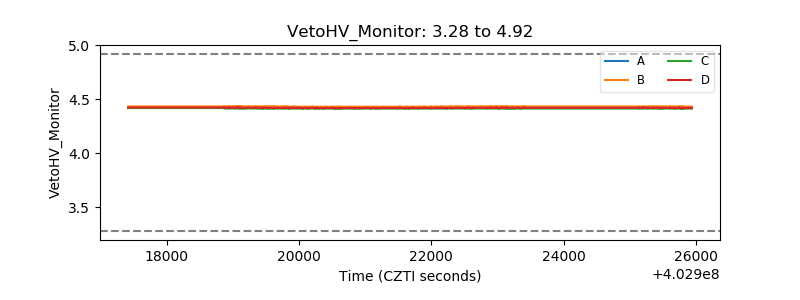 |
| Veto LLD | 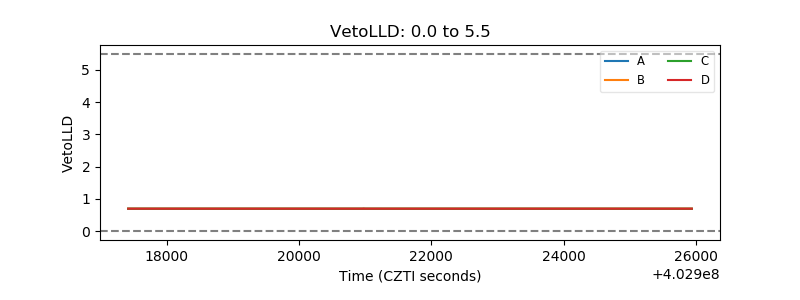 |
| Alpha Counter | 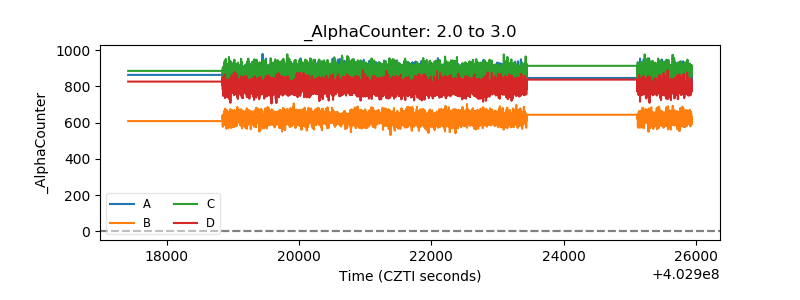 |
| _CPM_Rate | 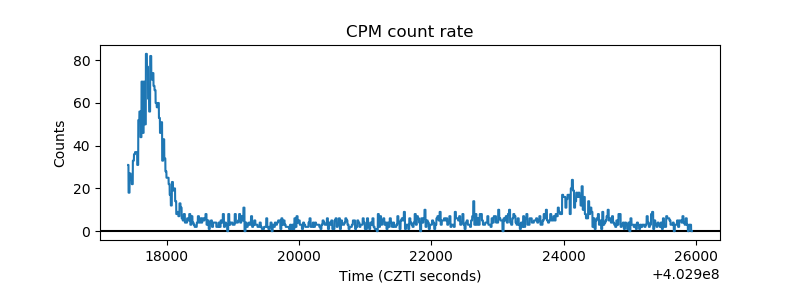 |
| CZT Counter | 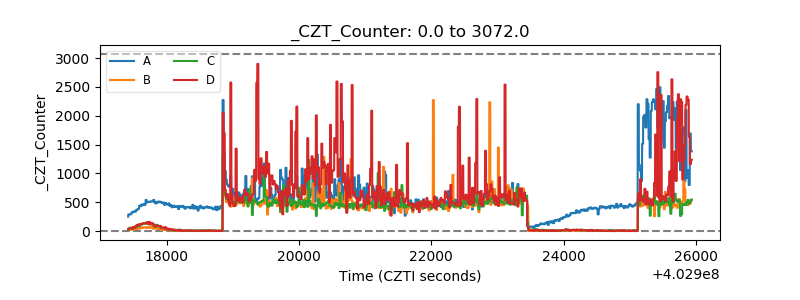 |
| +2.5 Volts monitor | 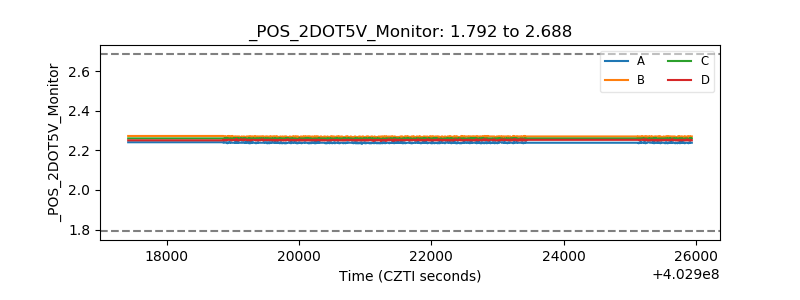 |
| +5 Volts monitor | 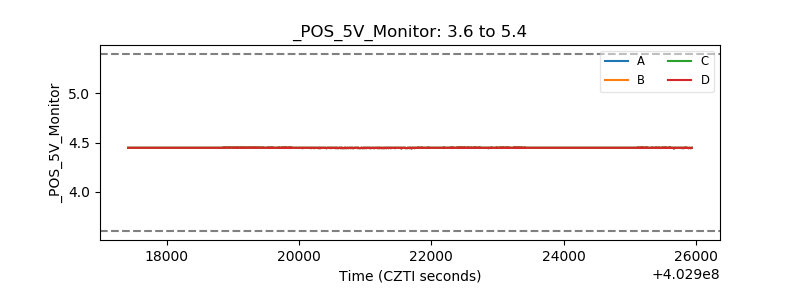 |
| _ROLL_ROT | 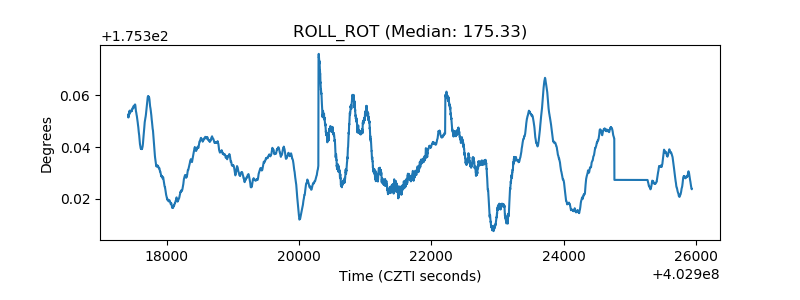 |
| _Roll_DEC | 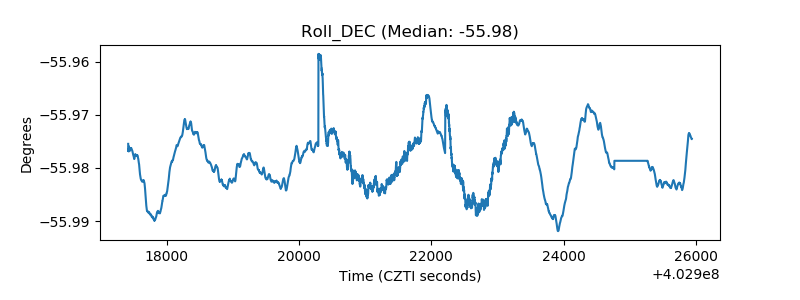 |
| _Roll_RA | 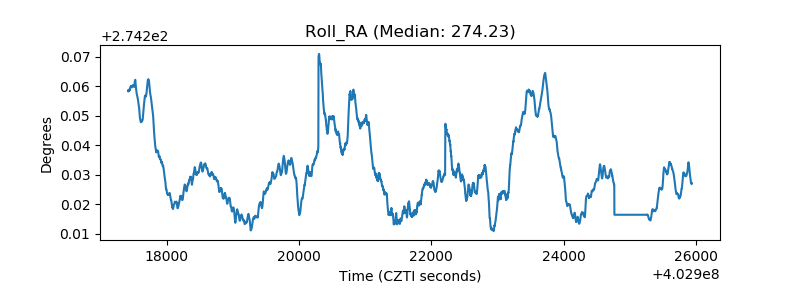 |
| Veto Counter | 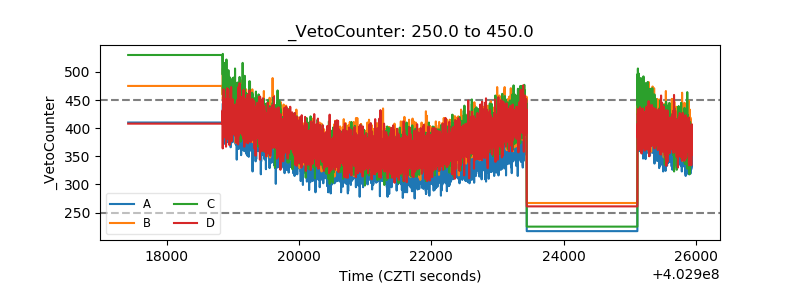 |