| Param | Original file | Final file |
|---|---|---|
| Filename | modeM0/AS1A11_082T01_9000005356_38003cztM0_level2.fits | modeM0/AS1A11_082T01_9000005356_38003cztM0_level2_quad_clean.evt |
| Size (bytes) | 560,275,200 | 92,808,000 |
| Size | 534.3 MB | 88.5 MB |
| Events in quadrant A | 7,154,343 | 595,818 |
| Events in quadrant B | 3,265,677 | 662,881 |
| Events in quadrant C | 2,904,522 | 659,559 |
| Events in quadrant D | 6,968,409 | 488,871 |
| Mode M0 | |||
|---|---|---|---|
| Quadrant | BADHDUFLAG | Total packets | Discarded packets |
| A | 0 | 25242 | 2 |
| B | 0 | 13542 | 1 |
| C | 0 | 12154 | 1 |
| D | 0 | 24560 | 1 |
| Mode SS | |||
|---|---|---|---|
| Quadrant | BADHDUFLAG | Total packets | Discarded packets |
| A | 0 | 116 | 0 |
| B | 0 | 116 | 0 |
| C | 0 | 116 | 0 |
| D | 0 | 116 | 0 |
| Mode M9 | |||
|---|---|---|---|
| Quadrant | BADHDUFLAG | Total packets | Discarded packets |
| A | 0 | 14 | 0 |
| B | 0 | 14 | 0 |
| C | 0 | 14 | 0 |
| D | 0 | 14 | 0 |
| Quadrant | Total seconds | Saturated seconds | Saturation percentage |
|---|---|---|---|
| A | 5763 | 816 | 14.159292% |
| B | 5763 | 197 | 3.418358% |
| C | 5763 | 18 | 0.312337% |
| D | 5763 | 1346 | 23.355891% |
Noise dominated data is calculated using 1-second bins in cleaned event files. If a bin has >2000 counts, and if more than 50% of those come from <1% of pixels, then it is considered to be noise-dominated and hence unusable.
| Quadrant | # 1 sec bins | Bins with >0 counts | Bins with >2000 counts | High rate bins dominated by noise | Noise dominated (total time) | Noise dominated (detector-on time) | Marked lightcurve |
|---|---|---|---|---|---|---|---|
| A | 7135 | 5764 | 715 | 715 | 10.02% | 12.40% | 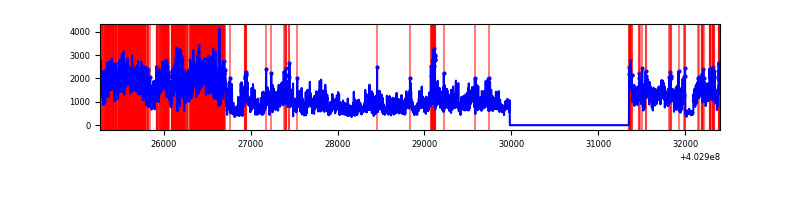 |
| B | 7135 | 5764 | 124 | 124 | 1.74% | 2.15% | 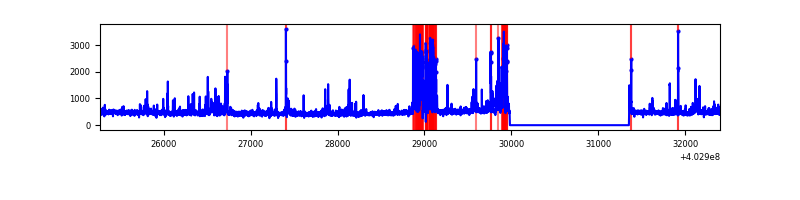 |
| C | 7135 | 5764 | 12 | 12 | 0.17% | 0.21% | 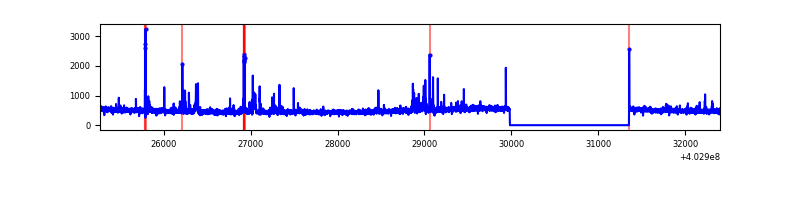 |
| D | 7135 | 5764 | 1148 | 1148 | 16.09% | 19.92% | 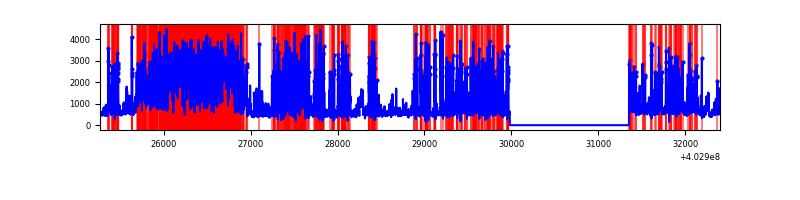 |
Top three noisy pixels from each quadrant. If the there are fewer than three noisy pixels in the level2.evt file, extra rows are filled as -1
| Pixel properties | Quadrant properties | ||||||
|---|---|---|---|---|---|---|---|
| Quadrant | DetID | PixID | Counts | Sigma | Mean | Median | Sigma |
| A | 15 | 222 | 3537734 | 27433.3 | 631 | 618 | 128.9 |
| A | 12 | 16 | 613932 | 4756.76 | 631 | 618 | 128.9 |
| A | 10 | 83 | 359821 | 2785.92 | 631 | 618 | 128.9 |
| B | 4 | 171 | 516945 | 4212.99 | 642 | 625 | 122.6 |
| B | 5 | 172 | 61210 | 494.35 | 642 | 625 | 122.6 |
| B | 5 | 200 | 43726 | 351.69 | 642 | 625 | 122.6 |
| C | 15 | 214 | 243791 | 1638.09 | 636 | 641 | 148.4 |
| C | 14 | 254 | 85114 | 569.09 | 636 | 641 | 148.4 |
| C | 1 | 23 | 59194 | 394.47 | 636 | 641 | 148.4 |
| D | 2 | 249 | 2174226 | 15259.29 | 579 | 561 | 142.4 |
| D | 1 | 52 | 1900888 | 13340.44 | 579 | 561 | 142.4 |
| D | 7 | 223 | 306594 | 2148.37 | 579 | 561 | 142.4 |
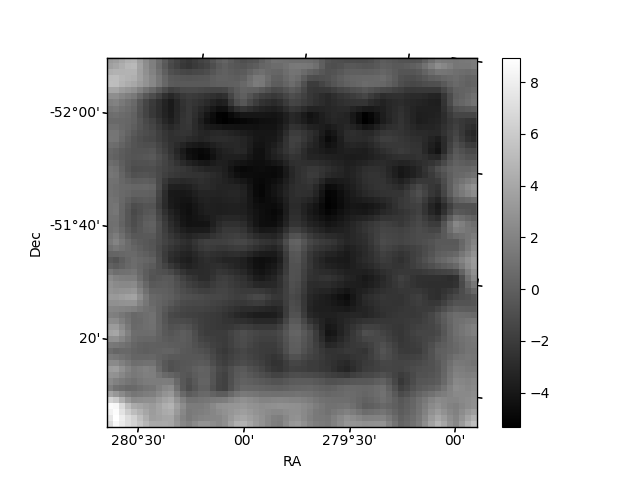
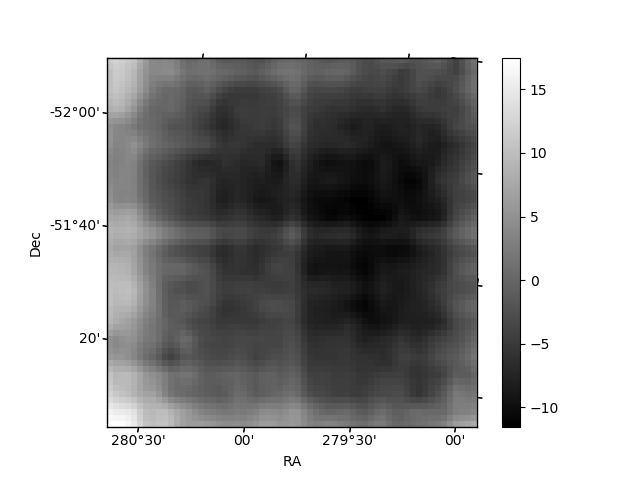
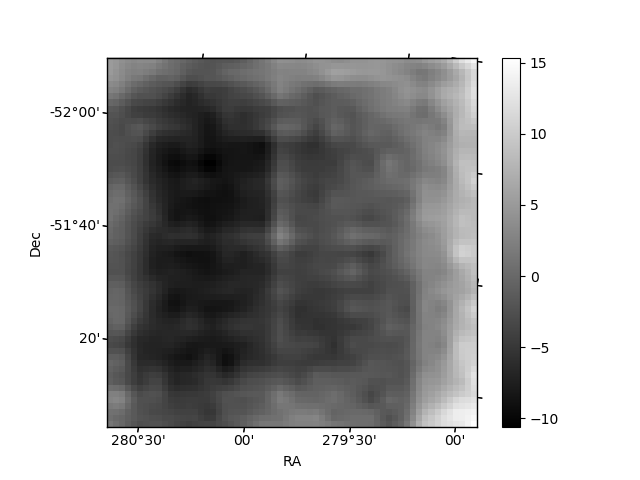
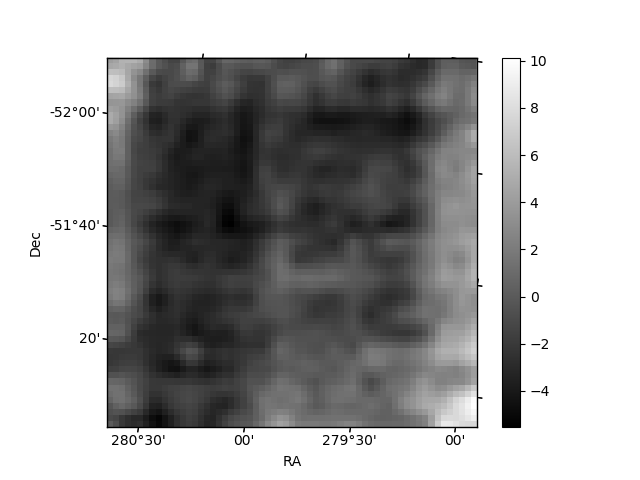
Histogram calculated using DETX and DETY for each event in the final _common_clean file
| Quadrant A | 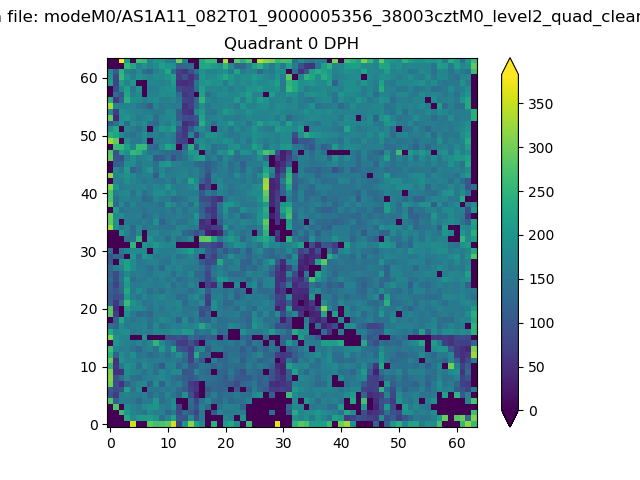 |
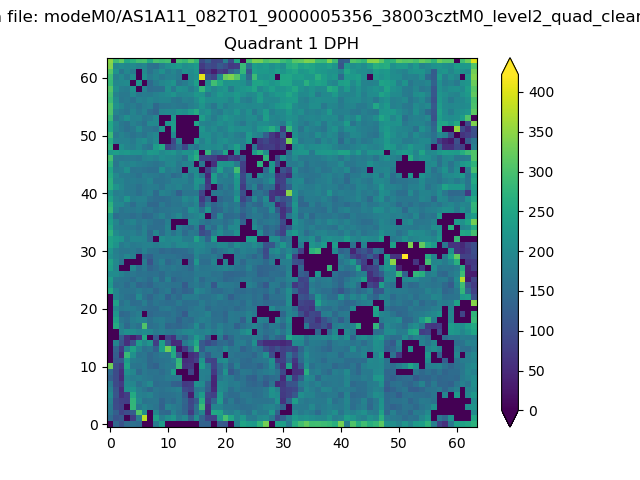 |
Quadrant B |
|---|---|---|---|
| Quadrant D | 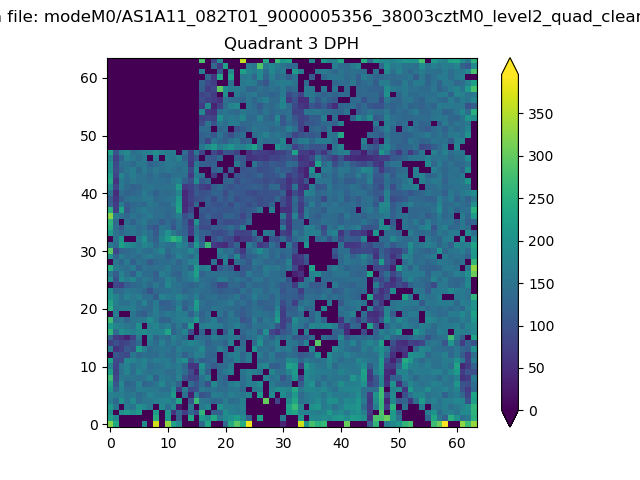 |
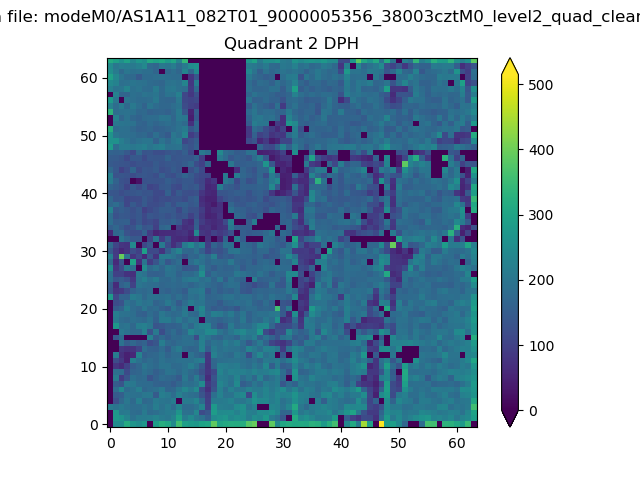 |
Quadrant C |
| Plot type | Count rate plots | Images |
|---|---|---|
| Comparison with Poisson distribution Blue bars denote a histogram of data divided into 1 sec bins. Red curve is a Poisson curve with rate = median count rate of data. |
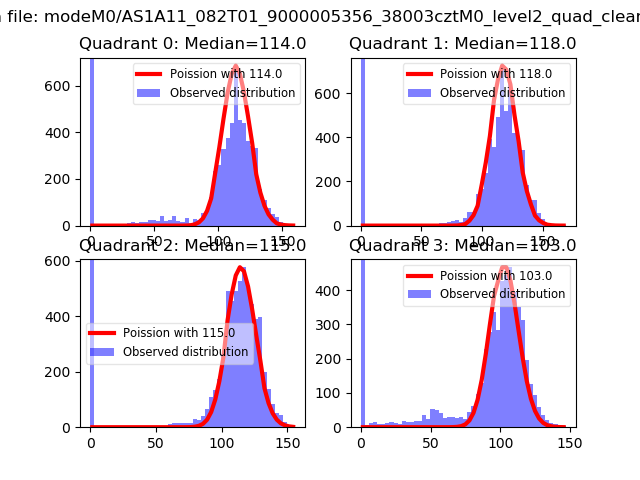 |
 |
| Quadrant-wise count rates Data is divided into 100 sec bins |
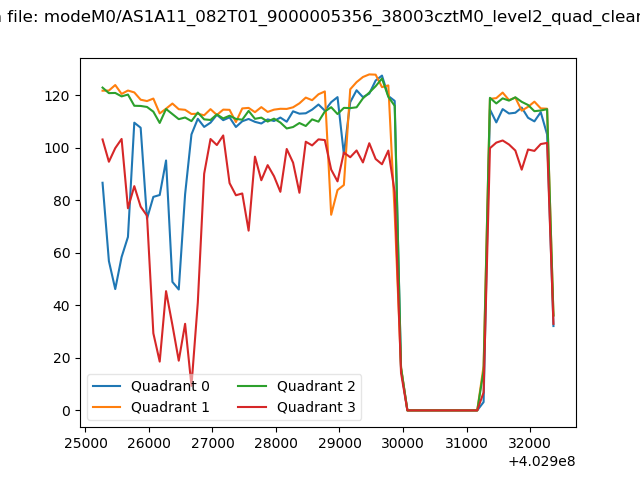 |
|
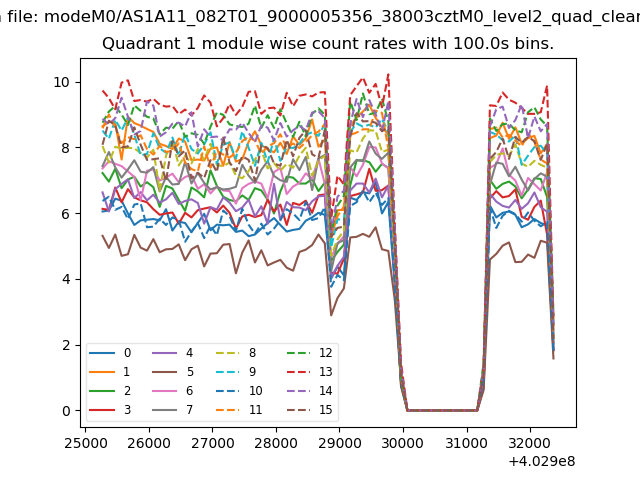
| Module-wise count rates for Quadrant A Data is divided into 100 sec bins |
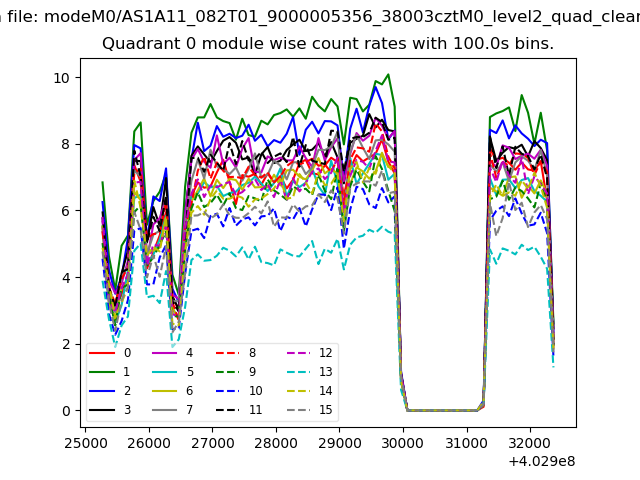 |
 |
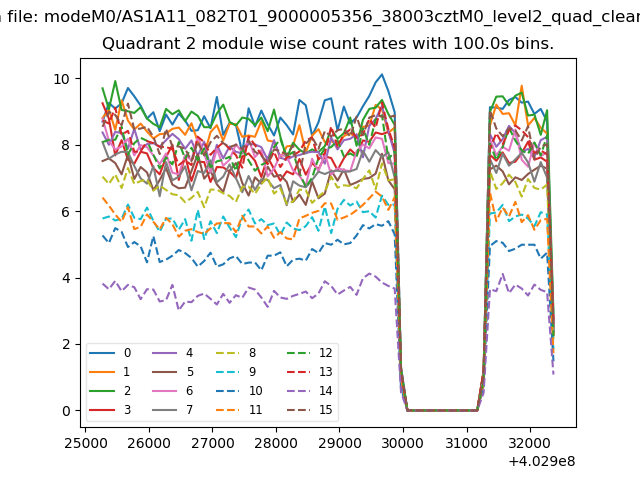
| Module-wise count rates for Quadrant B Data is divided into 100 sec bins |
 |
 |
| Module-wise count rates for Quadrant C Data is divided into 100 sec bins |
 |
 |
| Module-wise count rates for Quadrant D Data is divided into 100 sec bins |
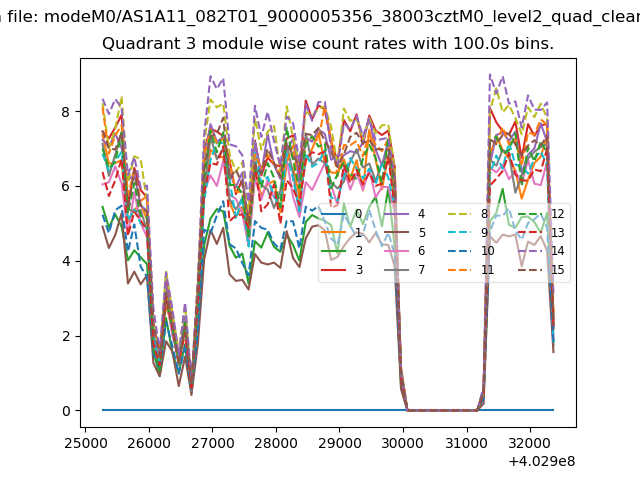 |
 |
| Parameter | Plot |
|---|---|
| CZT HV Monitor | 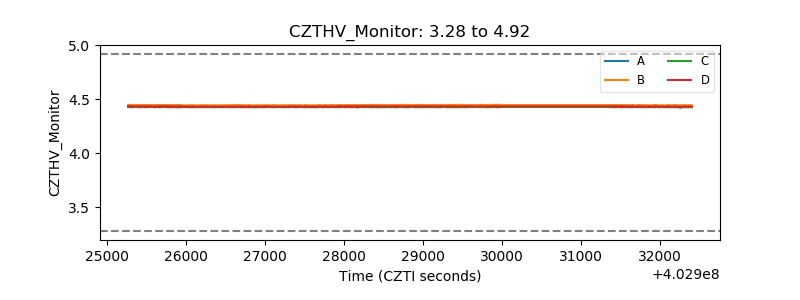 |
| D_VDD | 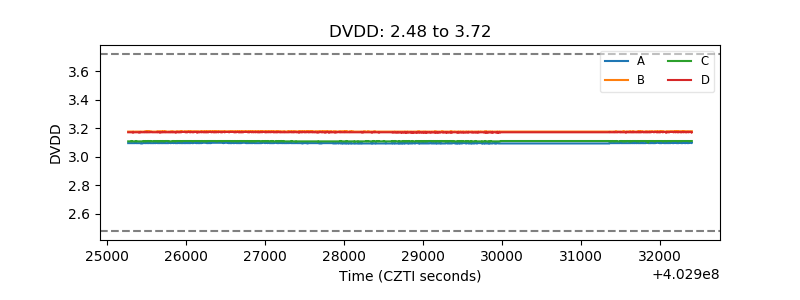 |
| Temperature 1 | 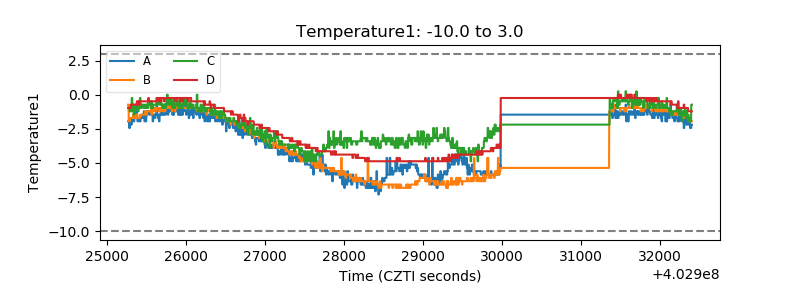 |
| Veto HV Monitor | 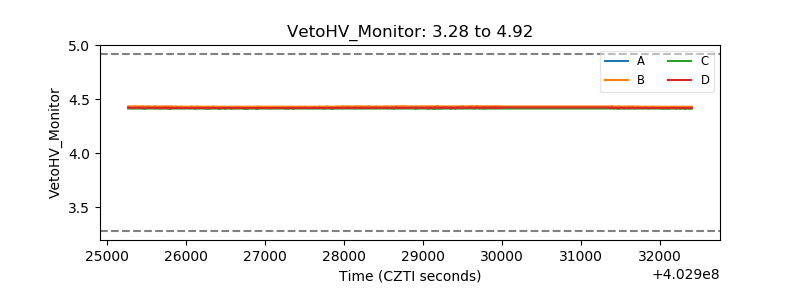 |
| Veto LLD | 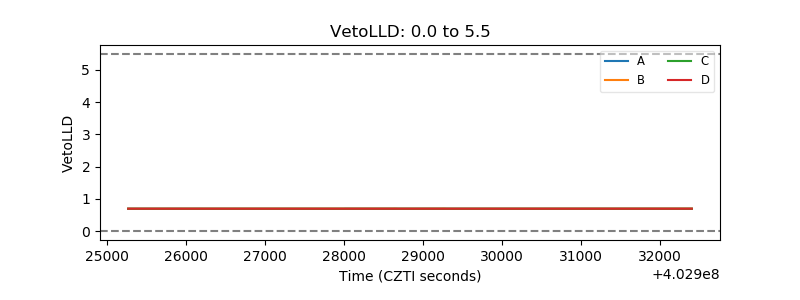 |
| Alpha Counter | 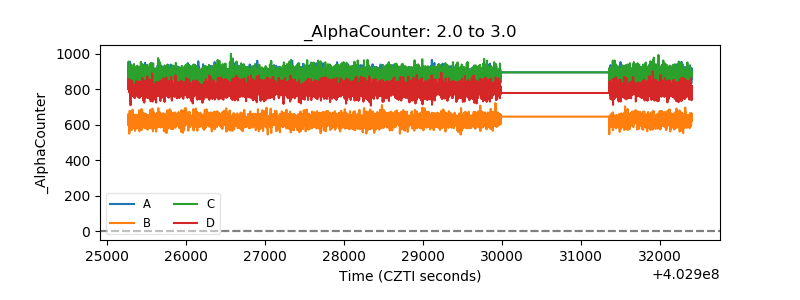 |
| _CPM_Rate | 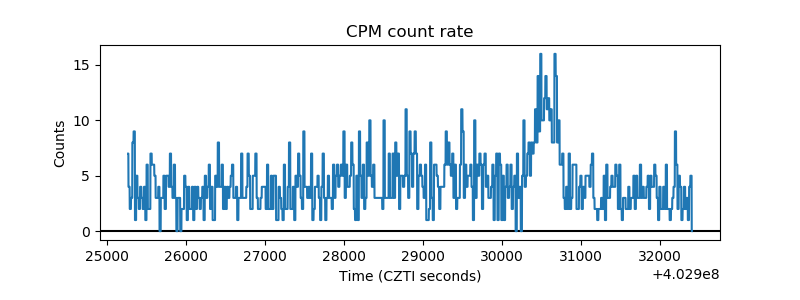 |
| CZT Counter | 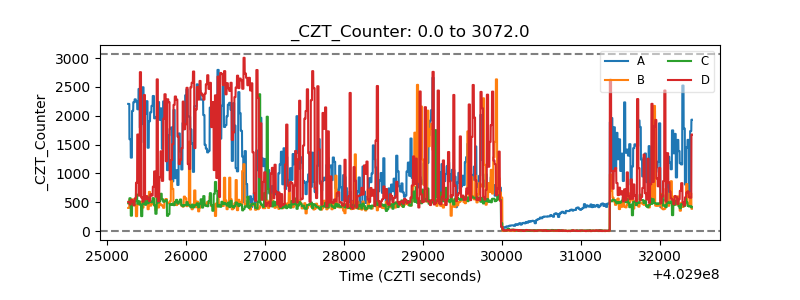 |
| +2.5 Volts monitor | 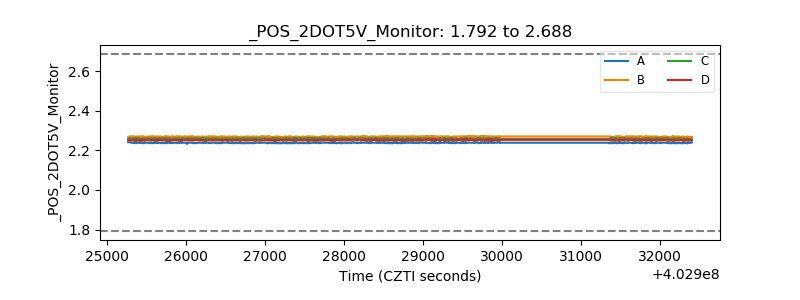 |
| +5 Volts monitor | 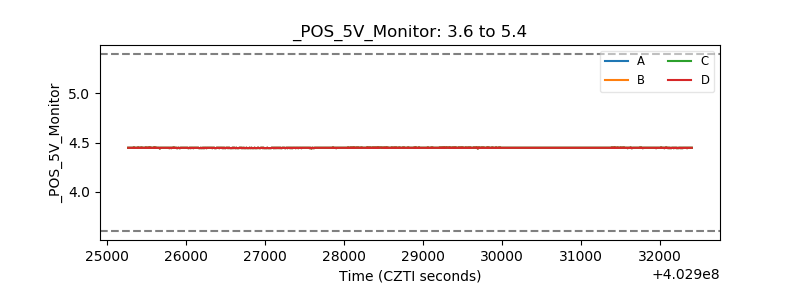 |
| _ROLL_ROT | 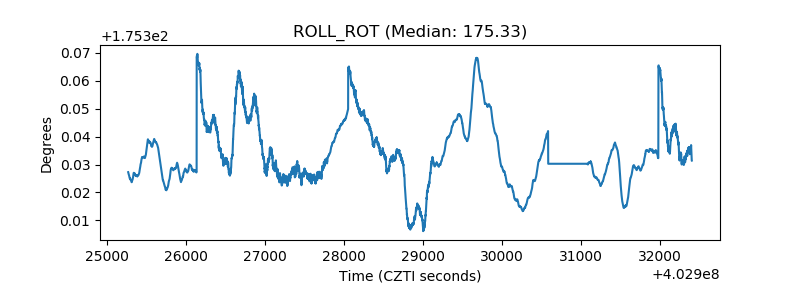 |
| _Roll_DEC | 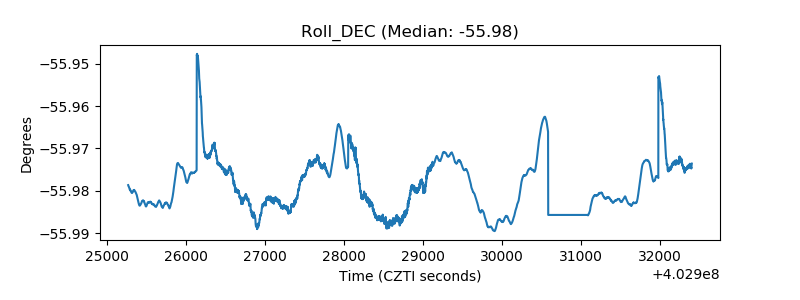 |
| _Roll_RA | 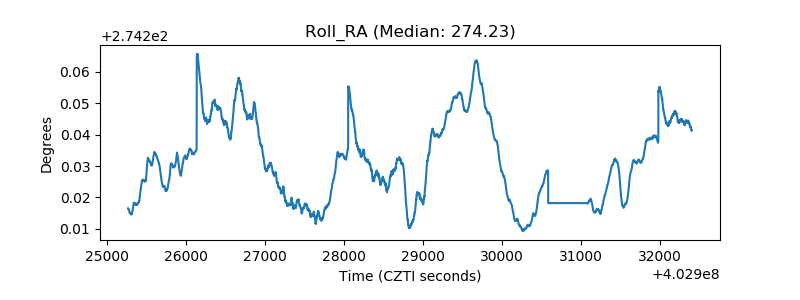 |
| Veto Counter | 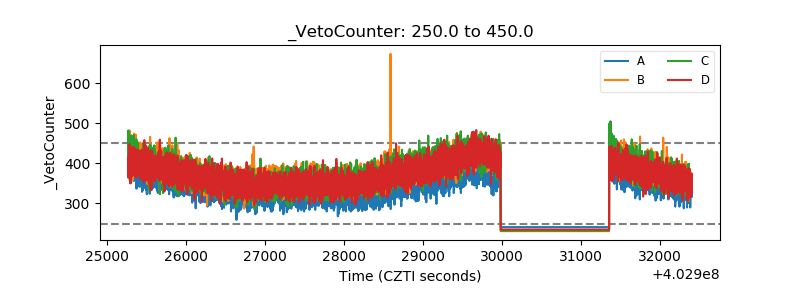 |