| Param | Original file | Final file |
|---|---|---|
| Filename | modeM0/AS1A11_082T01_9000005356_38004cztM0_level2.fits | modeM0/AS1A11_082T01_9000005356_38004cztM0_level2_quad_clean.evt |
| Size (bytes) | 433,321,920 | 99,887,040 |
| Size | 413.2 MB | 95.3 MB |
| Events in quadrant A | 4,154,198 | 671,748 |
| Events in quadrant B | 3,143,468 | 687,270 |
| Events in quadrant C | 2,953,178 | 669,915 |
| Events in quadrant D | 5,329,738 | 581,957 |
| Mode M0 | |||
|---|---|---|---|
| Quadrant | BADHDUFLAG | Total packets | Discarded packets |
| A | 0 | 16149 | 3 |
| B | 0 | 13172 | 2 |
| C | 0 | 12445 | 2 |
| D | 0 | 19924 | 2 |
| Mode SS | |||
|---|---|---|---|
| Quadrant | BADHDUFLAG | Total packets | Discarded packets |
| A | 0 | 120 | 0 |
| B | 0 | 120 | 0 |
| C | 0 | 120 | 0 |
| D | 0 | 120 | 0 |
| Mode M9 | |||
|---|---|---|---|
| Quadrant | BADHDUFLAG | Total packets | Discarded packets |
| A | 0 | 15 | 0 |
| B | 0 | 15 | 0 |
| C | 0 | 15 | 0 |
| D | 0 | 16 | 0 |
| Quadrant | Total seconds | Saturated seconds | Saturation percentage |
|---|---|---|---|
| A | 5917 | 103 | 1.740747% |
| B | 5917 | 75 | 1.267534% |
| C | 5917 | 15 | 0.253507% |
| D | 5917 | 449 | 7.588305% |
Noise dominated data is calculated using 1-second bins in cleaned event files. If a bin has >2000 counts, and if more than 50% of those come from <1% of pixels, then it is considered to be noise-dominated and hence unusable.
| Quadrant | # 1 sec bins | Bins with >0 counts | Bins with >2000 counts | High rate bins dominated by noise | Noise dominated (total time) | Noise dominated (detector-on time) | Marked lightcurve |
|---|---|---|---|---|---|---|---|
| A | 7201 | 5918 | 56 | 56 | 0.78% | 0.95% | 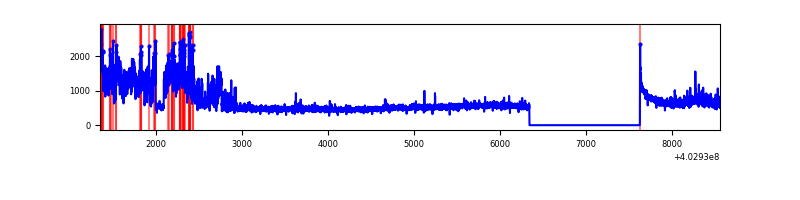 |
| B | 7201 | 5918 | 52 | 52 | 0.72% | 0.88% | 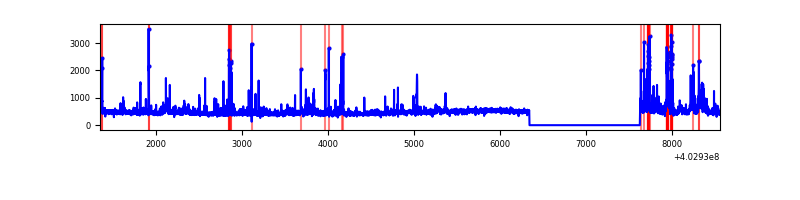 |
| C | 7201 | 5918 | 12 | 12 | 0.17% | 0.20% | 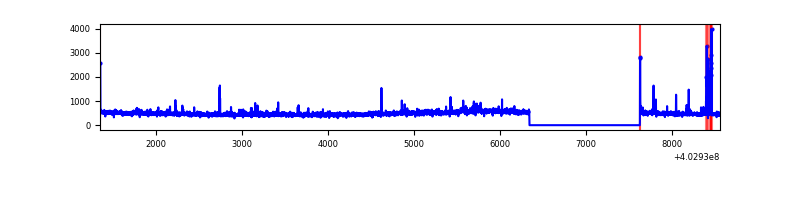 |
| D | 7201 | 5918 | 416 | 416 | 5.78% | 7.03% | 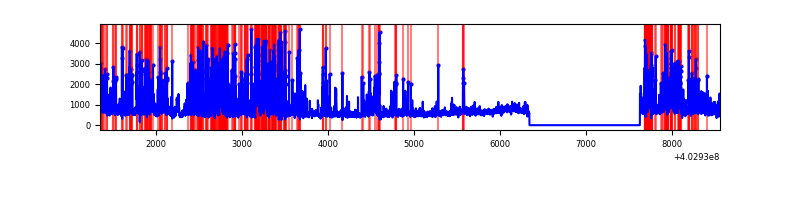 |
Top three noisy pixels from each quadrant. If the there are fewer than three noisy pixels in the level2.evt file, extra rows are filled as -1
| Pixel properties | Quadrant properties | ||||||
|---|---|---|---|---|---|---|---|
| Quadrant | DetID | PixID | Counts | Sigma | Mean | Median | Sigma |
| A | 15 | 222 | 902485 | 6589.48 | 668 | 655 | 136.9 |
| A | 10 | 83 | 419674 | 3061.68 | 668 | 655 | 136.9 |
| A | 12 | 16 | 176219 | 1282.81 | 668 | 655 | 136.9 |
| B | 4 | 171 | 143865 | 1124.28 | 667 | 649 | 127.4 |
| B | 5 | 172 | 116671 | 910.8 | 667 | 649 | 127.4 |
| B | 5 | 255 | 88599 | 690.43 | 667 | 649 | 127.4 |
| C | 15 | 214 | 250063 | 1610.7 | 654 | 657 | 154.8 |
| C | 14 | 254 | 110263 | 707.85 | 654 | 657 | 154.8 |
| C | 0 | 10 | 16020 | 99.22 | 654 | 657 | 154.8 |
| D | 1 | 52 | 1053302 | 6746.49 | 634 | 614 | 156.0 |
| D | 2 | 249 | 861572 | 5517.72 | 634 | 614 | 156.0 |
| D | 7 | 223 | 641962 | 4110.28 | 634 | 614 | 156.0 |
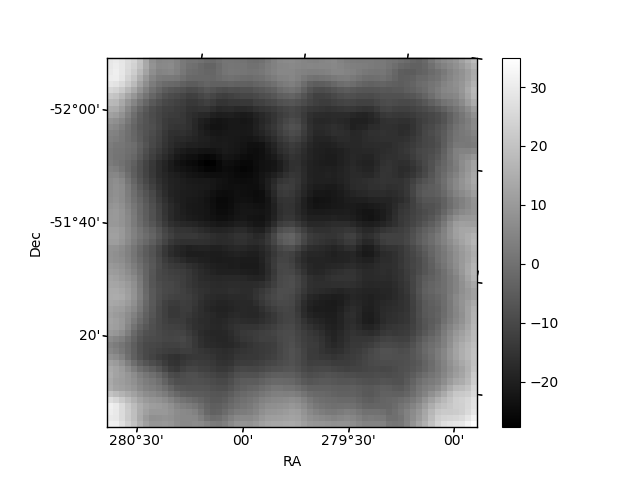
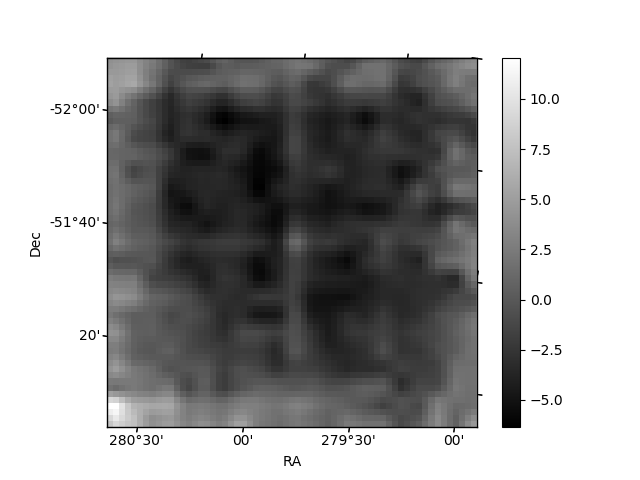
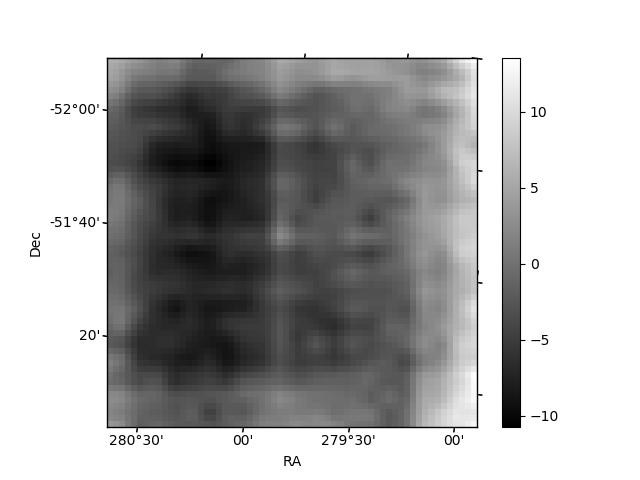
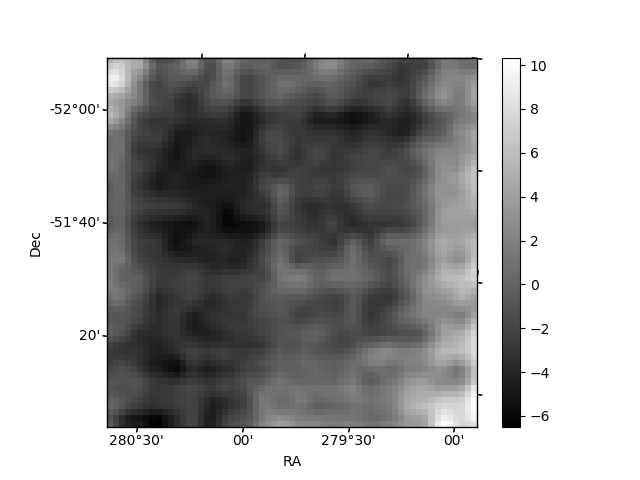
Histogram calculated using DETX and DETY for each event in the final _common_clean file
| Quadrant A | 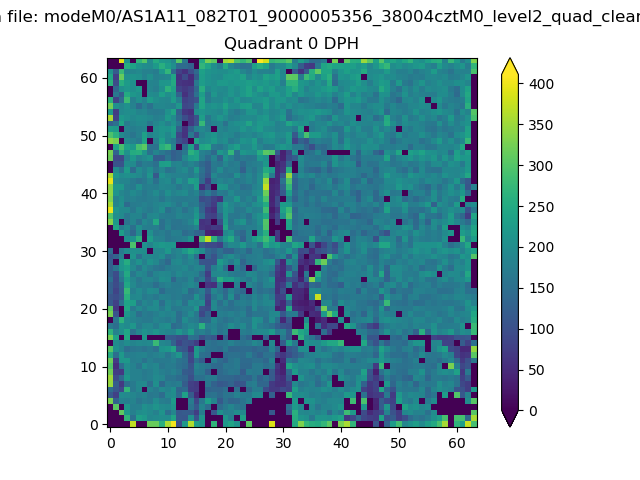 |
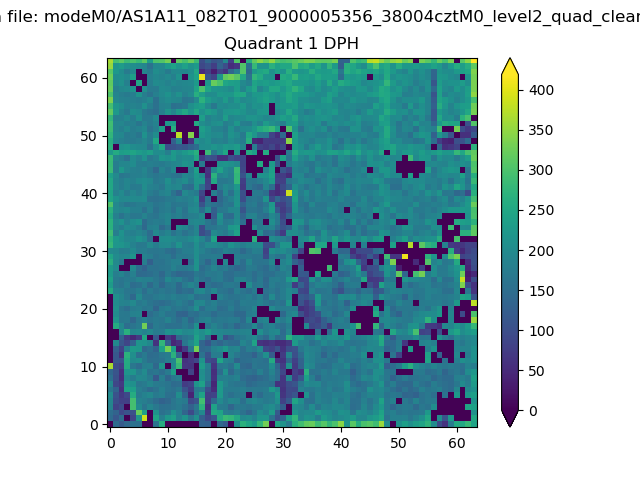 |
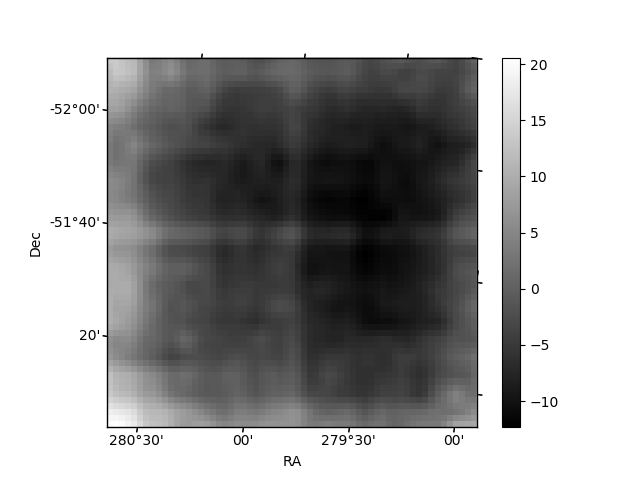
Quadrant B |
|---|---|---|---|
| Quadrant D | 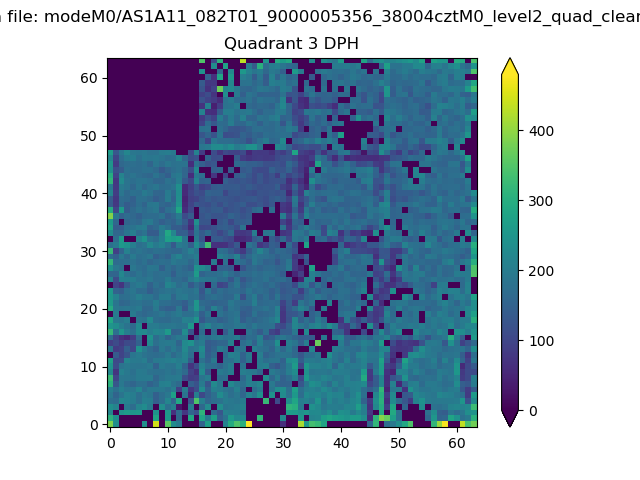 |
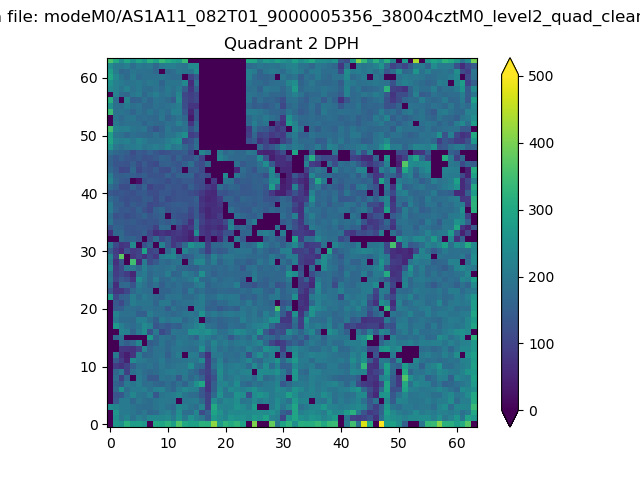 |
Quadrant C |
| Plot type | Count rate plots | Images |
|---|---|---|
| Comparison with Poisson distribution Blue bars denote a histogram of data divided into 1 sec bins. Red curve is a Poisson curve with rate = median count rate of data. |
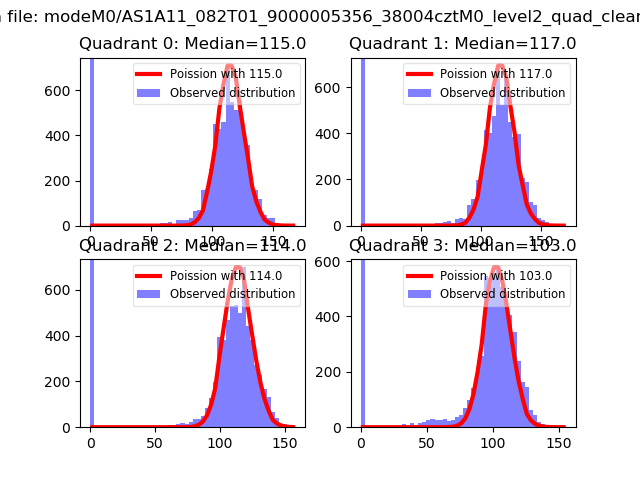 |
 |
| Quadrant-wise count rates Data is divided into 100 sec bins |
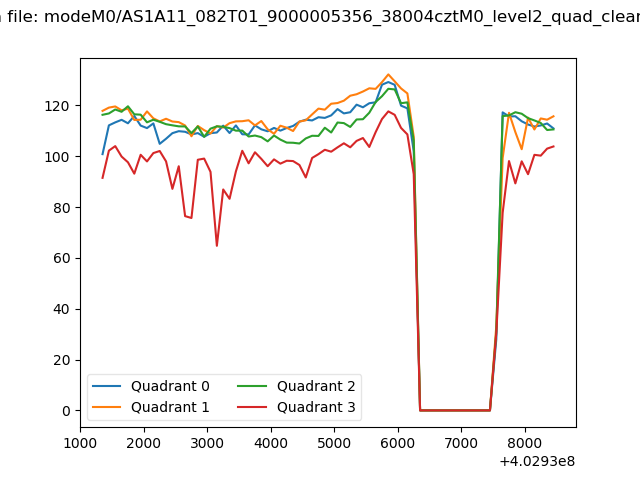 |
|
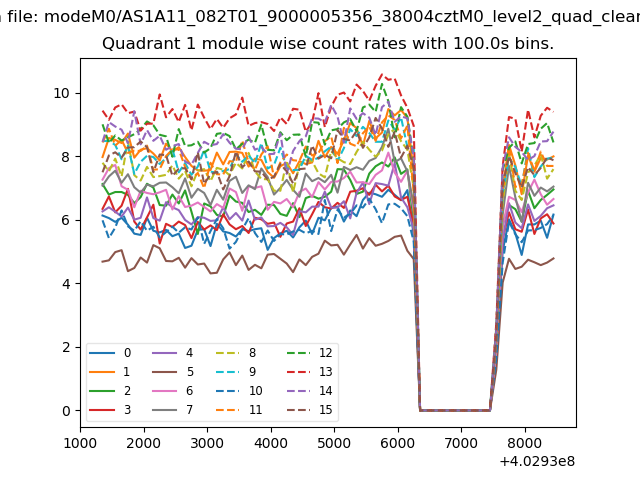
| Module-wise count rates for Quadrant A Data is divided into 100 sec bins |
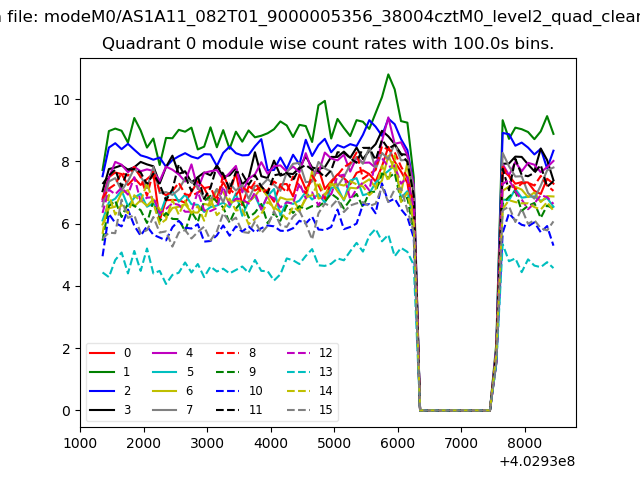 |
 |
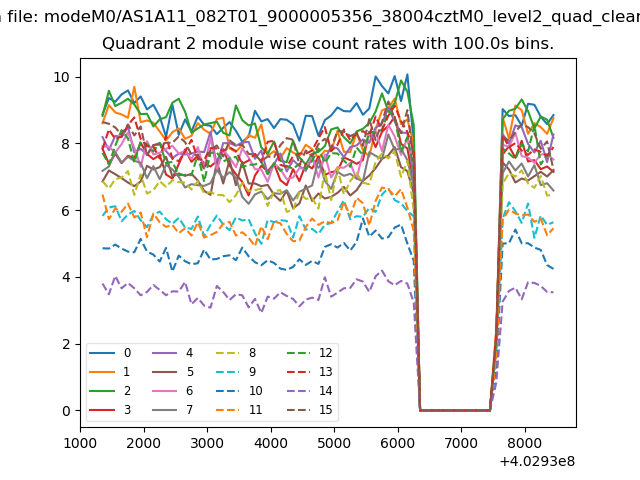
| Module-wise count rates for Quadrant B Data is divided into 100 sec bins |
 |
 |
| Module-wise count rates for Quadrant C Data is divided into 100 sec bins |
 |
 |
| Module-wise count rates for Quadrant D Data is divided into 100 sec bins |
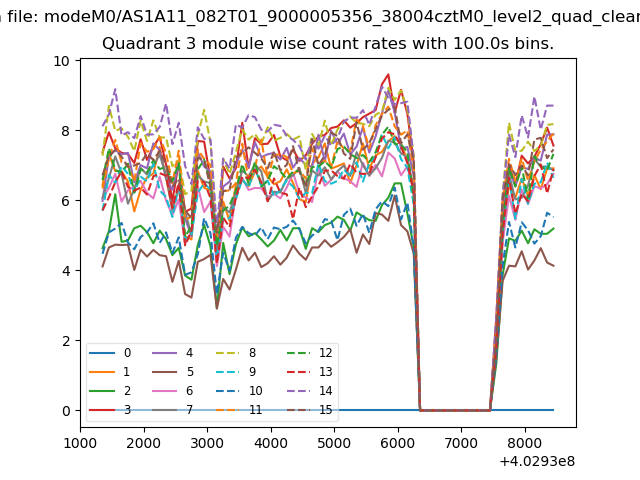 |
 |
| Parameter | Plot |
|---|---|
| CZT HV Monitor | 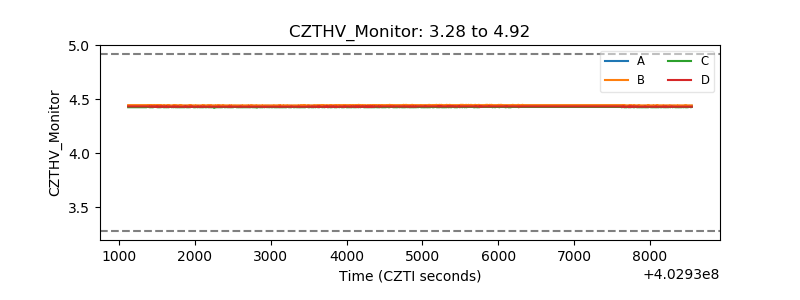 |
| D_VDD | 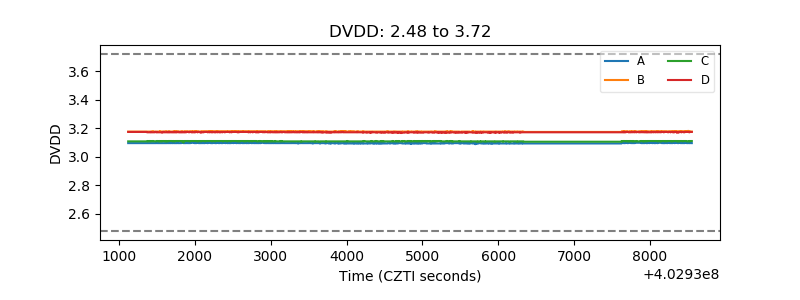 |
| Temperature 1 | 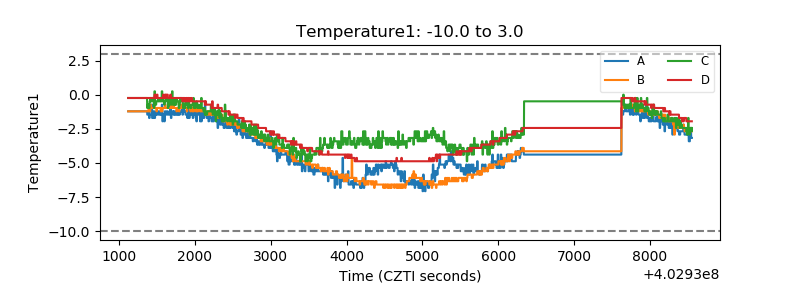 |
| Veto HV Monitor | 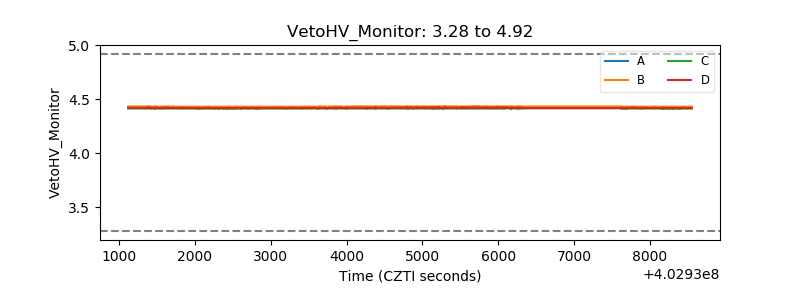 |
| Veto LLD | 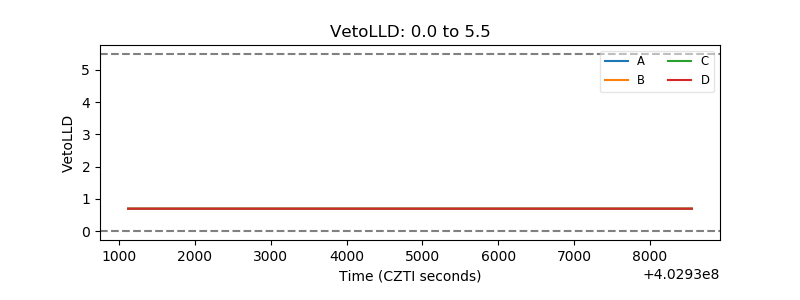 |
| Alpha Counter | 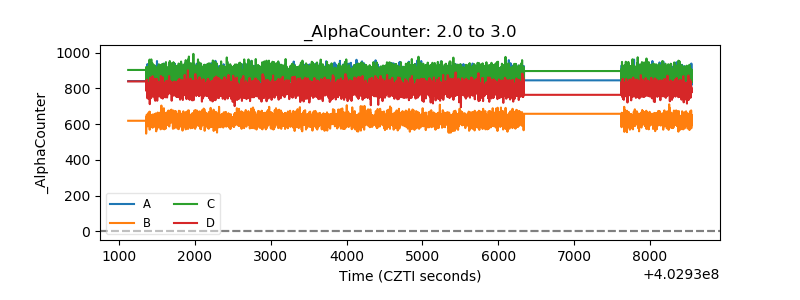 |
| _CPM_Rate | 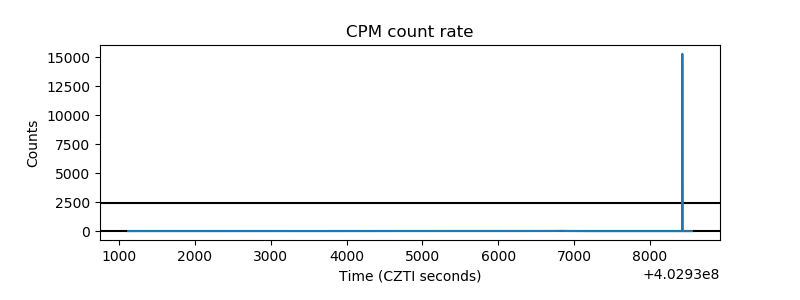 |
| CZT Counter | 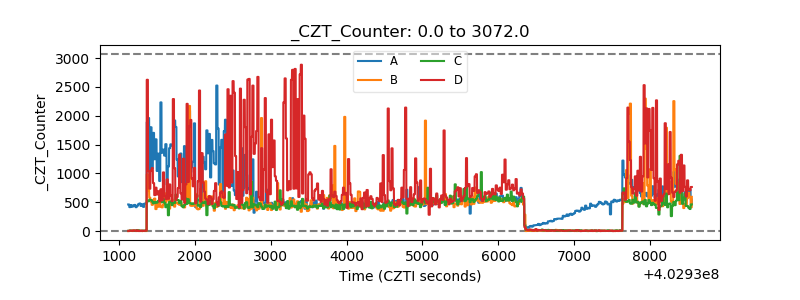 |
| +2.5 Volts monitor | 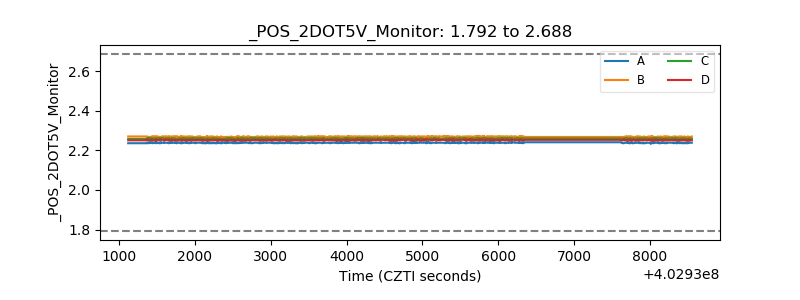 |
| +5 Volts monitor | 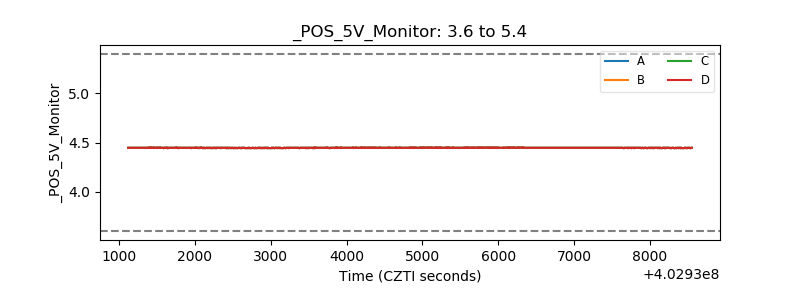 |
| _ROLL_ROT | 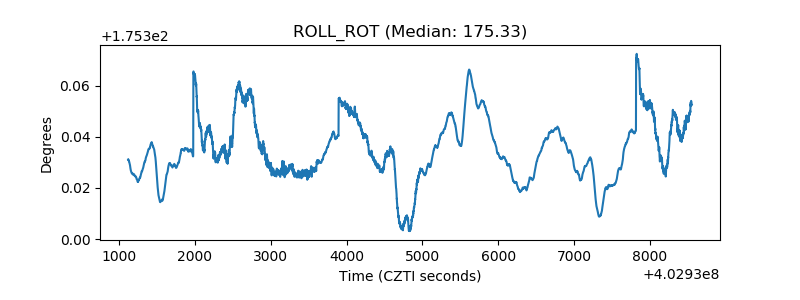 |
| _Roll_DEC | 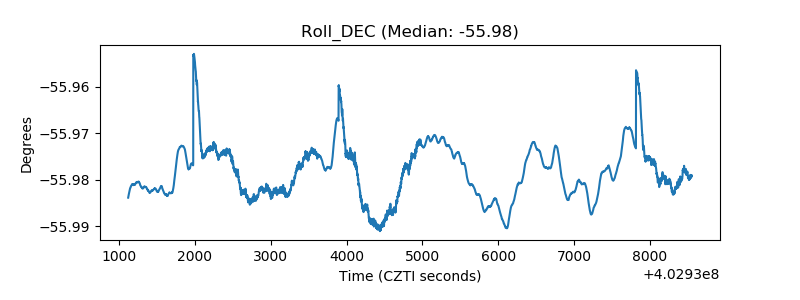 |
| _Roll_RA | 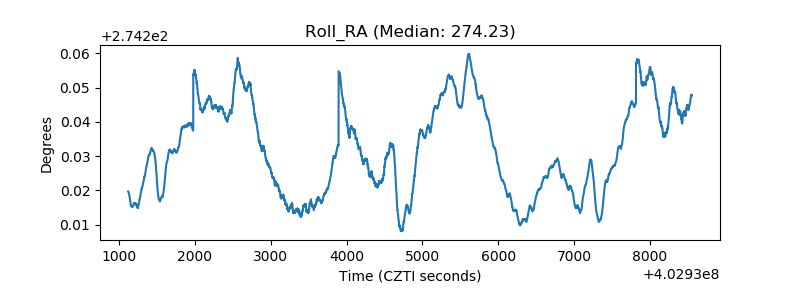 |
| Veto Counter | 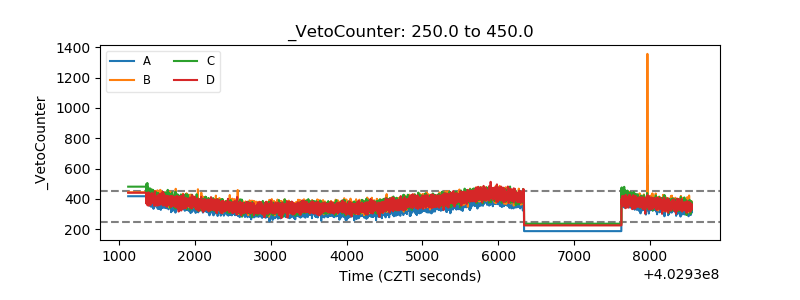 |