| Param | Original file | Final file |
|---|---|---|
| Filename | modeM0/AS1A11_082T01_9000005356_38007cztM0_level2.fits | modeM0/AS1A11_082T01_9000005356_38007cztM0_level2_quad_clean.evt |
| Size (bytes) | 1,076,592,960 | 256,726,080 |
| Size | 1.0 GB | 244.8 MB |
| Events in quadrant A | 8,683,094 | 1,741,826 |
| Events in quadrant B | 9,322,011 | 1,731,522 |
| Events in quadrant C | 7,704,571 | 1,728,299 |
| Events in quadrant D | 12,939,325 | 1,498,395 |
| Mode M0 | |||
|---|---|---|---|
| Quadrant | BADHDUFLAG | Total packets | Discarded packets |
| A | 0 | 35893 | 5 |
| B | 0 | 38056 | 4 |
| C | 0 | 32646 | 4 |
| D | 0 | 49011 | 4 |
| Mode SS | |||
|---|---|---|---|
| Quadrant | BADHDUFLAG | Total packets | Discarded packets |
| A | 0 | 316 | 0 |
| B | 0 | 316 | 0 |
| C | 0 | 316 | 0 |
| D | 0 | 316 | 0 |
| Mode M9 | |||
|---|---|---|---|
| Quadrant | BADHDUFLAG | Total packets | Discarded packets |
| A | 0 | 46 | 0 |
| B | 0 | 46 | 0 |
| C | 0 | 46 | 0 |
| D | 0 | 47 | 0 |
| Quadrant | Total seconds | Saturated seconds | Saturation percentage |
|---|---|---|---|
| A | 15550 | 66 | 0.424437% |
| B | 15550 | 555 | 3.569132% |
| C | 15550 | 30 | 0.192926% |
| D | 15550 | 1083 | 6.964630% |
Noise dominated data is calculated using 1-second bins in cleaned event files. If a bin has >2000 counts, and if more than 50% of those come from <1% of pixels, then it is considered to be noise-dominated and hence unusable.
| Quadrant | # 1 sec bins | Bins with >0 counts | Bins with >2000 counts | High rate bins dominated by noise | Noise dominated (total time) | Noise dominated (detector-on time) | Marked lightcurve |
|---|---|---|---|---|---|---|---|
| A | 19759 | 15553 | 32 | 32 | 0.16% | 0.21% | 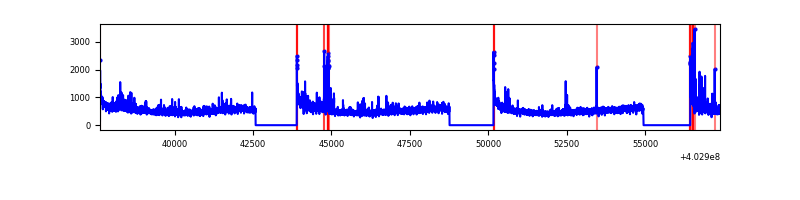 |
| B | 19759 | 15553 | 375 | 375 | 1.90% | 2.41% | 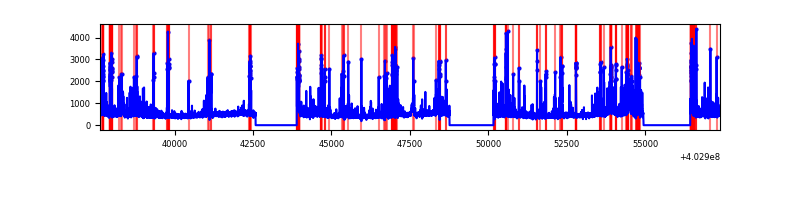 |
| C | 19759 | 15553 | 28 | 28 | 0.14% | 0.18% | 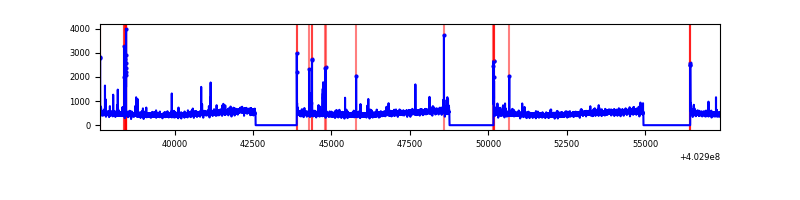 |
| D | 19759 | 15553 | 1000 | 1000 | 5.06% | 6.43% | 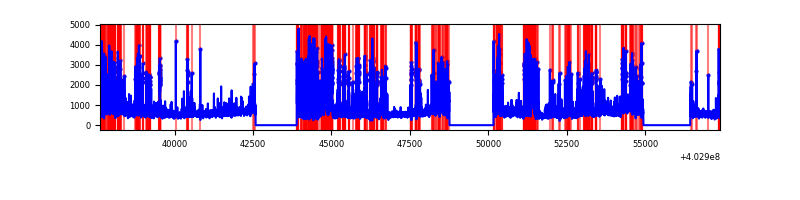 |
Top three noisy pixels from each quadrant. If the there are fewer than three noisy pixels in the level2.evt file, extra rows are filled as -1
| Pixel properties | Quadrant properties | ||||||
|---|---|---|---|---|---|---|---|
| Quadrant | DetID | PixID | Counts | Sigma | Mean | Median | Sigma |
| A | 10 | 83 | 978548 | 2761.99 | 1759 | 1726 | 353.7 |
| A | 15 | 222 | 391914 | 1103.27 | 1759 | 1726 | 353.7 |
| A | 12 | 16 | 291306 | 818.79 | 1759 | 1726 | 353.7 |
| B | 5 | 184 | 587985 | 1765.89 | 1740 | 1692 | 332.0 |
| B | 5 | 255 | 530321 | 1592.21 | 1740 | 1692 | 332.0 |
| B | 5 | 200 | 450426 | 1351.57 | 1740 | 1692 | 332.0 |
| C | 15 | 214 | 649434 | 1615.57 | 1727 | 1733 | 400.9 |
| C | 14 | 254 | 133223 | 327.98 | 1727 | 1733 | 400.9 |
| C | 0 | 10 | 59793 | 144.82 | 1727 | 1733 | 400.9 |
| D | 1 | 52 | 2018548 | 4936.27 | 1669 | 1620 | 408.6 |
| D | 7 | 223 | 1399063 | 3420.13 | 1669 | 1620 | 408.6 |
| D | 2 | 249 | 1118672 | 2733.9 | 1669 | 1620 | 408.6 |
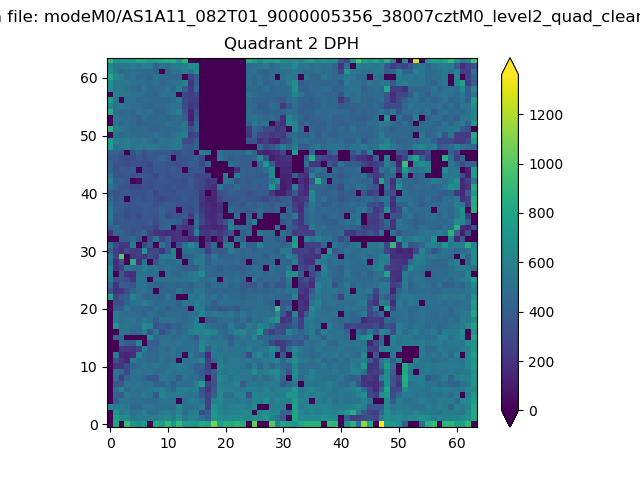
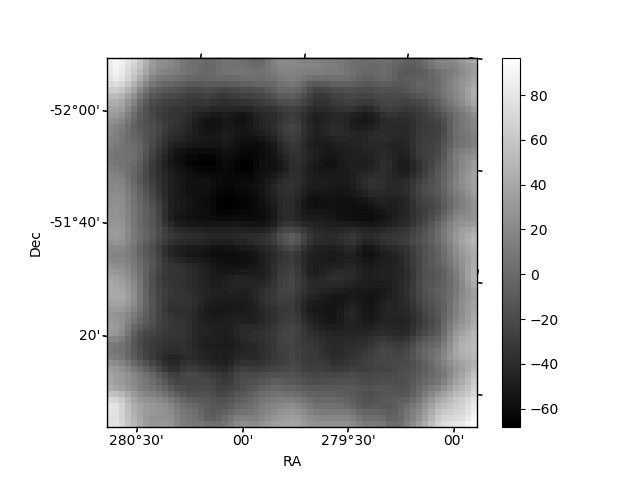
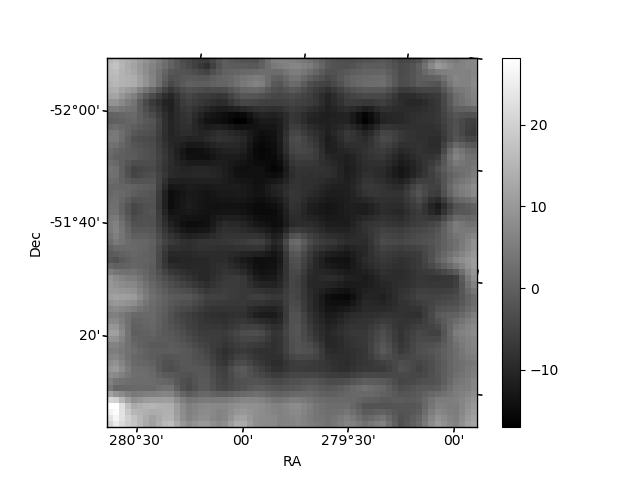
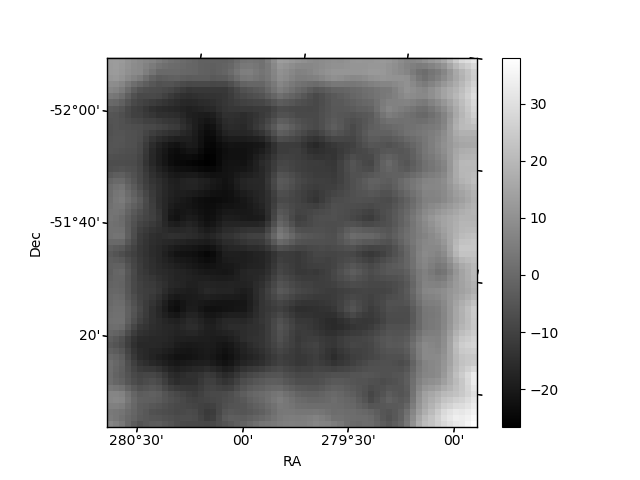
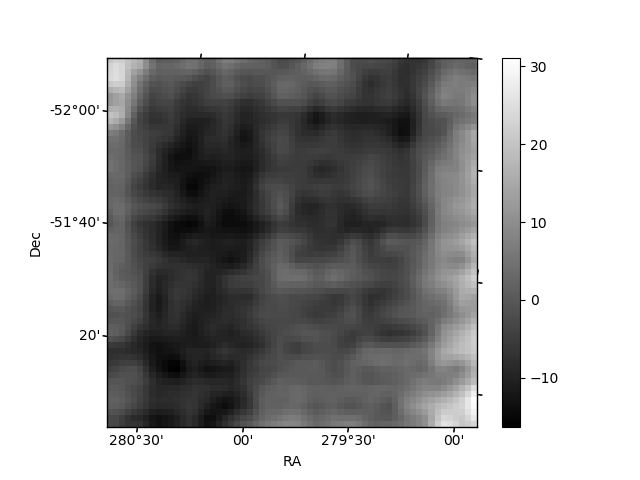
Histogram calculated using DETX and DETY for each event in the final _common_clean file
| Quadrant A | 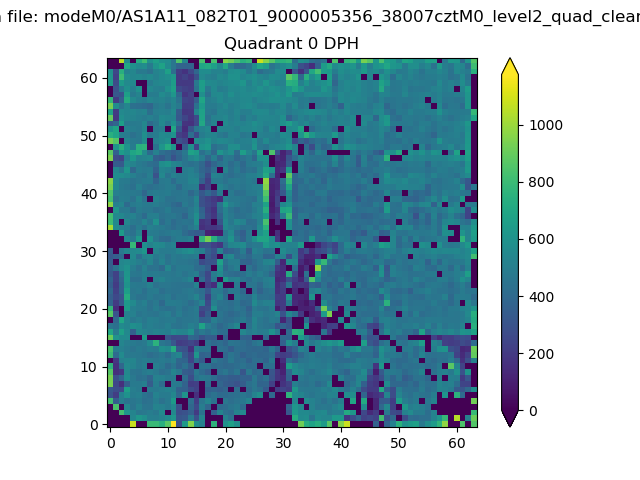 |
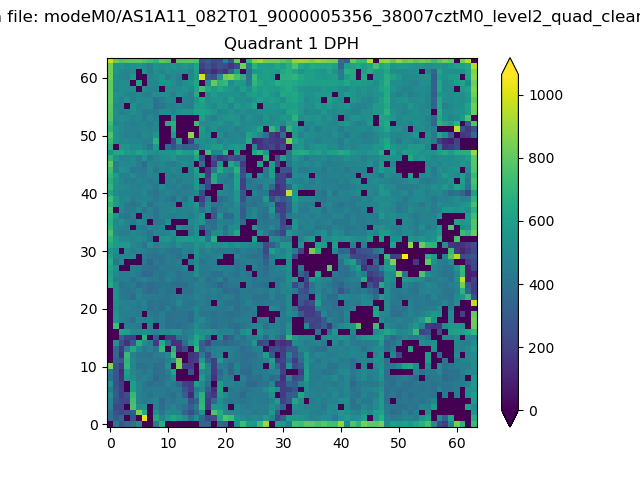 |
Quadrant B |
|---|---|---|---|
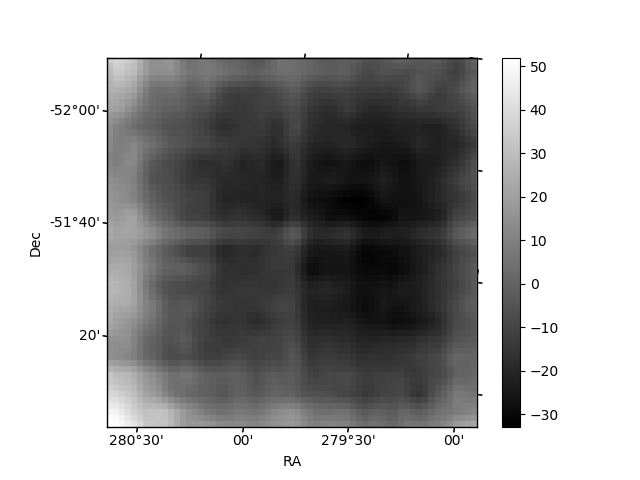
| Quadrant D | 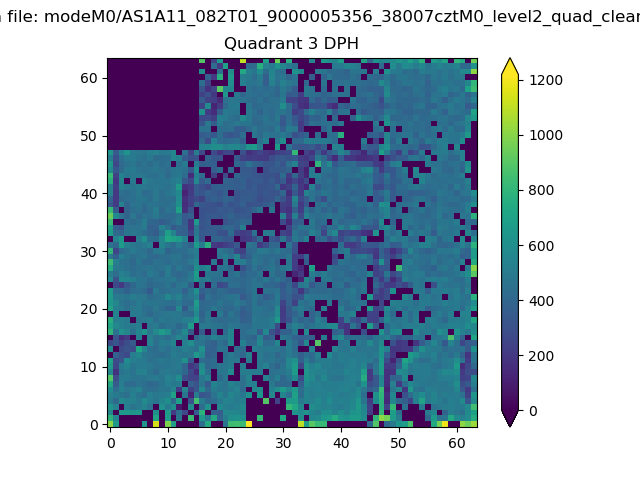 |
 |
Quadrant C |
| Plot type | Count rate plots | Images |
|---|---|---|
| Comparison with Poisson distribution Blue bars denote a histogram of data divided into 1 sec bins. Red curve is a Poisson curve with rate = median count rate of data. |
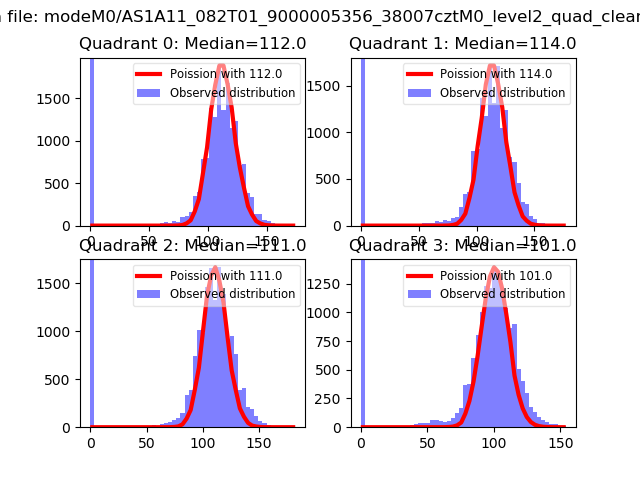 |
 |
| Quadrant-wise count rates Data is divided into 100 sec bins |
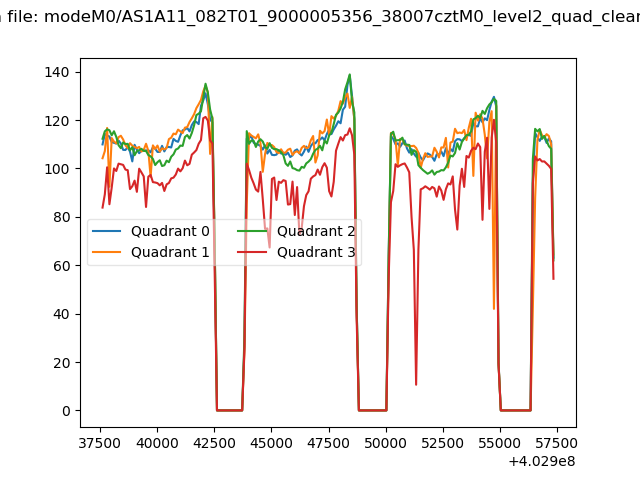 |
|
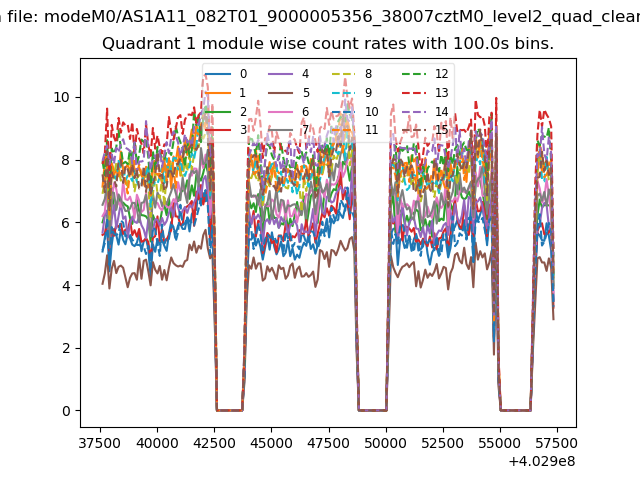
| Module-wise count rates for Quadrant A Data is divided into 100 sec bins |
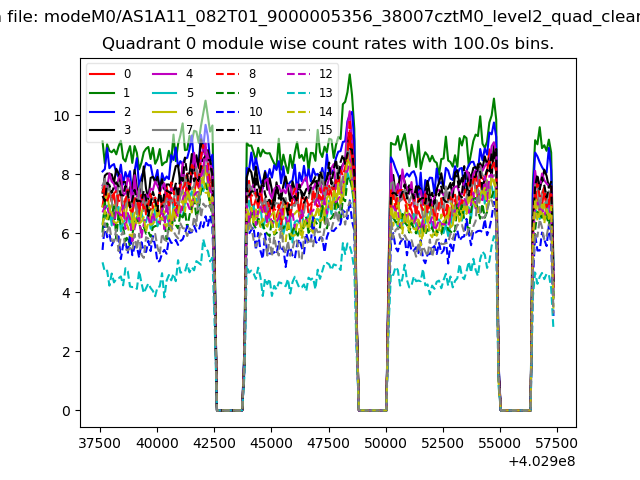 |
 |
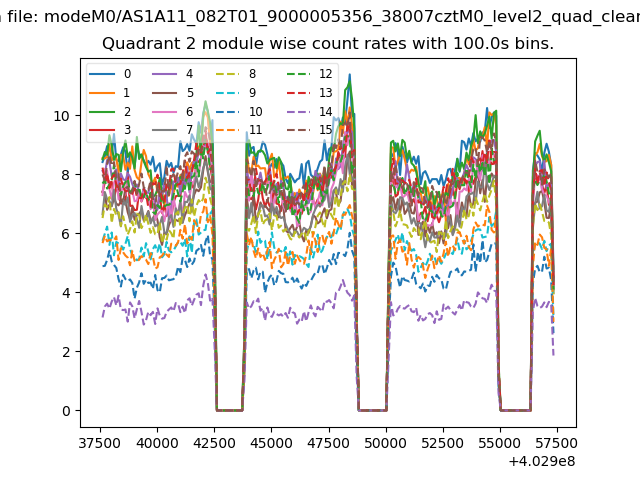
| Module-wise count rates for Quadrant B Data is divided into 100 sec bins |
 |
 |
| Module-wise count rates for Quadrant C Data is divided into 100 sec bins |
 |
 |
| Module-wise count rates for Quadrant D Data is divided into 100 sec bins |
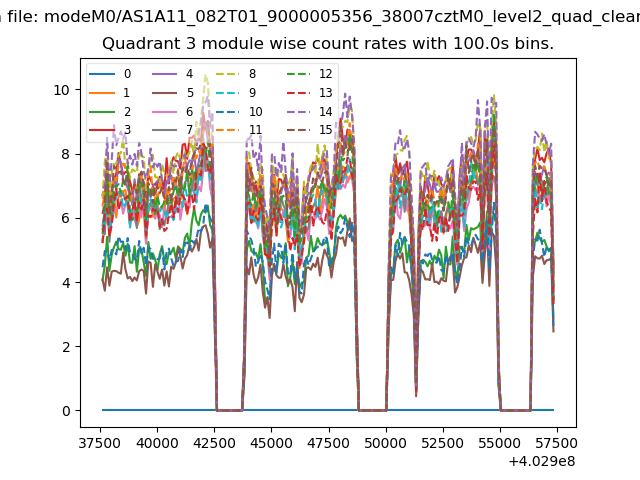 |
 |
| Parameter | Plot |
|---|---|
| CZT HV Monitor | 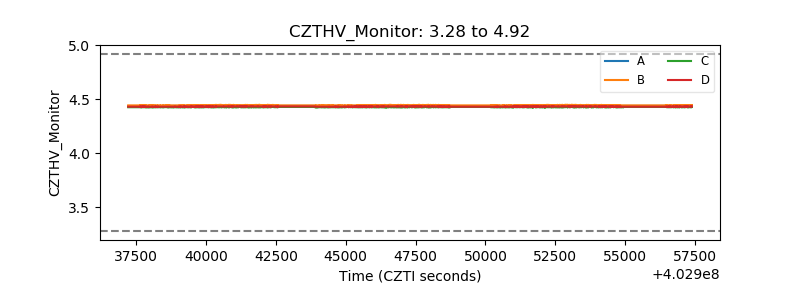 |
| D_VDD | 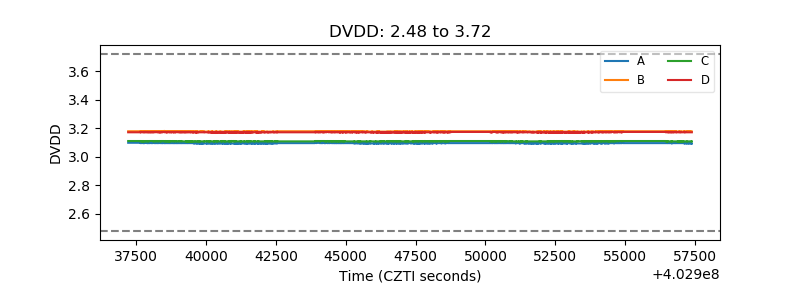 |
| Temperature 1 | 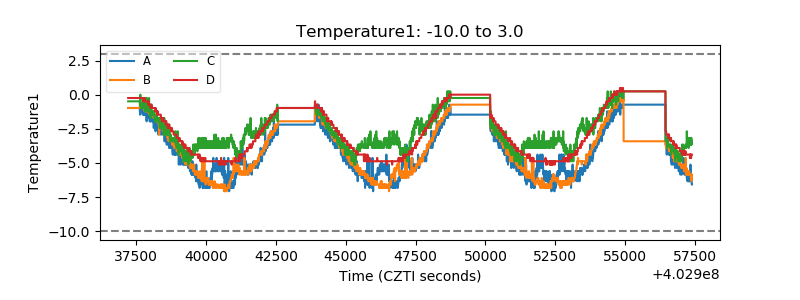 |
| Veto HV Monitor |  |
| Veto LLD | 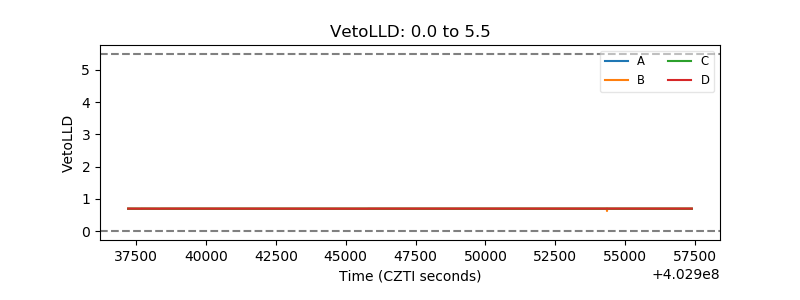 |
| Alpha Counter | 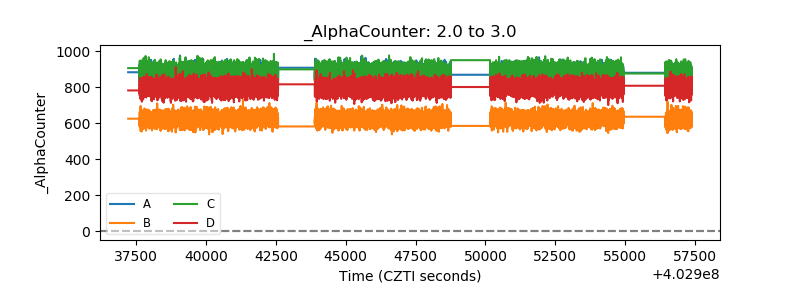 |
| _CPM_Rate | 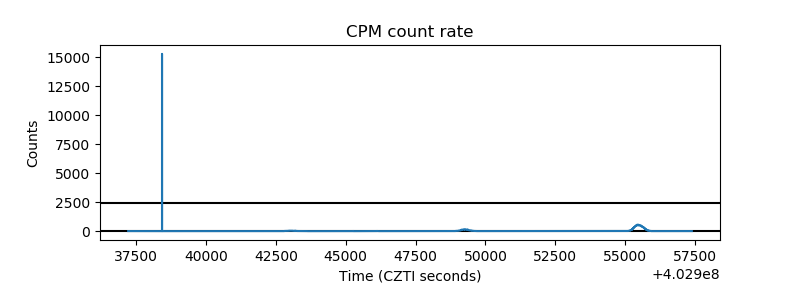 |
| CZT Counter | 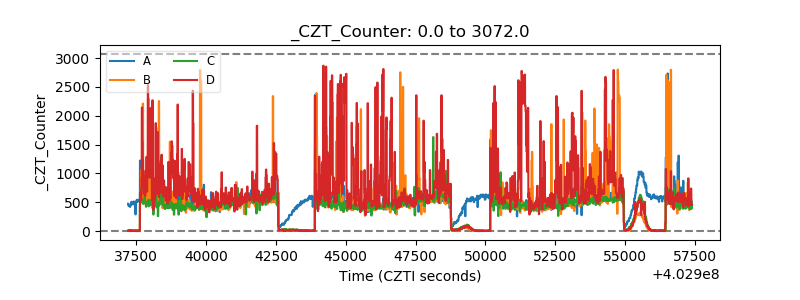 |
| +2.5 Volts monitor | 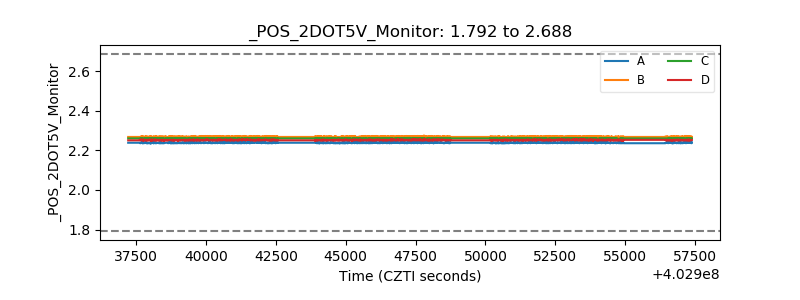 |
| +5 Volts monitor | 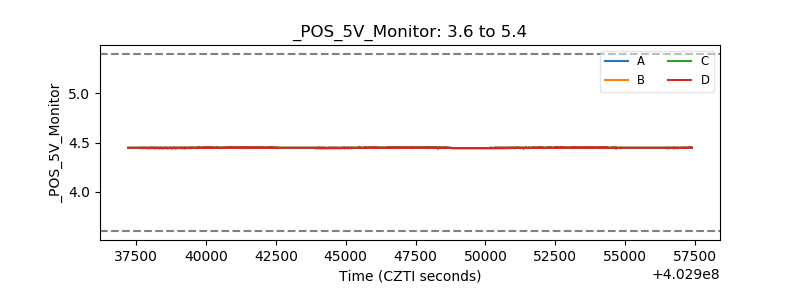 |
| _ROLL_ROT | 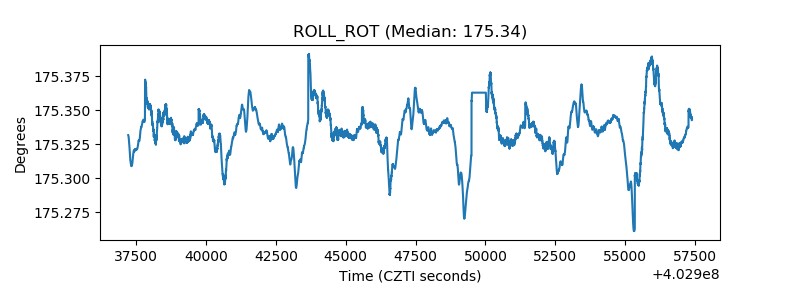 |
| _Roll_DEC | 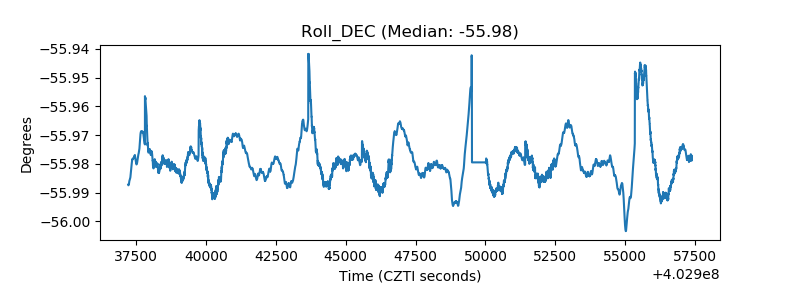 |
| _Roll_RA | 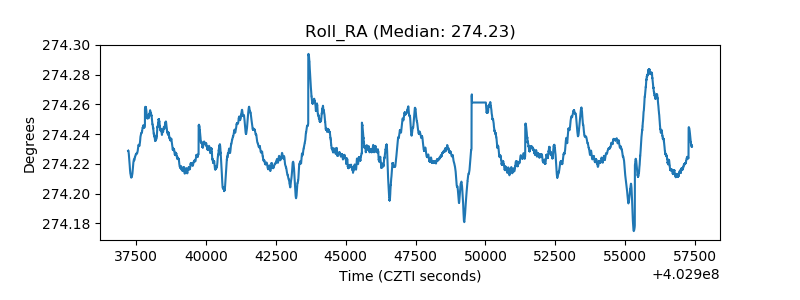 |
| Veto Counter | 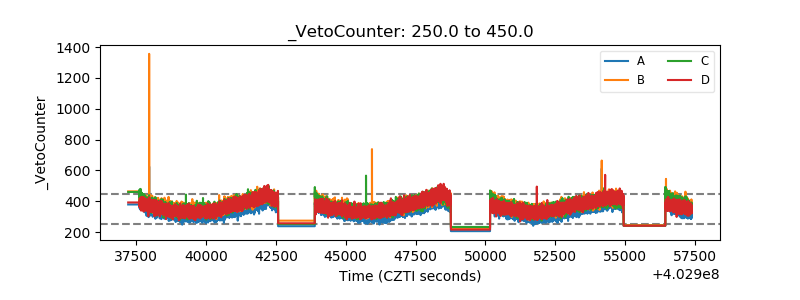 |