| Param | Original file | Final file |
|---|---|---|
| Filename | modeM0/AS1A11_082T01_9000005356_38008cztM0_level2.fits | modeM0/AS1A11_082T01_9000005356_38008cztM0_level2_quad_clean.evt |
| Size (bytes) | 390,430,080 | 92,626,560 |
| Size | 372.3 MB | 88.3 MB |
| Events in quadrant A | 3,272,745 | 629,047 |
| Events in quadrant B | 3,916,732 | 609,365 |
| Events in quadrant C | 2,773,855 | 624,579 |
| Events in quadrant D | 4,059,831 | 555,438 |
| Mode M0 | |||
|---|---|---|---|
| Quadrant | BADHDUFLAG | Total packets | Discarded packets |
| A | 0 | 13378 | 3 |
| B | 0 | 15295 | 2 |
| C | 0 | 11615 | 2 |
| D | 0 | 15853 | 2 |
| Mode SS | |||
|---|---|---|---|
| Quadrant | BADHDUFLAG | Total packets | Discarded packets |
| A | 0 | 112 | 0 |
| B | 0 | 112 | 0 |
| C | 0 | 112 | 0 |
| D | 0 | 112 | 0 |
| Mode M9 | |||
|---|---|---|---|
| Quadrant | BADHDUFLAG | Total packets | Discarded packets |
| A | 0 | 22 | 0 |
| B | 0 | 22 | 0 |
| C | 0 | 22 | 0 |
| D | 0 | 23 | 0 |
| Quadrant | Total seconds | Saturated seconds | Saturation percentage |
|---|---|---|---|
| A | 5520 | 37 | 0.670290% |
| B | 5520 | 420 | 7.608696% |
| C | 5520 | 14 | 0.253623% |
| D | 5520 | 230 | 4.166667% |
Noise dominated data is calculated using 1-second bins in cleaned event files. If a bin has >2000 counts, and if more than 50% of those come from <1% of pixels, then it is considered to be noise-dominated and hence unusable.
| Quadrant | # 1 sec bins | Bins with >0 counts | Bins with >2000 counts | High rate bins dominated by noise | Noise dominated (total time) | Noise dominated (detector-on time) | Marked lightcurve |
|---|---|---|---|---|---|---|---|
| A | 7162 | 5521 | 17 | 17 | 0.24% | 0.31% | 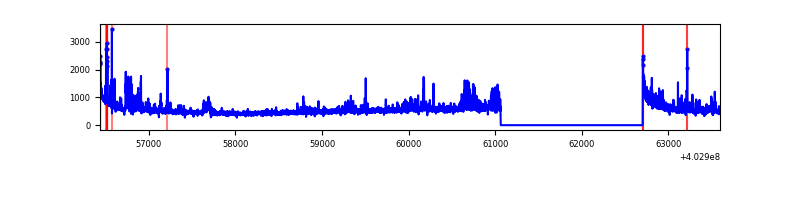 |
| B | 7162 | 5521 | 325 | 325 | 4.54% | 5.89% | 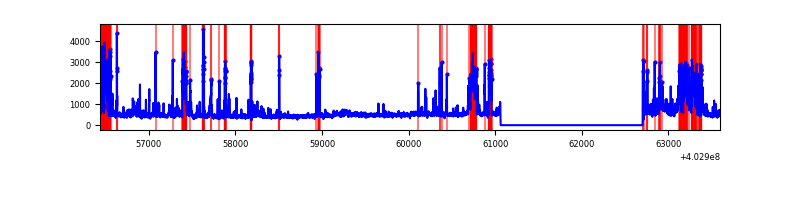 |
| C | 7162 | 5521 | 7 | 7 | 0.10% | 0.13% | 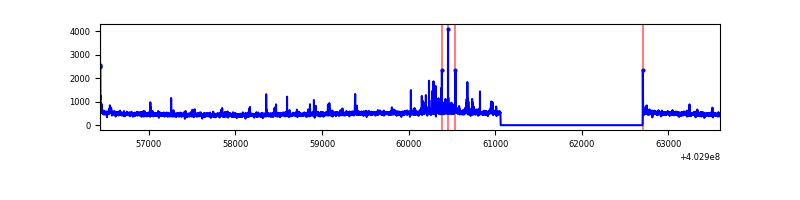 |
| D | 7162 | 5521 | 202 | 202 | 2.82% | 3.66% | 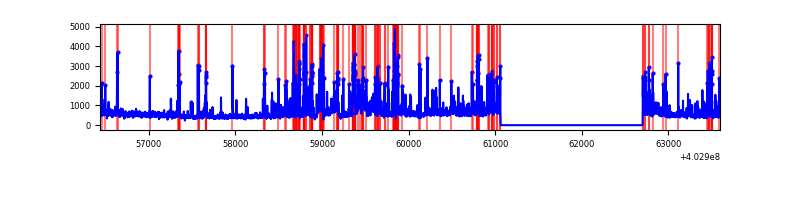 |
Top three noisy pixels from each quadrant. If the there are fewer than three noisy pixels in the level2.evt file, extra rows are filled as -1
| Pixel properties | Quadrant properties | ||||||
|---|---|---|---|---|---|---|---|
| Quadrant | DetID | PixID | Counts | Sigma | Mean | Median | Sigma |
| A | 10 | 83 | 380219 | 3007.54 | 622 | 610 | 126.2 |
| A | 12 | 16 | 312215 | 2468.76 | 622 | 610 | 126.2 |
| A | 9 | 143 | 68252 | 535.91 | 622 | 610 | 126.2 |
| B | 5 | 184 | 855052 | 7405.28 | 607 | 590 | 115.4 |
| B | 5 | 200 | 271727 | 2349.84 | 607 | 590 | 115.4 |
| B | 5 | 255 | 224633 | 1941.69 | 607 | 590 | 115.4 |
| C | 15 | 214 | 230941 | 1611.83 | 612 | 615 | 142.9 |
| C | 1 | 23 | 66310 | 459.74 | 612 | 615 | 142.9 |
| C | 14 | 254 | 36599 | 251.82 | 612 | 615 | 142.9 |
| D | 12 | 227 | 571164 | 3879.43 | 598 | 581 | 147.1 |
| D | 7 | 223 | 276967 | 1879.16 | 598 | 581 | 147.1 |
| D | 13 | 171 | 244752 | 1660.13 | 598 | 581 | 147.1 |
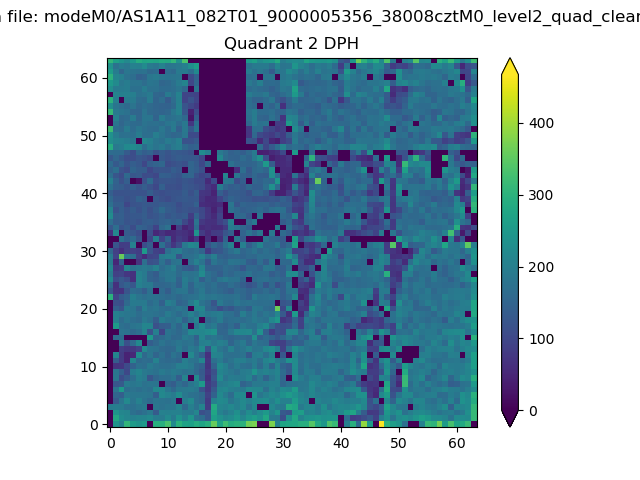
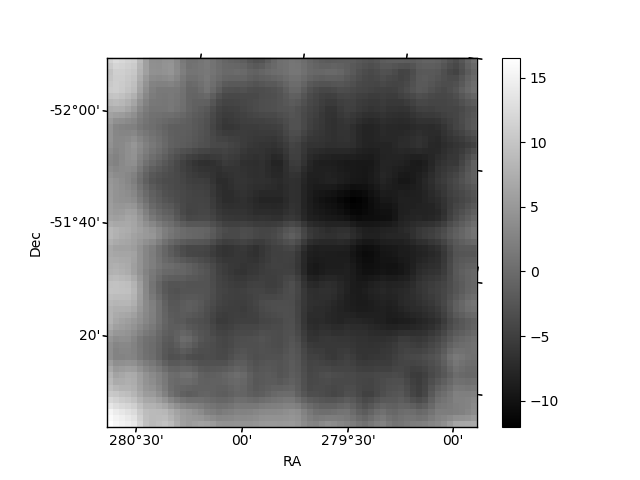
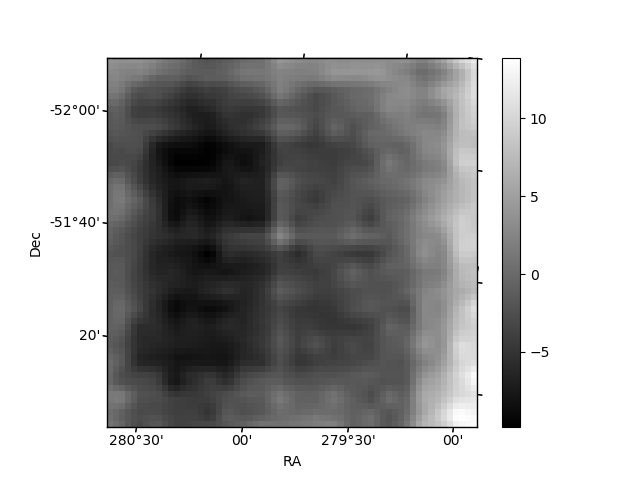
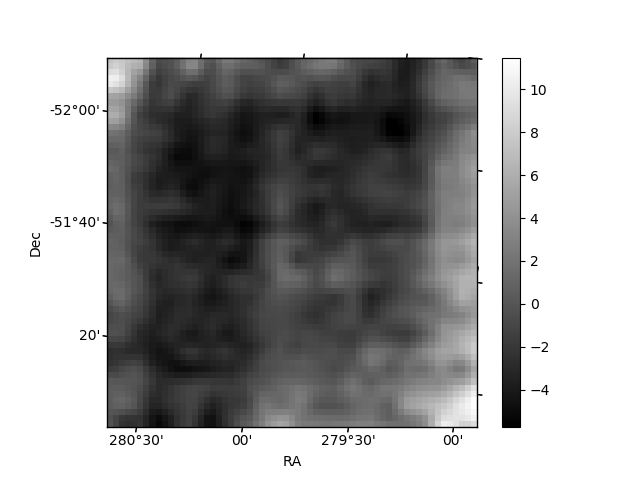
Histogram calculated using DETX and DETY for each event in the final _common_clean file
| Quadrant A | 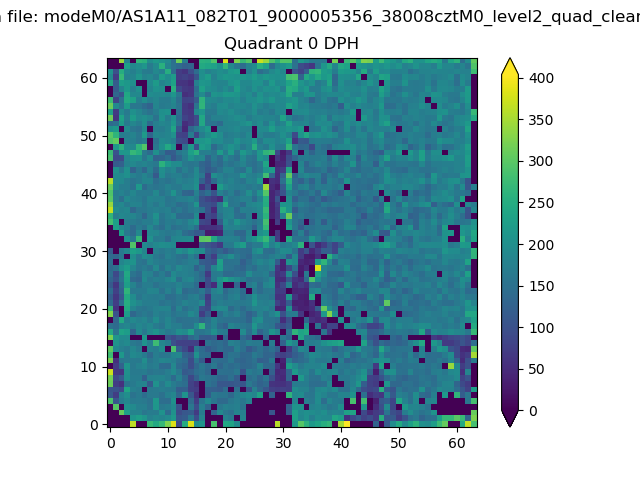 |
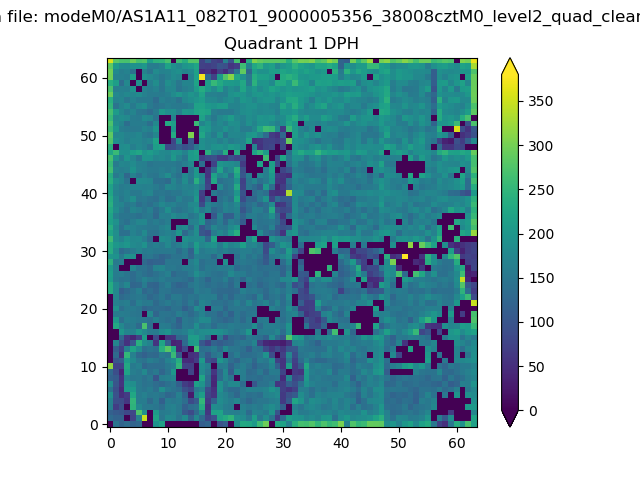 |
Quadrant B |
|---|---|---|---|
| Quadrant D | 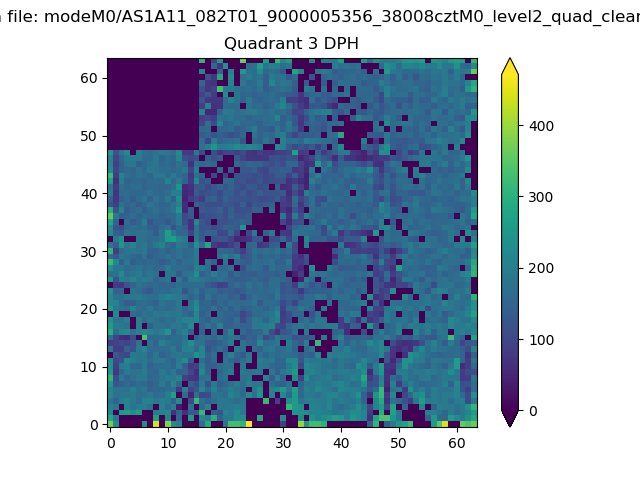 |
 |
Quadrant C |
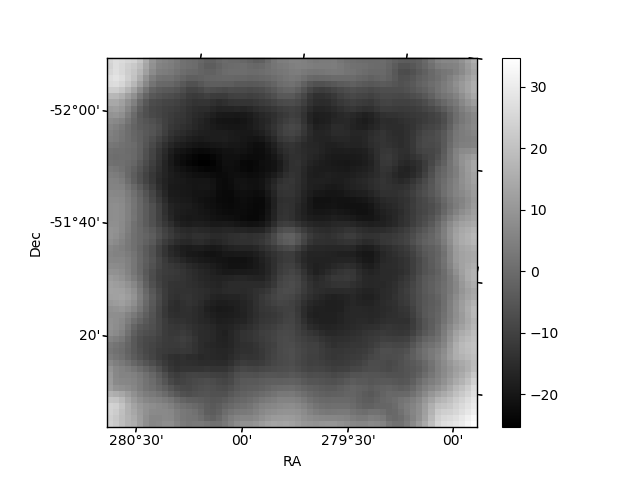
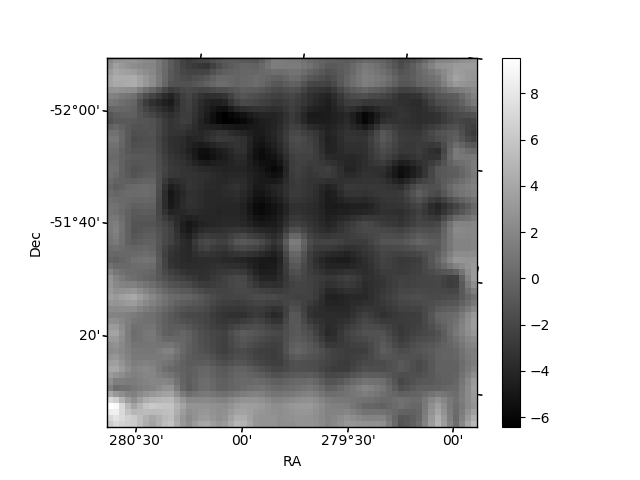
| Plot type | Count rate plots | Images |
|---|---|---|
| Comparison with Poisson distribution Blue bars denote a histogram of data divided into 1 sec bins. Red curve is a Poisson curve with rate = median count rate of data. |
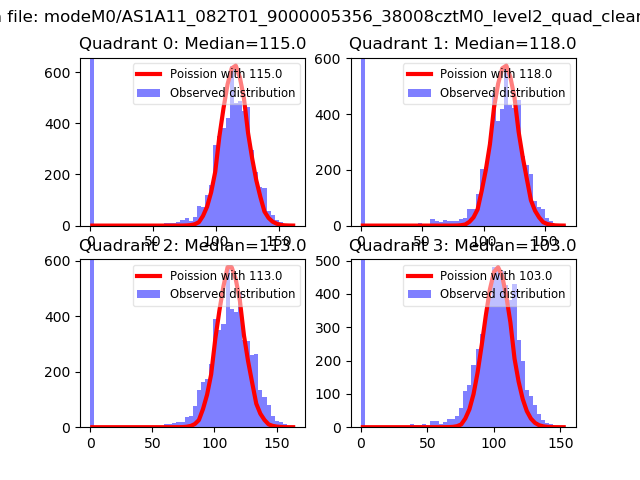 |
 |
| Quadrant-wise count rates Data is divided into 100 sec bins |
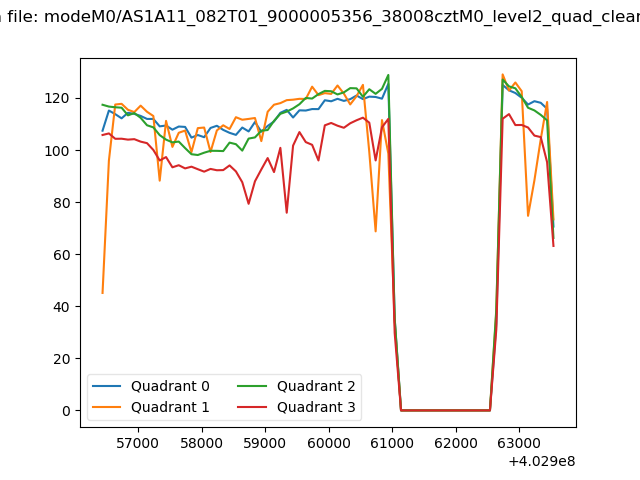 |
|
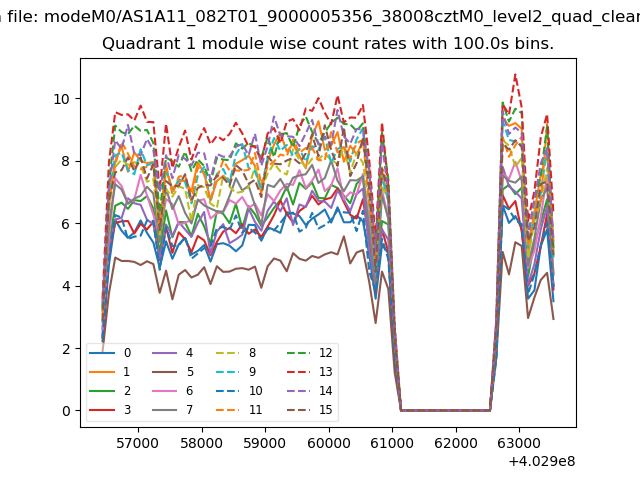
| Module-wise count rates for Quadrant A Data is divided into 100 sec bins |
 |
 |
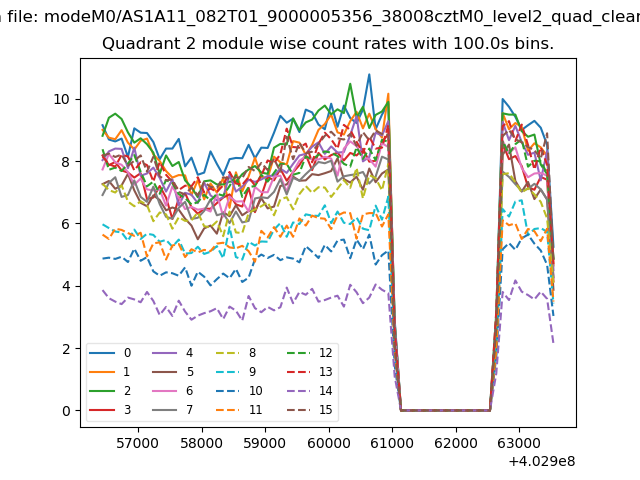
| Module-wise count rates for Quadrant B Data is divided into 100 sec bins |
 |
 |
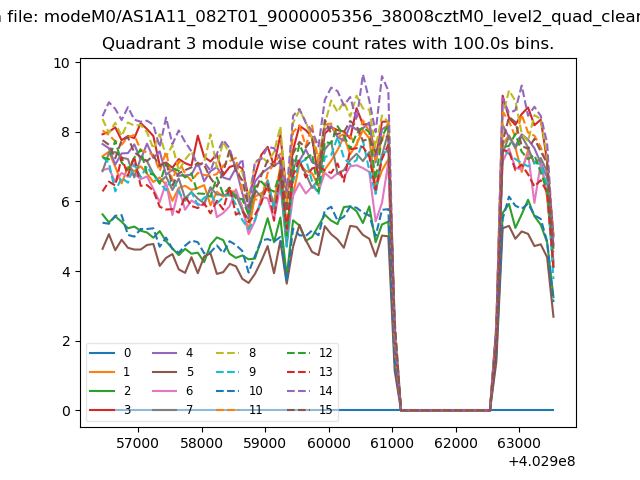
| Module-wise count rates for Quadrant C Data is divided into 100 sec bins |
 |
 |
| Module-wise count rates for Quadrant D Data is divided into 100 sec bins |
 |
 |
| Parameter | Plot |
|---|---|
| CZT HV Monitor | 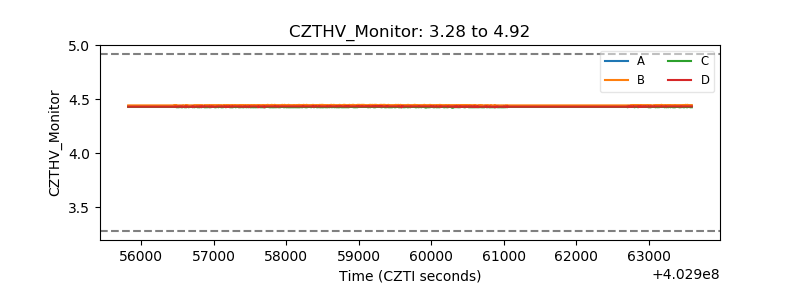 |
| D_VDD | 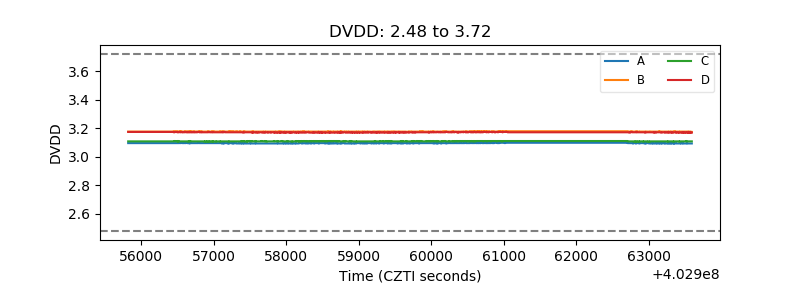 |
| Temperature 1 | 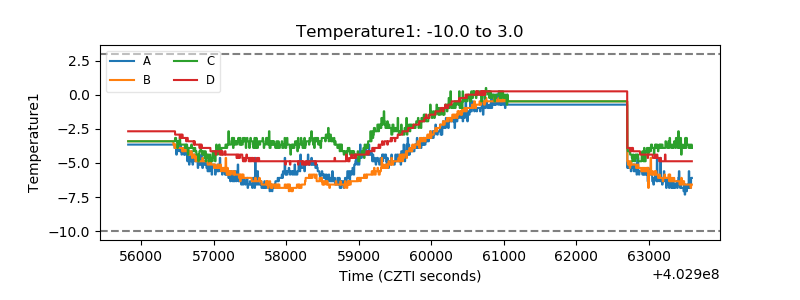 |
| Veto HV Monitor | 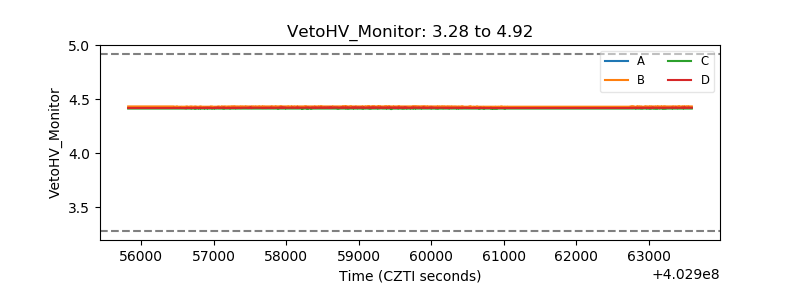 |
| Veto LLD | 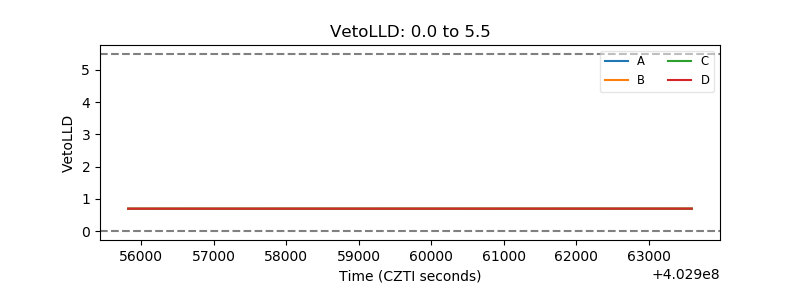 |
| Alpha Counter | 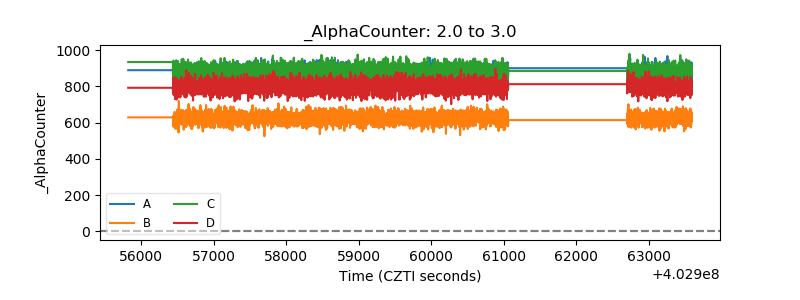 |
| _CPM_Rate | 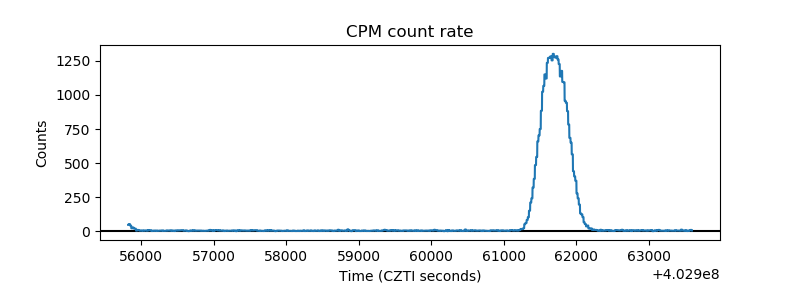 |
| CZT Counter | 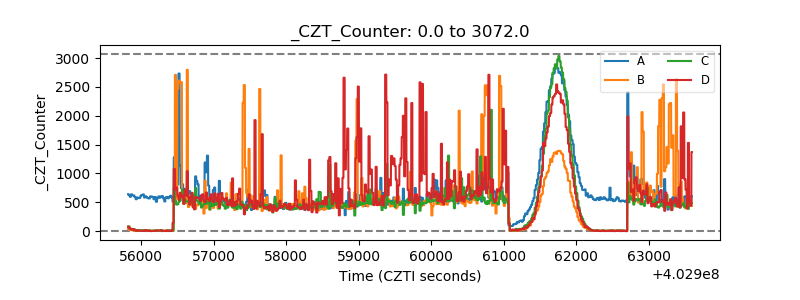 |
| +2.5 Volts monitor | 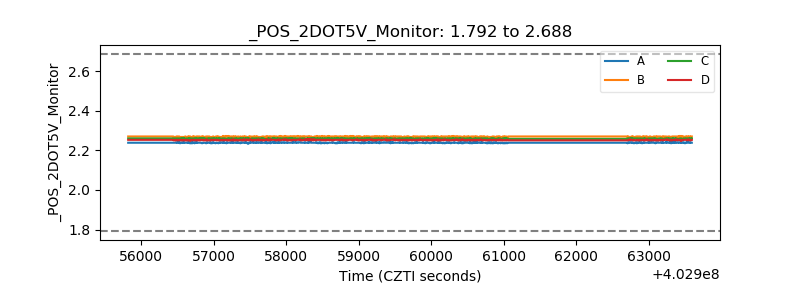 |
| +5 Volts monitor | 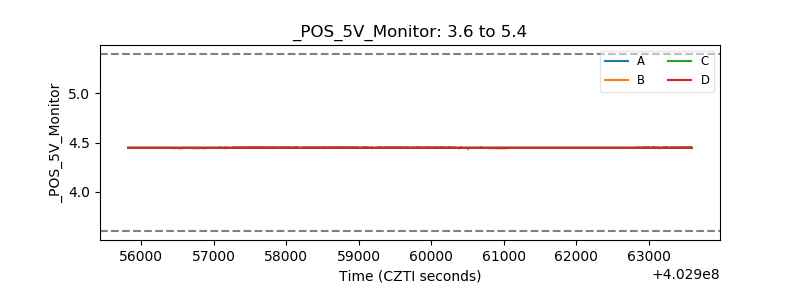 |
| _ROLL_ROT | 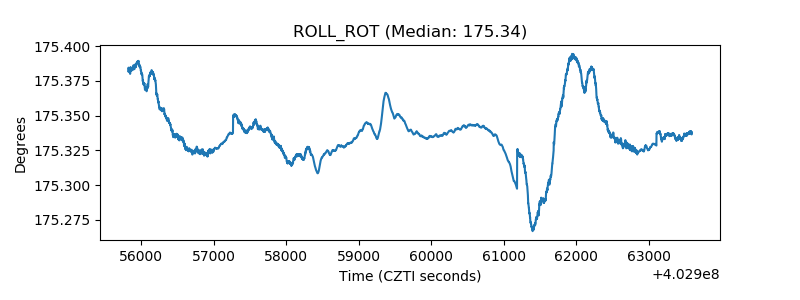 |
| _Roll_DEC | 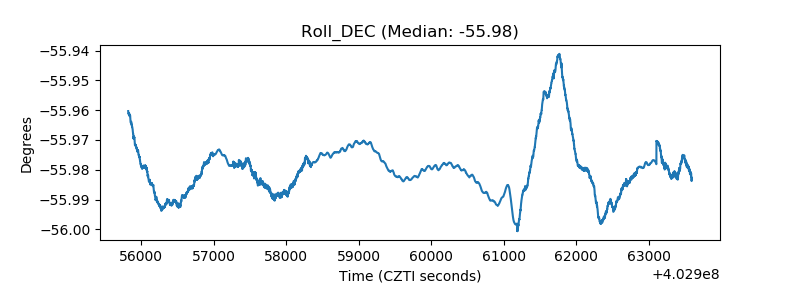 |
| _Roll_RA | 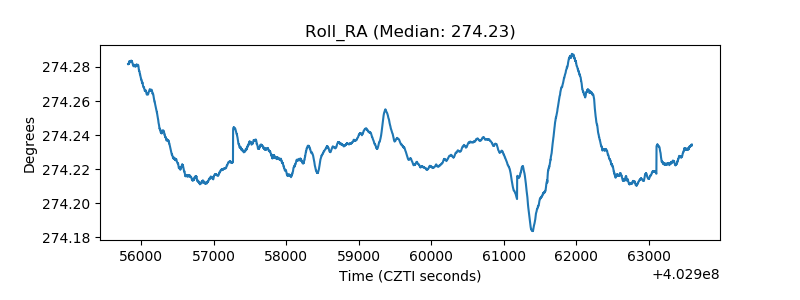 |
| Veto Counter | 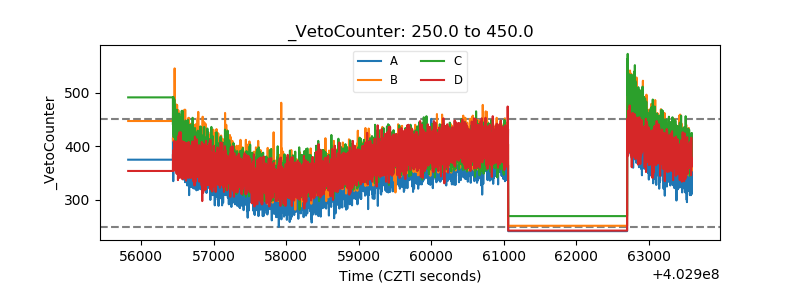 |