| Param | Original file | Final file |
|---|---|---|
| Filename | modeM0/AS1A11_082T01_9000005356_38010cztM0_level2.fits | modeM0/AS1A11_082T01_9000005356_38010cztM0_level2_quad_clean.evt |
| Size (bytes) | 428,063,040 | 98,089,920 |
| Size | 408.2 MB | 93.5 MB |
| Events in quadrant A | 3,265,348 | 675,064 |
| Events in quadrant B | 4,204,626 | 671,611 |
| Events in quadrant C | 2,839,992 | 667,649 |
| Events in quadrant D | 5,094,395 | 558,692 |
| Mode M0 | |||
|---|---|---|---|
| Quadrant | BADHDUFLAG | Total packets | Discarded packets |
| A | 0 | 13168 | 3 |
| B | 0 | 16150 | 2 |
| C | 0 | 11706 | 2 |
| D | 0 | 18894 | 2 |
| Mode SS | |||
|---|---|---|---|
| Quadrant | BADHDUFLAG | Total packets | Discarded packets |
| A | 0 | 118 | 0 |
| B | 0 | 118 | 0 |
| C | 0 | 118 | 0 |
| D | 0 | 118 | 0 |
| Mode M9 | |||
|---|---|---|---|
| Quadrant | BADHDUFLAG | Total packets | Discarded packets |
| A | 0 | 34 | 0 |
| B | 0 | 34 | 0 |
| C | 0 | 34 | 0 |
| D | 0 | 34 | 0 |
| Quadrant | Total seconds | Saturated seconds | Saturation percentage |
|---|---|---|---|
| A | 5676 | 25 | 0.440451% |
| B | 5676 | 369 | 6.501057% |
| C | 5676 | 8 | 0.140944% |
| D | 5676 | 609 | 10.729387% |
Noise dominated data is calculated using 1-second bins in cleaned event files. If a bin has >2000 counts, and if more than 50% of those come from <1% of pixels, then it is considered to be noise-dominated and hence unusable.
| Quadrant | # 1 sec bins | Bins with >0 counts | Bins with >2000 counts | High rate bins dominated by noise | Noise dominated (total time) | Noise dominated (detector-on time) | Marked lightcurve |
|---|---|---|---|---|---|---|---|
| A | 9081 | 5678 | 8 | 8 | 0.09% | 0.14% | 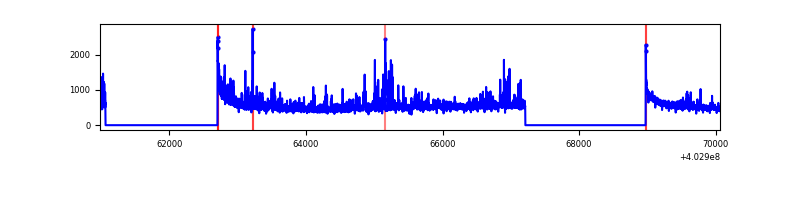 |
| B | 9081 | 5678 | 254 | 254 | 2.80% | 4.47% | 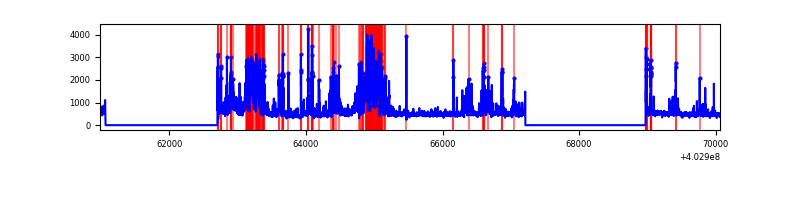 |
| C | 9081 | 5678 | 6 | 6 | 0.07% | 0.11% | 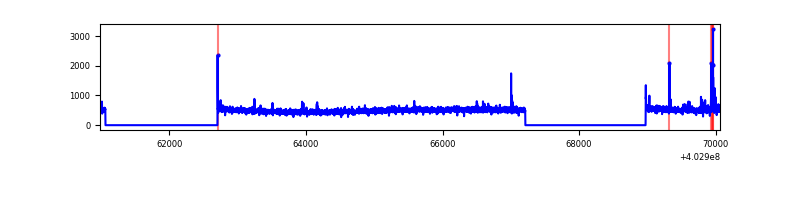 |
| D | 9081 | 5678 | 496 | 496 | 5.46% | 8.74% | 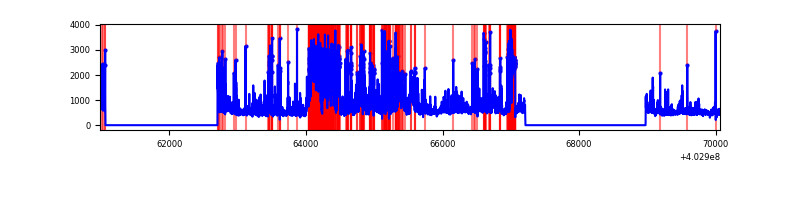 |
Top three noisy pixels from each quadrant. If the there are fewer than three noisy pixels in the level2.evt file, extra rows are filled as -1
| Pixel properties | Quadrant properties | ||||||
|---|---|---|---|---|---|---|---|
| Quadrant | DetID | PixID | Counts | Sigma | Mean | Median | Sigma |
| A | 10 | 83 | 382301 | 2868.99 | 653 | 641 | 133.0 |
| A | 12 | 16 | 283820 | 2128.7 | 653 | 641 | 133.0 |
| A | 12 | 194 | 43264 | 320.4 | 653 | 641 | 133.0 |
| B | 5 | 184 | 1244324 | 10180.97 | 645 | 628 | 122.2 |
| B | 5 | 255 | 201943 | 1647.98 | 645 | 628 | 122.2 |
| B | 5 | 172 | 94510 | 768.52 | 645 | 628 | 122.2 |
| C | 15 | 214 | 238348 | 1591.28 | 645 | 648 | 149.4 |
| C | 2 | 16 | 39322 | 258.9 | 645 | 648 | 149.4 |
| C | 14 | 254 | 22505 | 146.32 | 645 | 648 | 149.4 |
| D | 13 | 171 | 1486529 | 9945.1 | 614 | 597 | 149.4 |
| D | 1 | 52 | 261320 | 1744.98 | 614 | 597 | 149.4 |
| D | 5 | 222 | 236625 | 1579.7 | 614 | 597 | 149.4 |
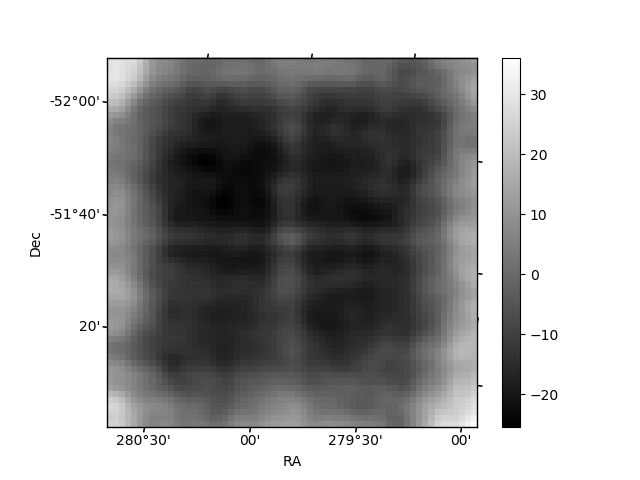
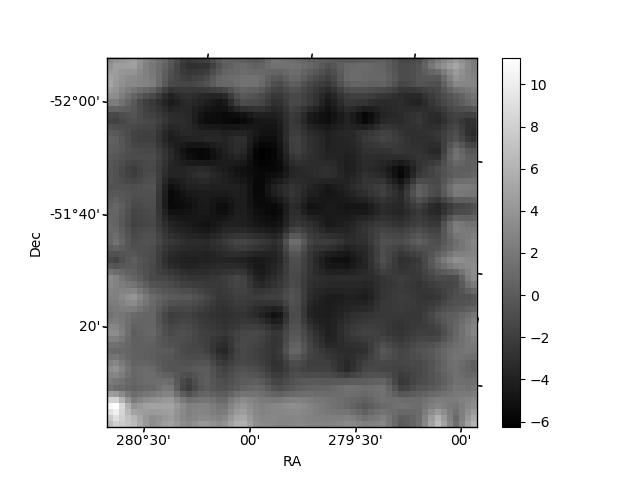
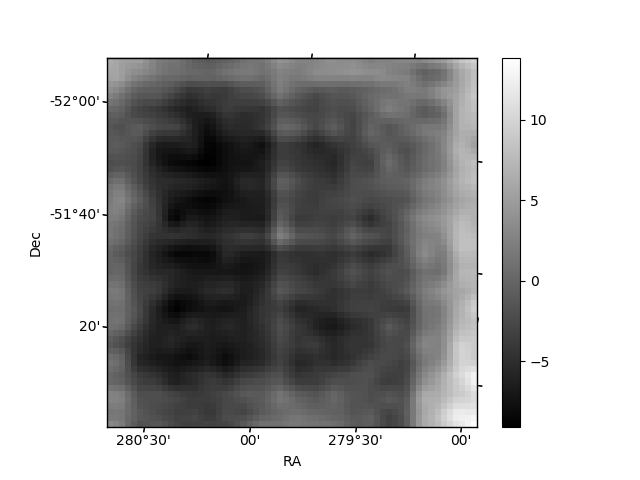
Histogram calculated using DETX and DETY for each event in the final _common_clean file
| Quadrant A | 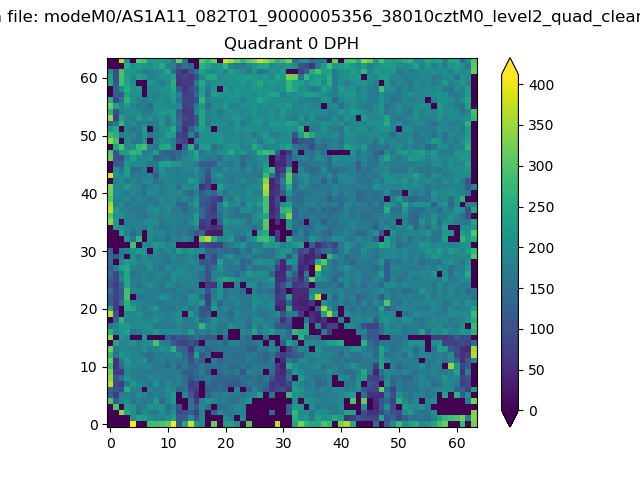 |
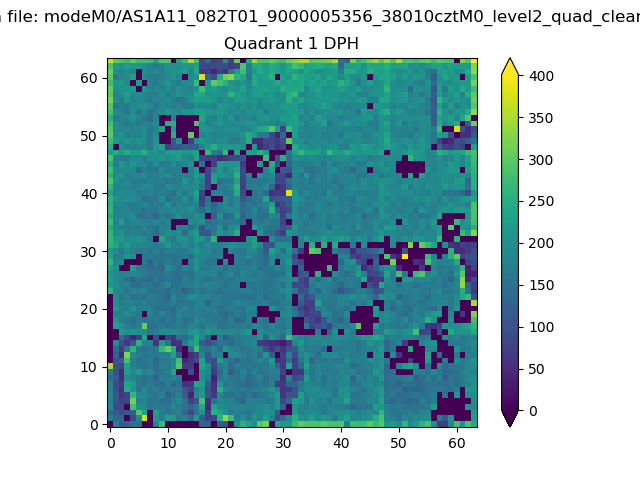 |
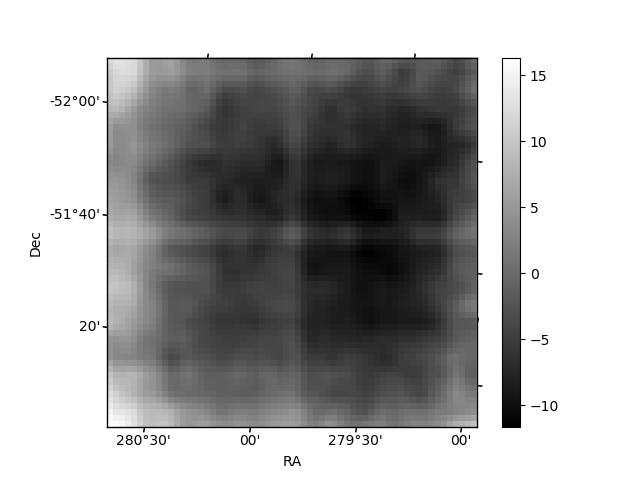
Quadrant B |
|---|---|---|---|
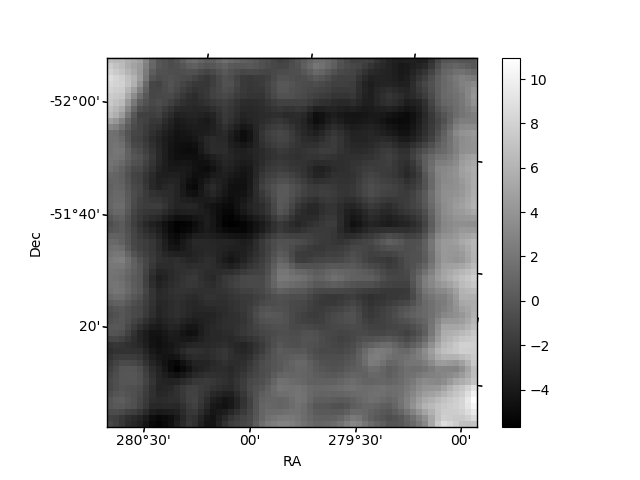
| Quadrant D | 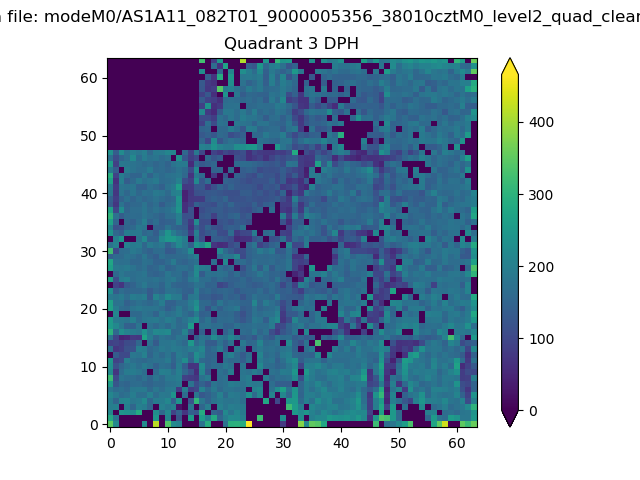 |
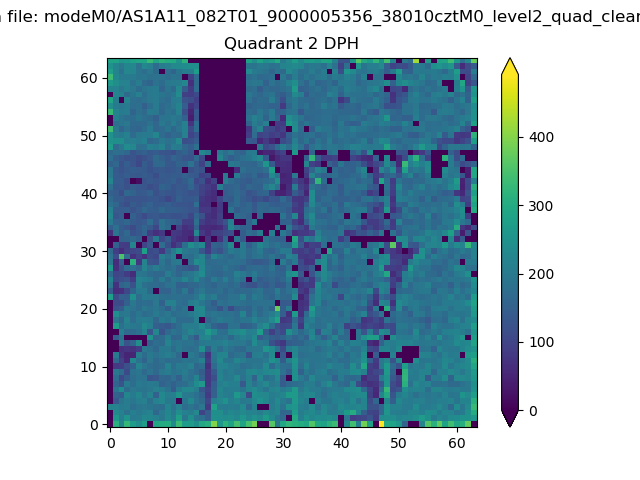 |
Quadrant C |
| Plot type | Count rate plots | Images |
|---|---|---|
| Comparison with Poisson distribution Blue bars denote a histogram of data divided into 1 sec bins. Red curve is a Poisson curve with rate = median count rate of data. |
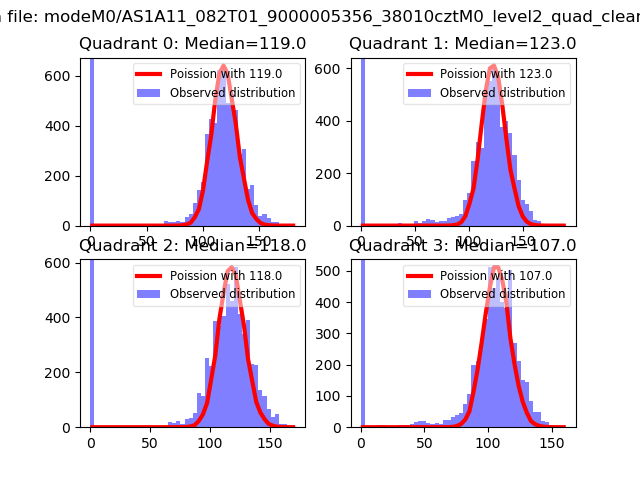 |
 |
| Quadrant-wise count rates Data is divided into 100 sec bins |
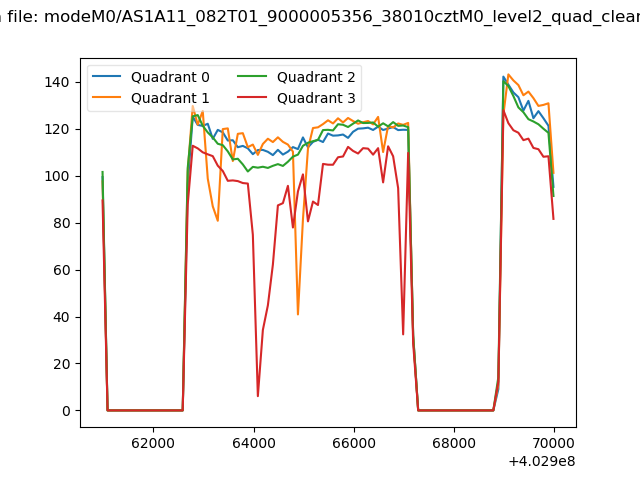 |
|
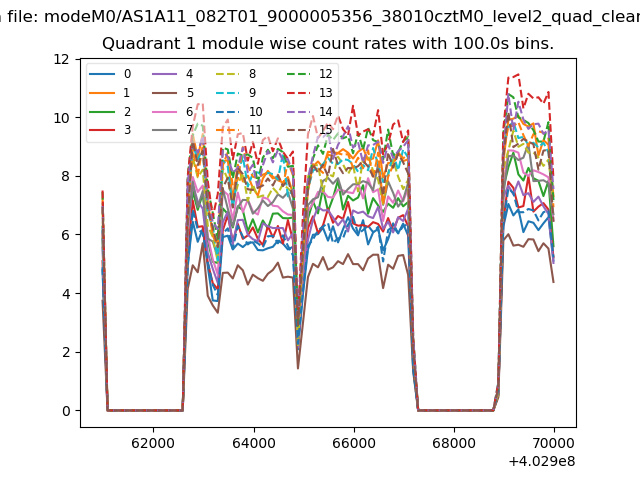
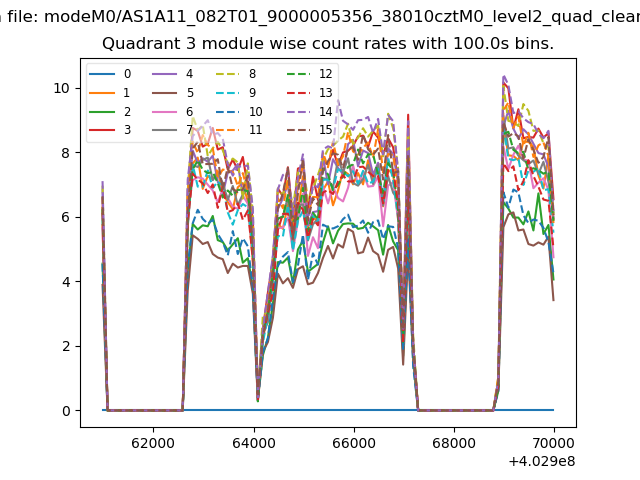
| Module-wise count rates for Quadrant A Data is divided into 100 sec bins |
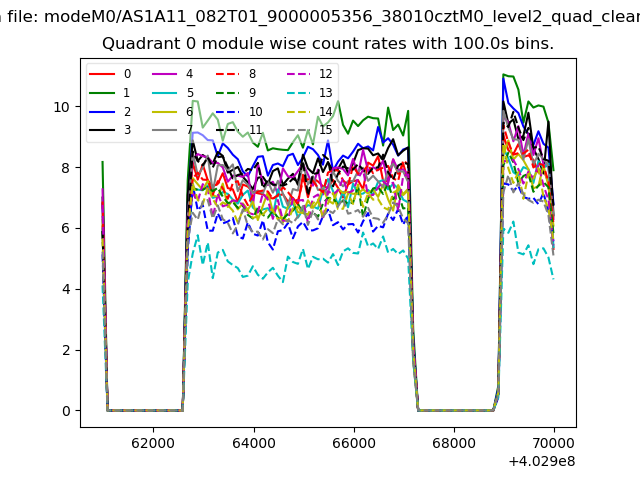 |
 |
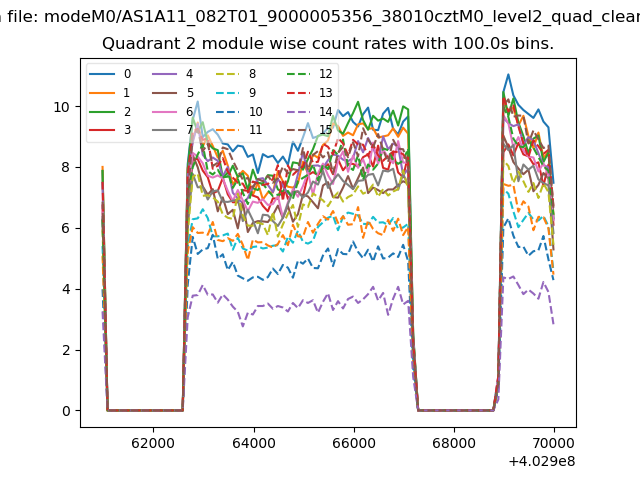
| Module-wise count rates for Quadrant B Data is divided into 100 sec bins |
 |
 |
| Module-wise count rates for Quadrant C Data is divided into 100 sec bins |
 |
 |
| Module-wise count rates for Quadrant D Data is divided into 100 sec bins |
 |
 |
| Parameter | Plot |
|---|---|
| CZT HV Monitor | 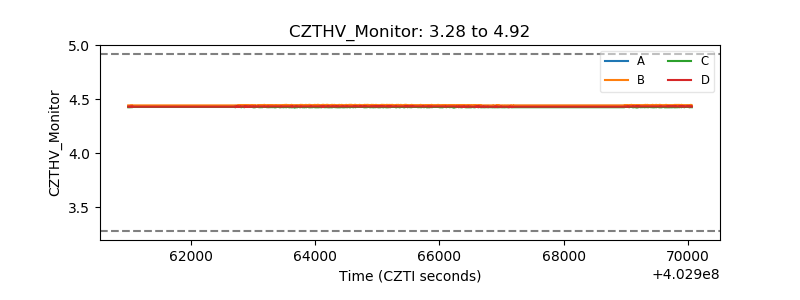 |
| D_VDD | 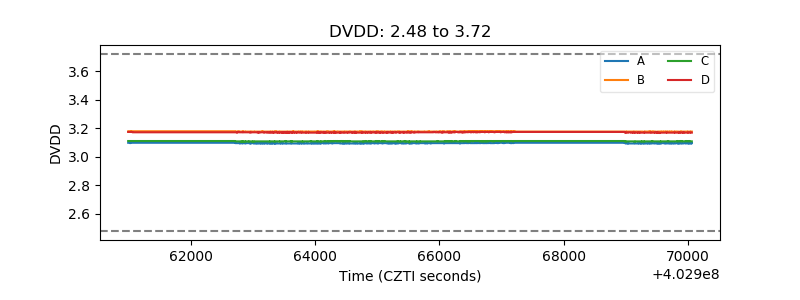 |
| Temperature 1 | 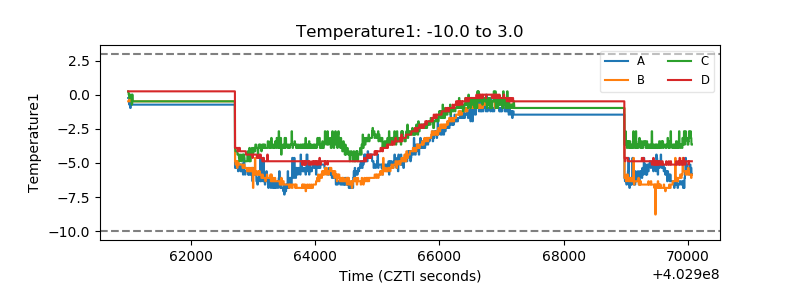 |
| Veto HV Monitor | 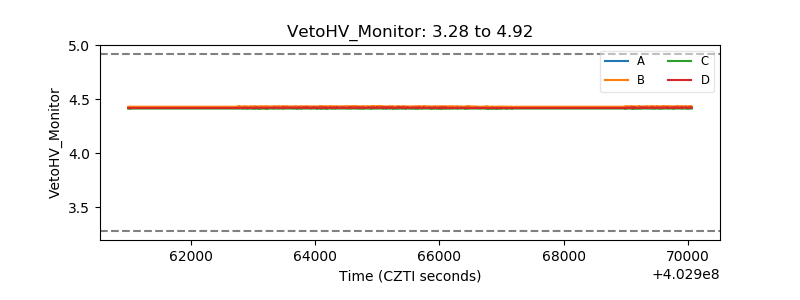 |
| Veto LLD | 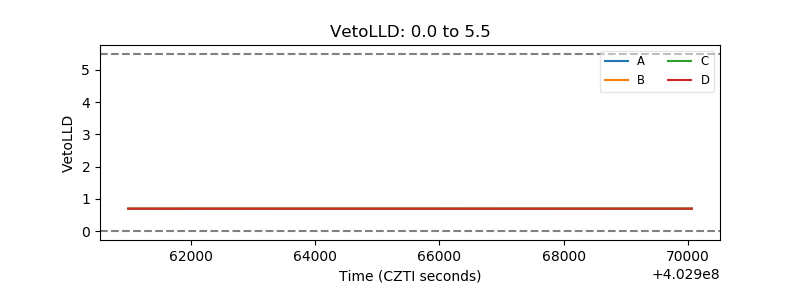 |
| Alpha Counter | 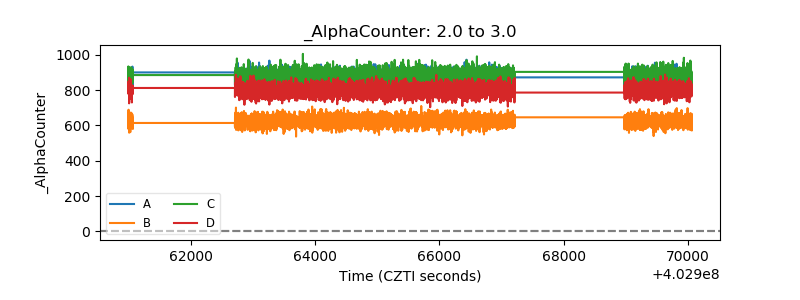 |
| _CPM_Rate | 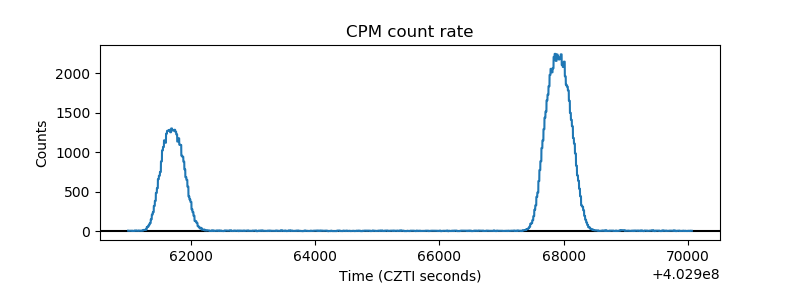 |
| CZT Counter | 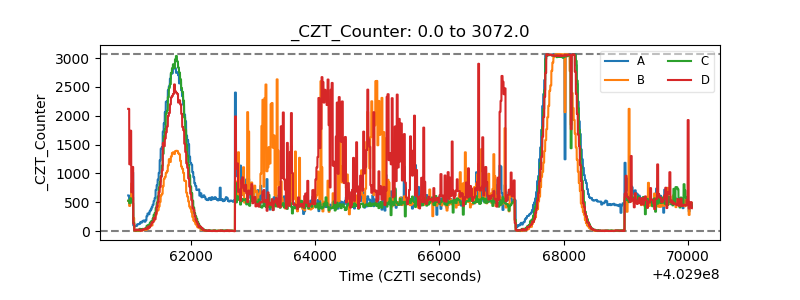 |
| +2.5 Volts monitor | 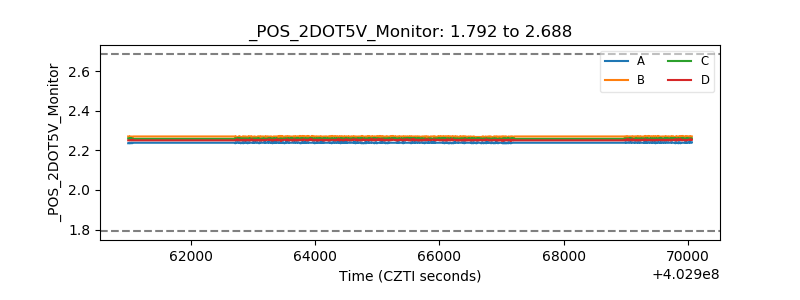 |
| +5 Volts monitor | 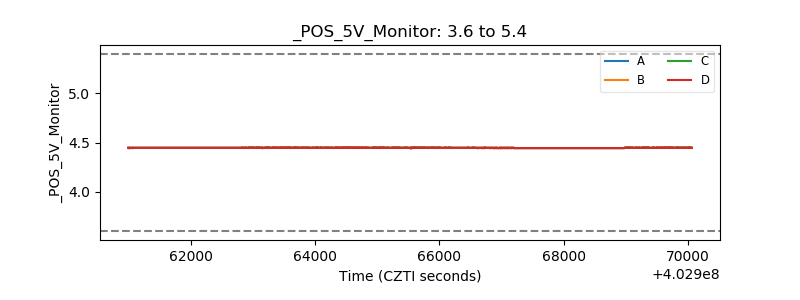 |
| _ROLL_ROT | 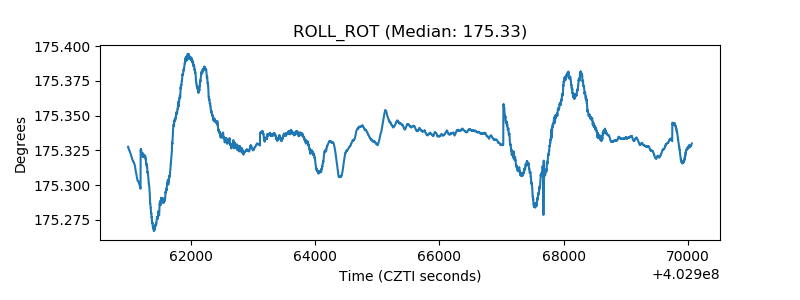 |
| _Roll_DEC | 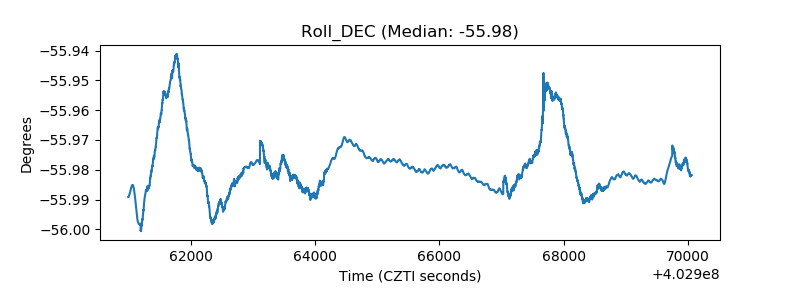 |
| _Roll_RA | 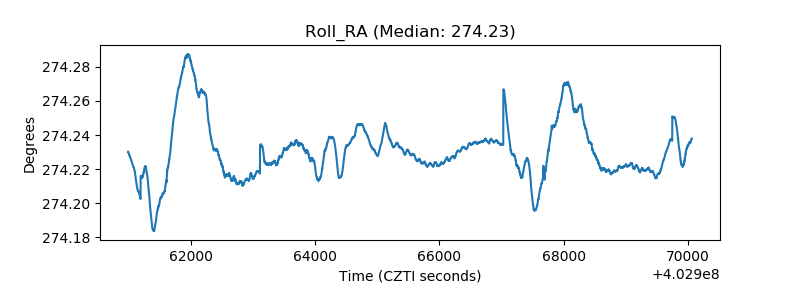 |
| Veto Counter | 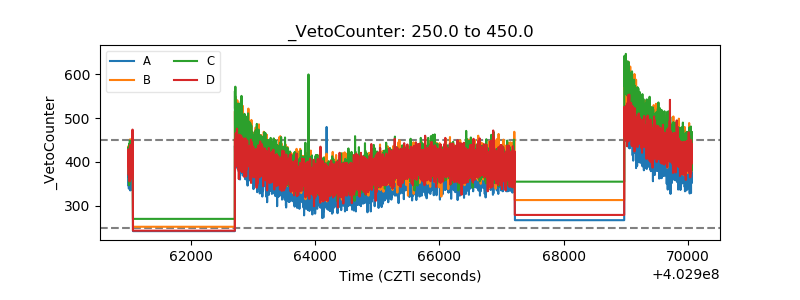 |