| Param | Original file | Final file |
|---|---|---|
| Filename | modeM0/AS1A11_082T01_9000005356_38011cztM0_level2.fits | modeM0/AS1A11_082T01_9000005356_38011cztM0_level2_quad_clean.evt |
| Size (bytes) | 367,064,640 | 98,916,480 |
| Size | 350.1 MB | 94.3 MB |
| Events in quadrant A | 2,875,031 | 676,098 |
| Events in quadrant B | 2,997,753 | 693,316 |
| Events in quadrant C | 2,879,233 | 672,053 |
| Events in quadrant D | 4,420,787 | 580,432 |
| Mode M0 | |||
|---|---|---|---|
| Quadrant | BADHDUFLAG | Total packets | Discarded packets |
| A | 0 | 11567 | 3 |
| B | 0 | 12134 | 2 |
| C | 0 | 11491 | 2 |
| D | 0 | 16596 | 2 |
| Mode SS | |||
|---|---|---|---|
| Quadrant | BADHDUFLAG | Total packets | Discarded packets |
| A | 0 | 110 | 0 |
| B | 0 | 110 | 0 |
| C | 0 | 110 | 0 |
| D | 0 | 110 | 0 |
| Mode M9 | |||
|---|---|---|---|
| Quadrant | BADHDUFLAG | Total packets | Discarded packets |
| A | 0 | 28 | 0 |
| B | 0 | 28 | 0 |
| C | 0 | 28 | 0 |
| D | 0 | 29 | 0 |
| Quadrant | Total seconds | Saturated seconds | Saturation percentage |
|---|---|---|---|
| A | 5329 | 10 | 0.187652% |
| B | 5329 | 128 | 2.401952% |
| C | 5329 | 17 | 0.319009% |
| D | 5329 | 386 | 7.243385% |
Noise dominated data is calculated using 1-second bins in cleaned event files. If a bin has >2000 counts, and if more than 50% of those come from <1% of pixels, then it is considered to be noise-dominated and hence unusable.
| Quadrant | # 1 sec bins | Bins with >0 counts | Bins with >2000 counts | High rate bins dominated by noise | Noise dominated (total time) | Noise dominated (detector-on time) | Marked lightcurve |
|---|---|---|---|---|---|---|---|
| A | 7242 | 5330 | 2 | 2 | 0.03% | 0.04% | 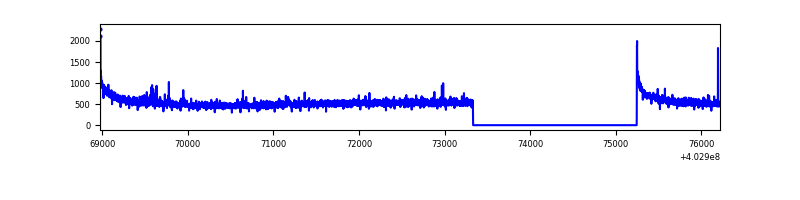 |
| B | 7242 | 5330 | 90 | 90 | 1.24% | 1.69% | 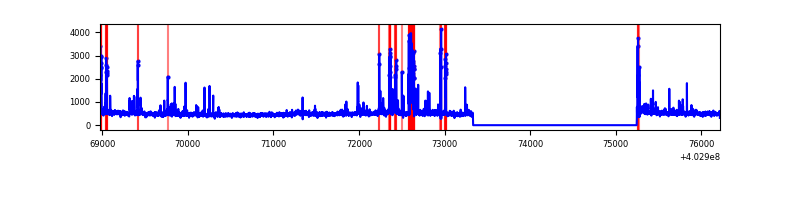 |
| C | 7242 | 5330 | 14 | 14 | 0.19% | 0.26% | 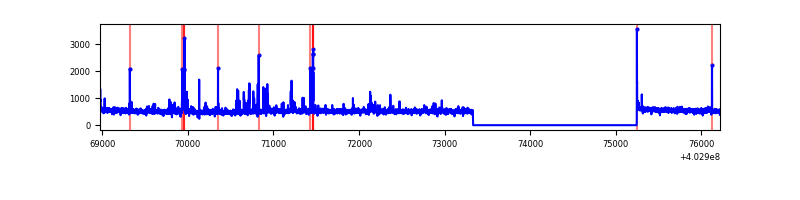 |
| D | 7242 | 5330 | 344 | 344 | 4.75% | 6.45% | 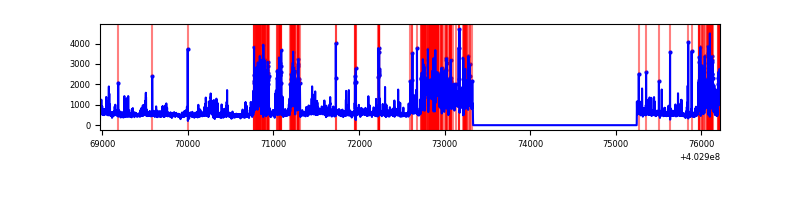 |
Top three noisy pixels from each quadrant. If the there are fewer than three noisy pixels in the level2.evt file, extra rows are filled as -1
| Pixel properties | Quadrant properties | ||||||
|---|---|---|---|---|---|---|---|
| Quadrant | DetID | PixID | Counts | Sigma | Mean | Median | Sigma |
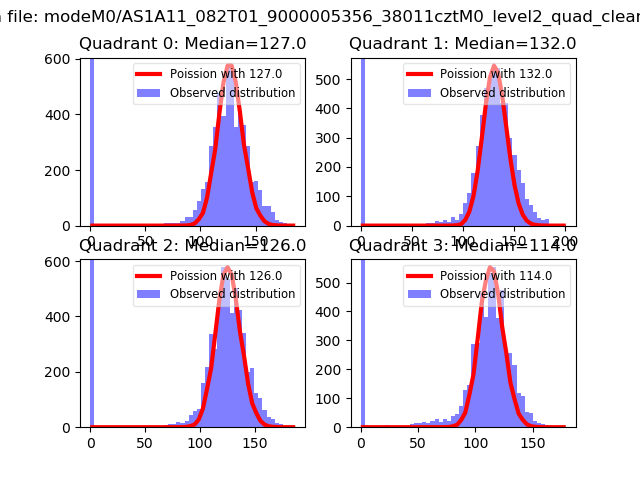
| A | 10 | 83 | 357293 | 2775.89 | 637 | 625 | 128.5 |
| A | 12 | 16 | 20036 | 151.07 | 637 | 625 | 128.5 |
| A | 12 | 189 | 17574 | 131.91 | 637 | 625 | 128.5 |
| B | 5 | 255 | 183018 | 1526.34 | 637 | 622 | 119.5 |
| B | 5 | 184 | 144240 | 1201.84 | 637 | 622 | 119.5 |
| B | 5 | 172 | 59464 | 492.41 | 637 | 622 | 119.5 |
| C | 15 | 214 | 224511 | 1543.62 | 633 | 637 | 145.0 |
| C | 2 | 16 | 114295 | 783.68 | 633 | 637 | 145.0 |
| C | 14 | 254 | 33769 | 228.45 | 633 | 637 | 145.0 |
| D | 5 | 222 | 548809 | 3696.59 | 611 | 592 | 148.3 |
| D | 2 | 120 | 445540 | 3000.25 | 611 | 592 | 148.3 |
| D | 13 | 171 | 396509 | 2669.64 | 611 | 592 | 148.3 |
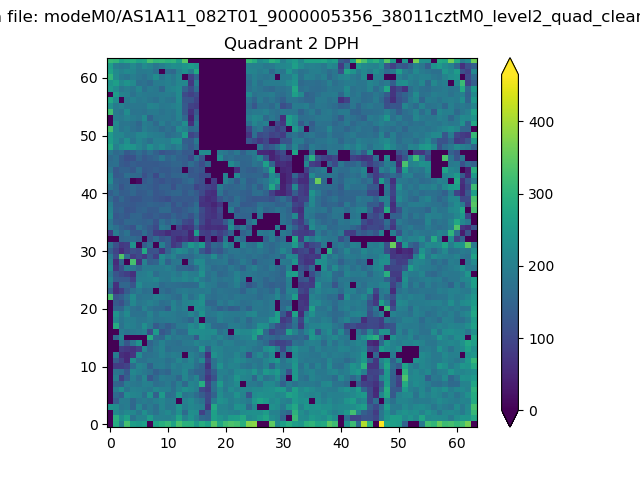
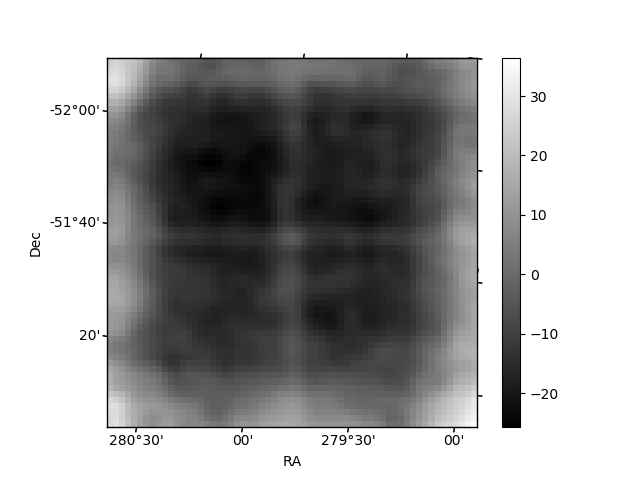
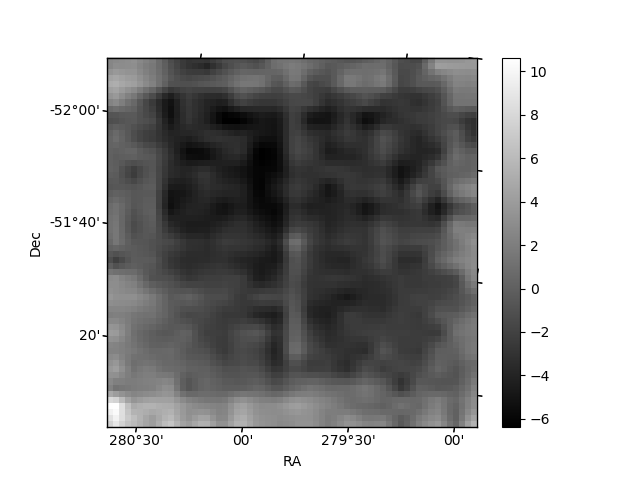
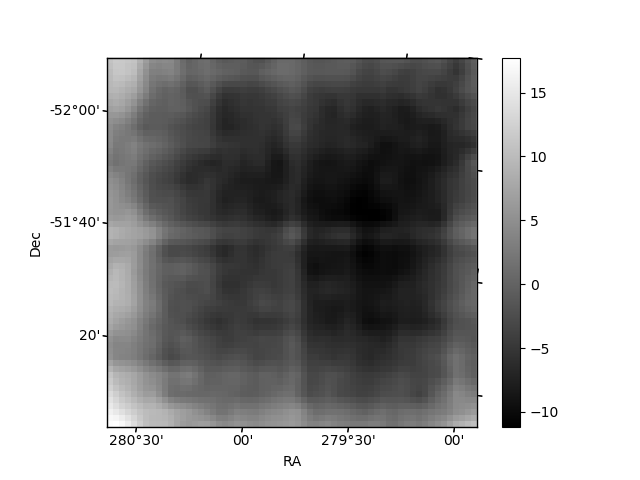
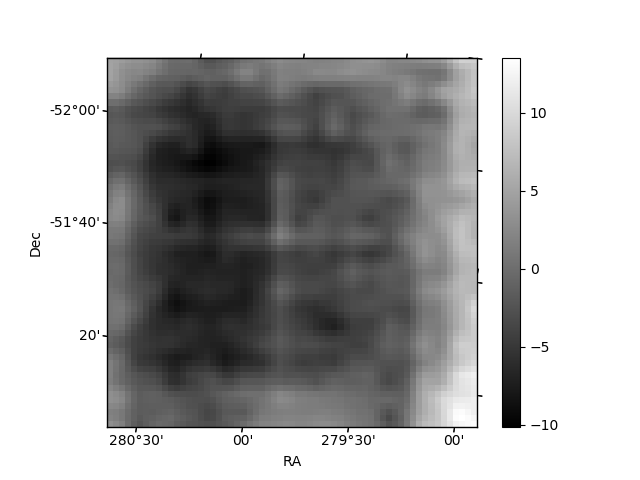
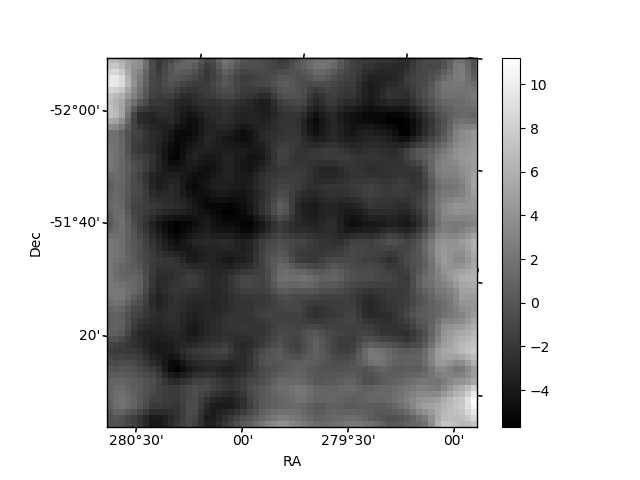
Histogram calculated using DETX and DETY for each event in the final _common_clean file
| Quadrant A | 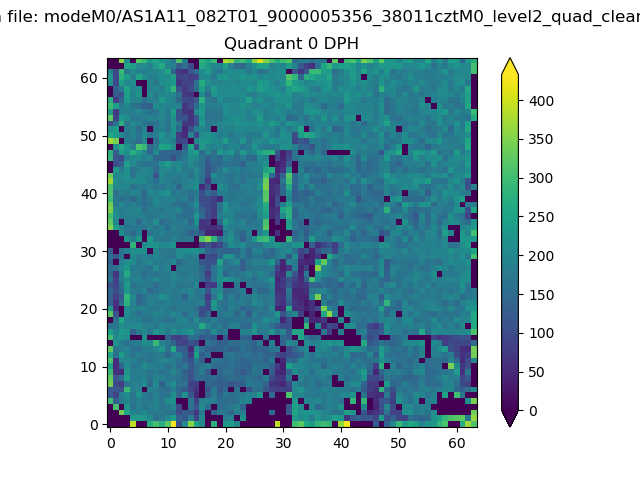 |
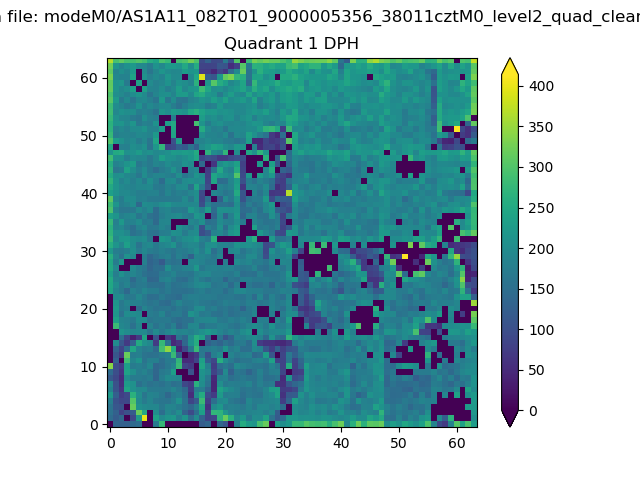 |
Quadrant B |
|---|---|---|---|
| Quadrant D | 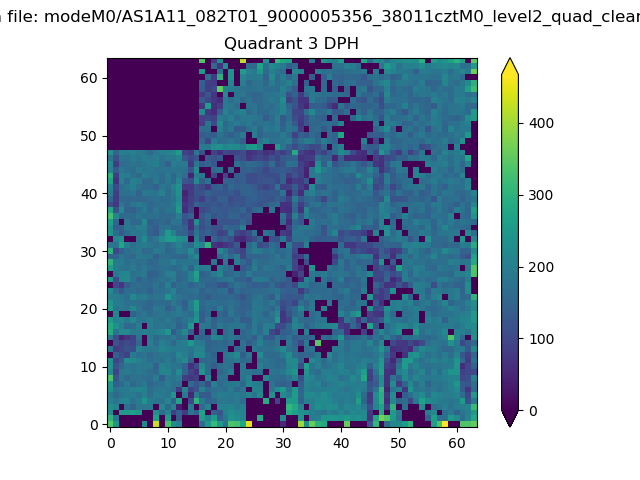 |
 |
Quadrant C |
| Plot type | Count rate plots | Images |
|---|---|---|
| Comparison with Poisson distribution Blue bars denote a histogram of data divided into 1 sec bins. Red curve is a Poisson curve with rate = median count rate of data. |
 |
 |
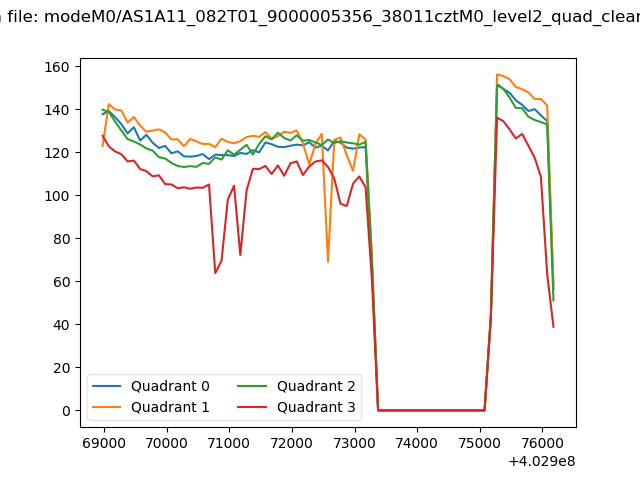
| Quadrant-wise count rates Data is divided into 100 sec bins |
 |
|
| Module-wise count rates for Quadrant A Data is divided into 100 sec bins |
 |
 |
| Module-wise count rates for Quadrant B Data is divided into 100 sec bins |
 |
 |
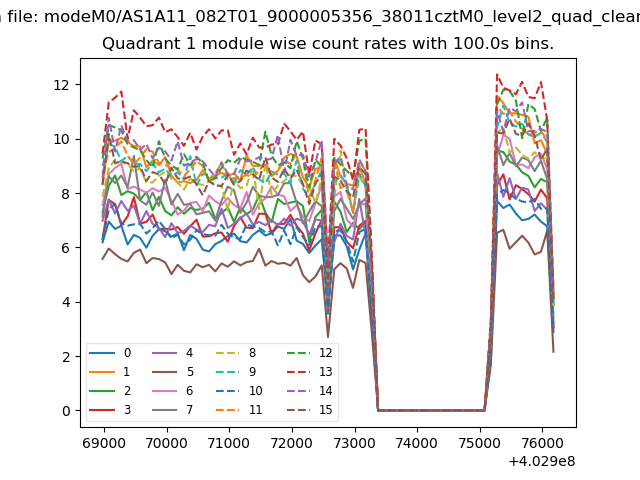
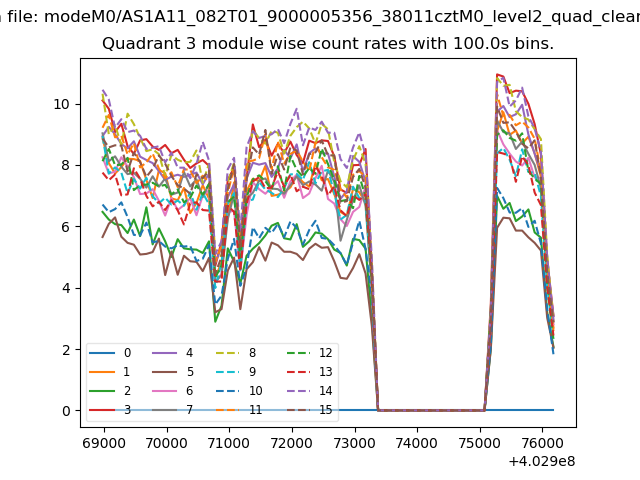
| Module-wise count rates for Quadrant C Data is divided into 100 sec bins |
 |
 |
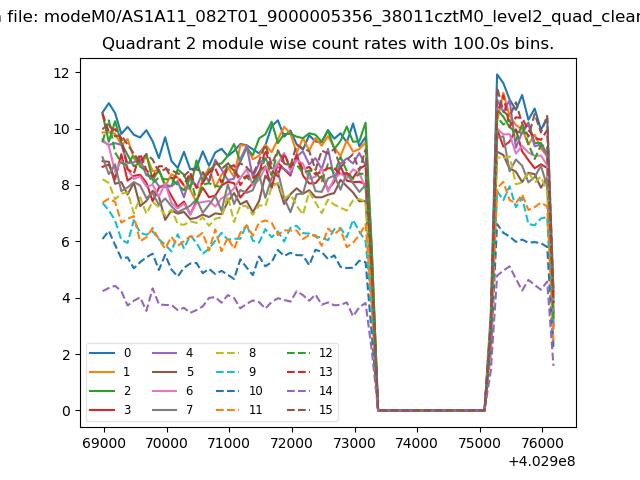
| Module-wise count rates for Quadrant D Data is divided into 100 sec bins |
 |
 |
| Parameter | Plot |
|---|---|
| CZT HV Monitor | 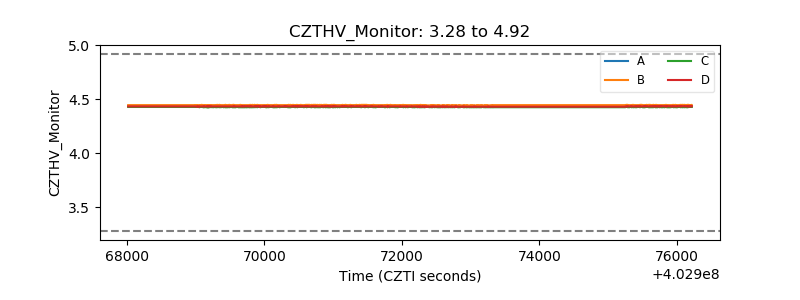 |
| D_VDD | 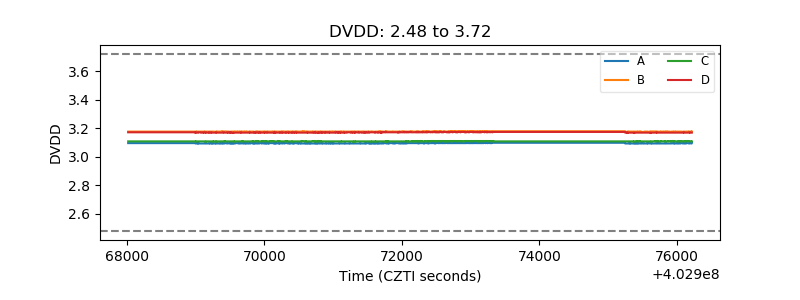 |
| Temperature 1 | 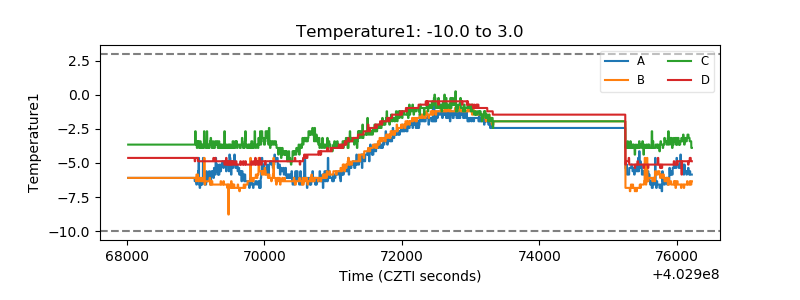 |
| Veto HV Monitor | 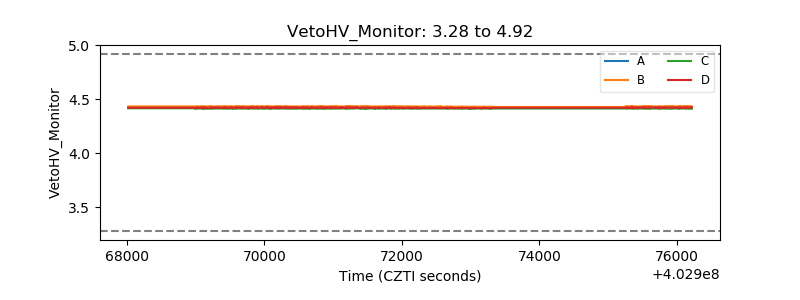 |
| Veto LLD | 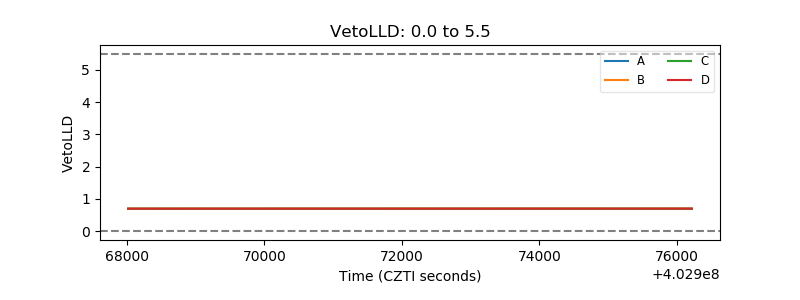 |
| Alpha Counter | 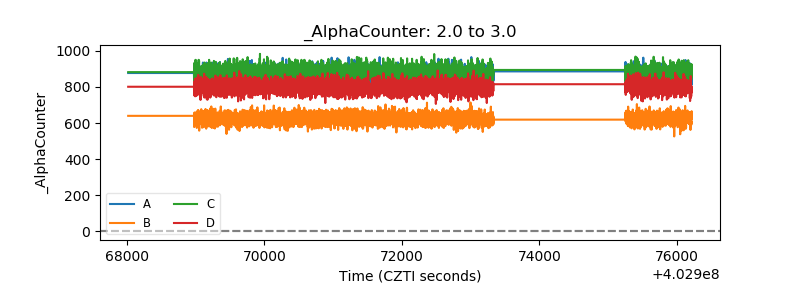 |
| _CPM_Rate | 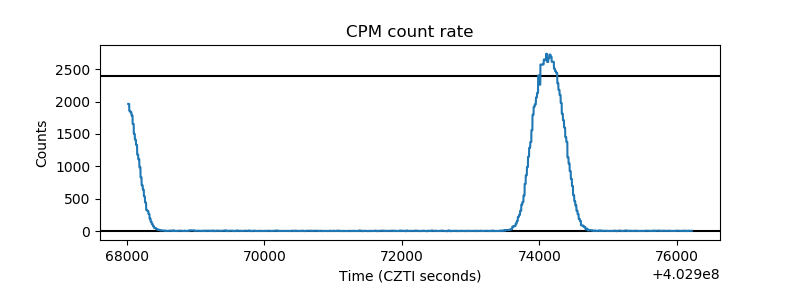 |
| CZT Counter | 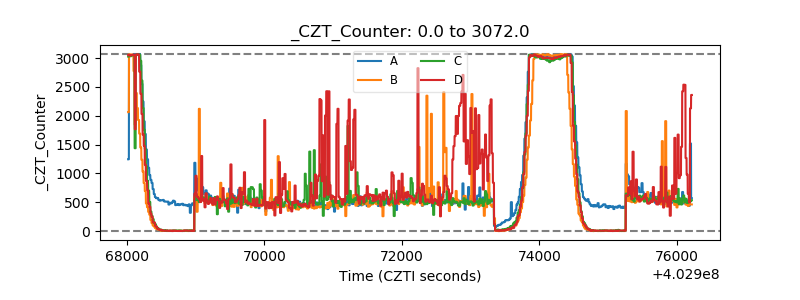 |
| +2.5 Volts monitor | 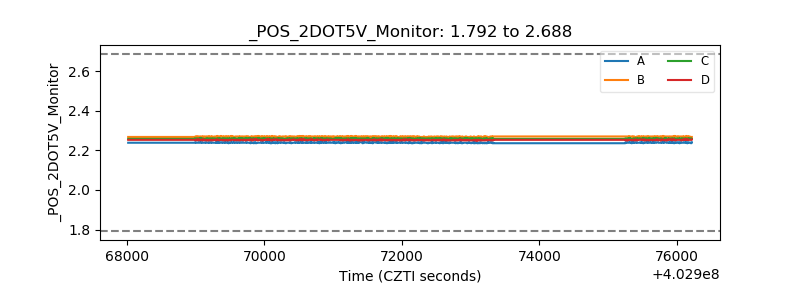 |
| +5 Volts monitor | 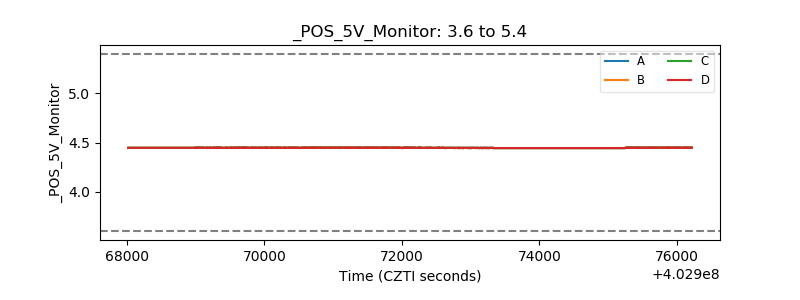 |
| _ROLL_ROT | 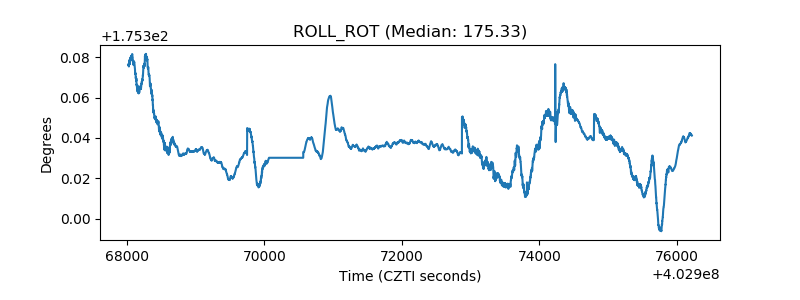 |
| _Roll_DEC | 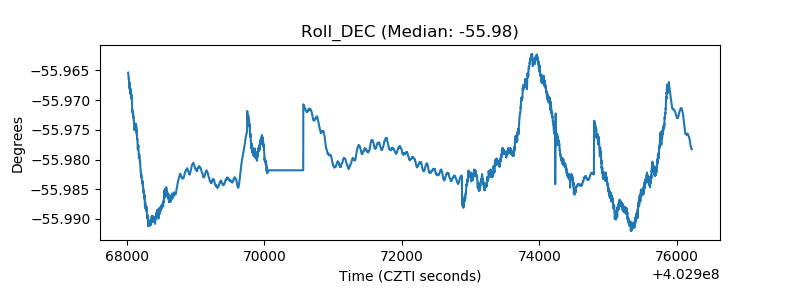 |
| _Roll_RA | 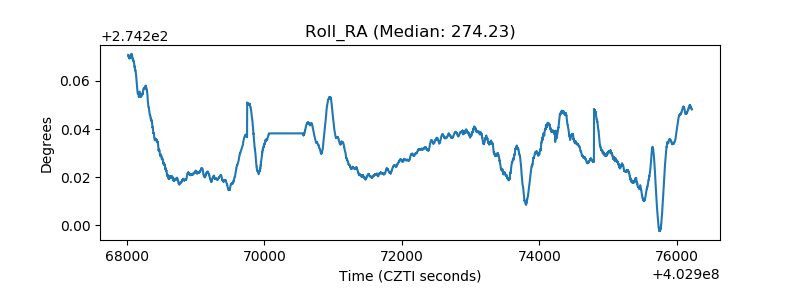 |
| Veto Counter | 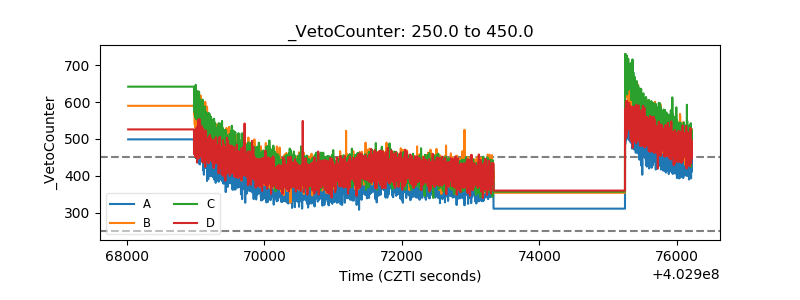 |