| Param | Original file | Final file |
|---|---|---|
| Filename | modeM0/AS1A11_082T01_9000005356_38012cztM0_level2.fits | modeM0/AS1A11_082T01_9000005356_38012cztM0_level2_quad_clean.evt |
| Size (bytes) | 358,761,600 | 99,959,040 |
| Size | 342.1 MB | 95.3 MB |
| Events in quadrant A | 2,900,507 | 684,289 |
| Events in quadrant B | 2,702,247 | 712,290 |
| Events in quadrant C | 2,842,818 | 684,816 |
| Events in quadrant D | 4,437,213 | 587,978 |
| Mode M0 | |||
|---|---|---|---|
| Quadrant | BADHDUFLAG | Total packets | Discarded packets |
| A | 0 | 11520 | 3 |
| B | 0 | 10927 | 2 |
| C | 0 | 11223 | 2 |
| D | 0 | 16577 | 2 |
| Mode SS | |||
|---|---|---|---|
| Quadrant | BADHDUFLAG | Total packets | Discarded packets |
| A | 0 | 104 | 0 |
| B | 0 | 104 | 0 |
| C | 0 | 104 | 0 |
| D | 0 | 104 | 0 |
| Mode M9 | |||
|---|---|---|---|
| Quadrant | BADHDUFLAG | Total packets | Discarded packets |
| A | 0 | 29 | 0 |
| B | 0 | 29 | 0 |
| C | 0 | 29 | 0 |
| D | 0 | 30 | 0 |
| Quadrant | Total seconds | Saturated seconds | Saturation percentage |
|---|---|---|---|
| A | 5108 | 12 | 0.234926% |
| B | 5108 | 27 | 0.528583% |
| C | 5108 | 19 | 0.371966% |
| D | 5108 | 376 | 7.361002% |
Noise dominated data is calculated using 1-second bins in cleaned event files. If a bin has >2000 counts, and if more than 50% of those come from <1% of pixels, then it is considered to be noise-dominated and hence unusable.
| Quadrant | # 1 sec bins | Bins with >0 counts | Bins with >2000 counts | High rate bins dominated by noise | Noise dominated (total time) | Noise dominated (detector-on time) | Marked lightcurve |
|---|---|---|---|---|---|---|---|
| A | 7141 | 5109 | 3 | 3 | 0.04% | 0.06% | 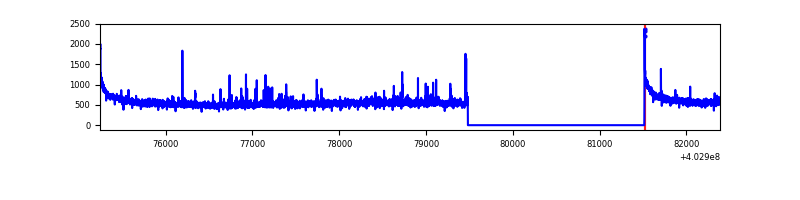 |
| B | 7141 | 5109 | 12 | 12 | 0.17% | 0.23% | 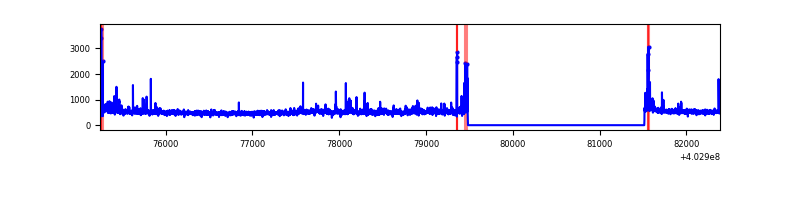 |
| C | 7141 | 5109 | 10 | 10 | 0.14% | 0.20% | 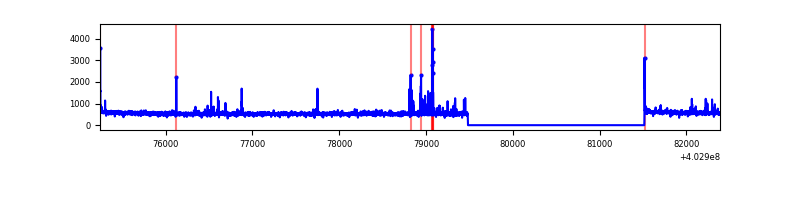 |
| D | 7141 | 5109 | 339 | 339 | 4.75% | 6.64% | 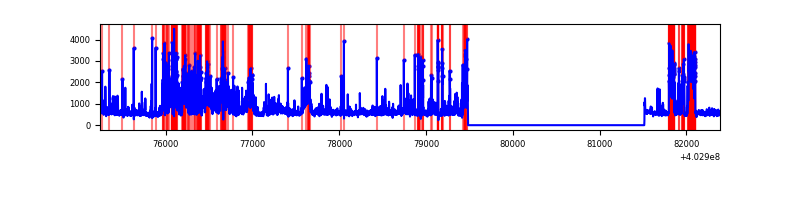 |
Top three noisy pixels from each quadrant. If the there are fewer than three noisy pixels in the level2.evt file, extra rows are filled as -1
| Pixel properties | Quadrant properties | ||||||
|---|---|---|---|---|---|---|---|
| Quadrant | DetID | PixID | Counts | Sigma | Mean | Median | Sigma |
| A | 10 | 83 | 359876 | 2838.5 | 634 | 623 | 126.6 |
| A | 12 | 16 | 54651 | 426.88 | 634 | 623 | 126.6 |
| A | 12 | 194 | 11419 | 85.3 | 634 | 623 | 126.6 |
| B | 5 | 255 | 73938 | 618.59 | 637 | 622 | 118.5 |
| B | 0 | 230 | 28141 | 232.18 | 637 | 622 | 118.5 |
| B | 0 | 155 | 17759 | 144.59 | 637 | 622 | 118.5 |
| C | 15 | 214 | 217464 | 1503.52 | 632 | 637 | 144.2 |
| C | 15 | 159 | 70630 | 485.34 | 632 | 637 | 144.2 |
| C | 14 | 254 | 47261 | 323.3 | 632 | 637 | 144.2 |
| D | 13 | 171 | 991588 | 6829.42 | 608 | 593 | 145.1 |
| D | 12 | 227 | 474837 | 3268.24 | 608 | 593 | 145.1 |
| D | 7 | 223 | 206264 | 1417.38 | 608 | 593 | 145.1 |
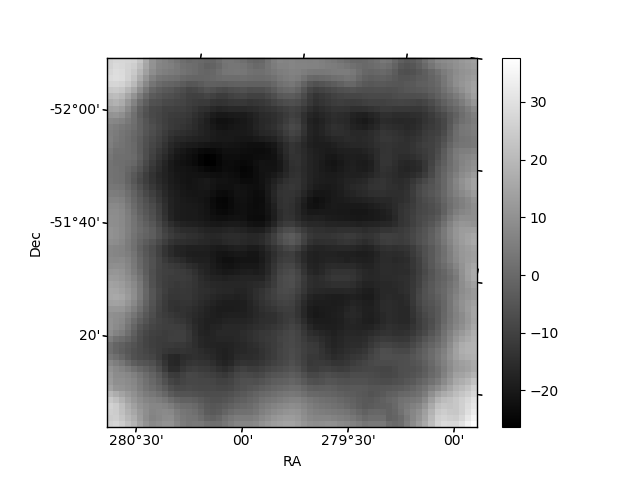
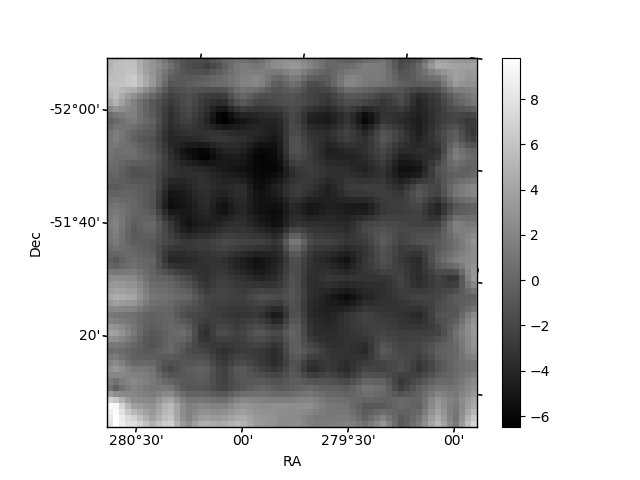
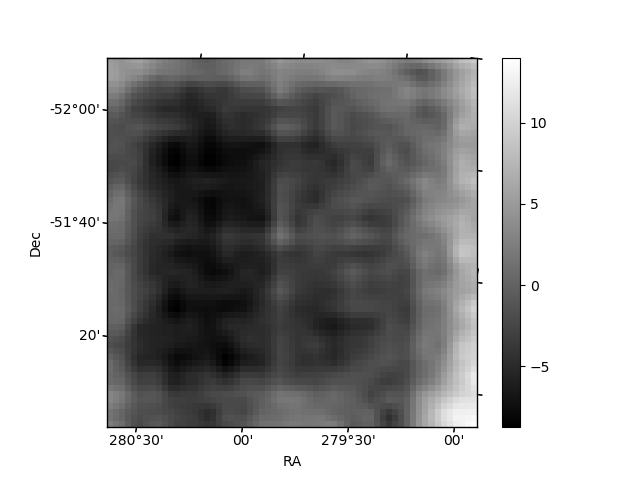
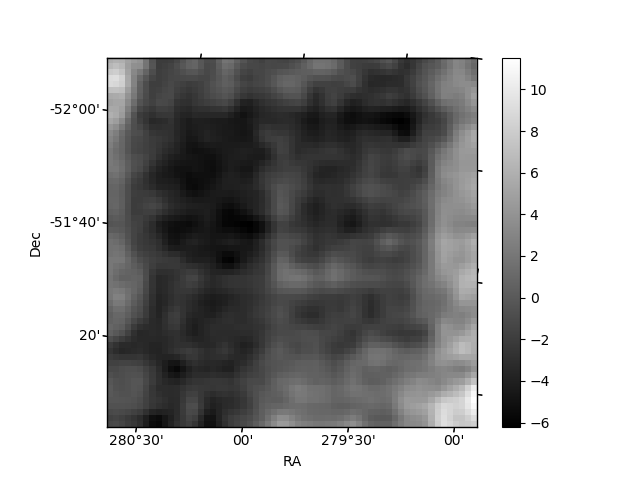
Histogram calculated using DETX and DETY for each event in the final _common_clean file
| Quadrant A | 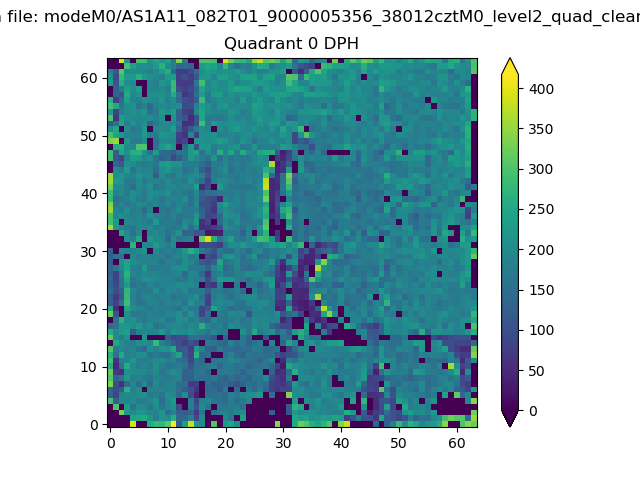 |
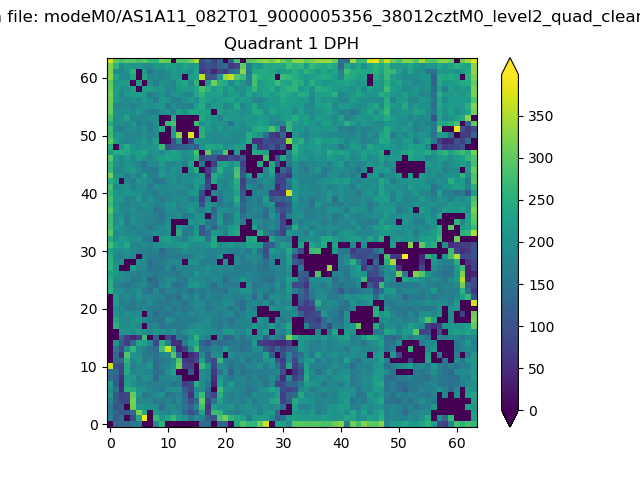 |
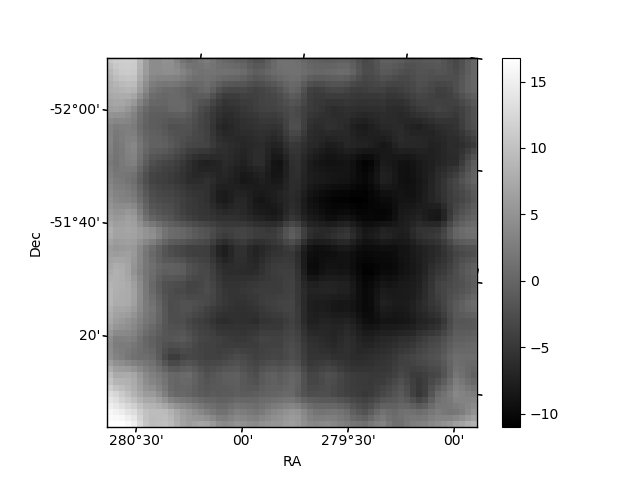
Quadrant B |
|---|---|---|---|
| Quadrant D | 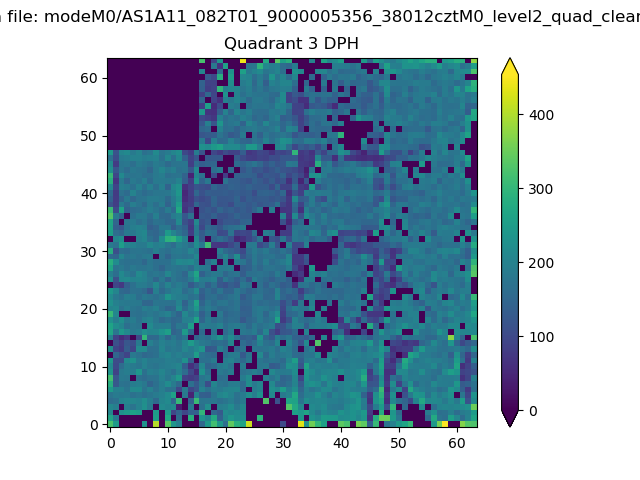 |
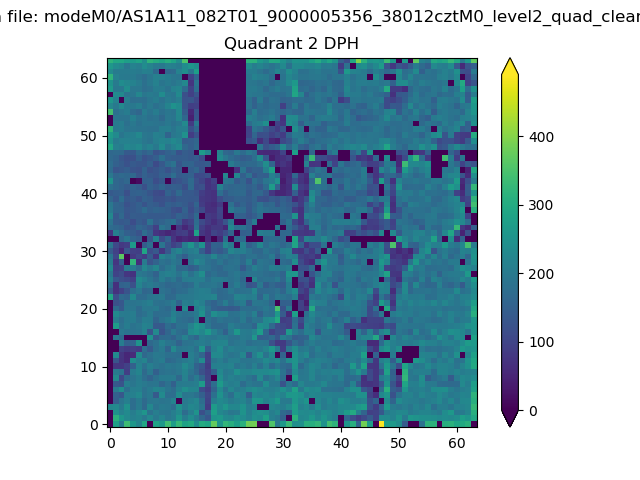 |
Quadrant C |
| Plot type | Count rate plots | Images |
|---|---|---|
| Comparison with Poisson distribution Blue bars denote a histogram of data divided into 1 sec bins. Red curve is a Poisson curve with rate = median count rate of data. |
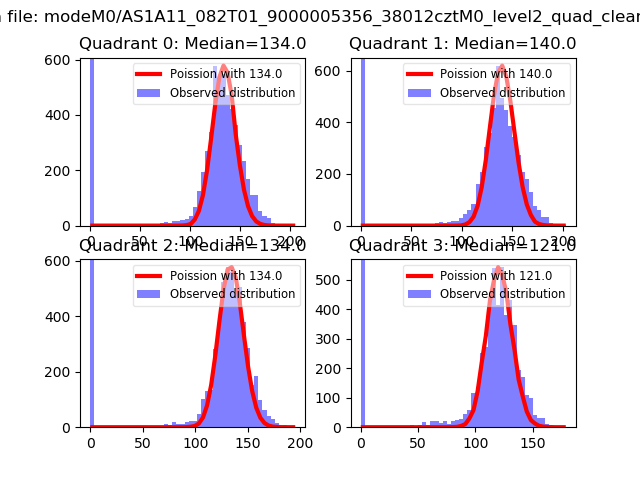 |
 |
| Quadrant-wise count rates Data is divided into 100 sec bins |
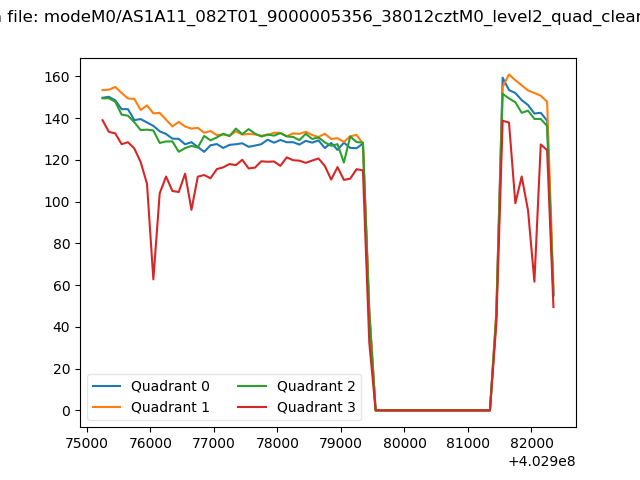 |
|
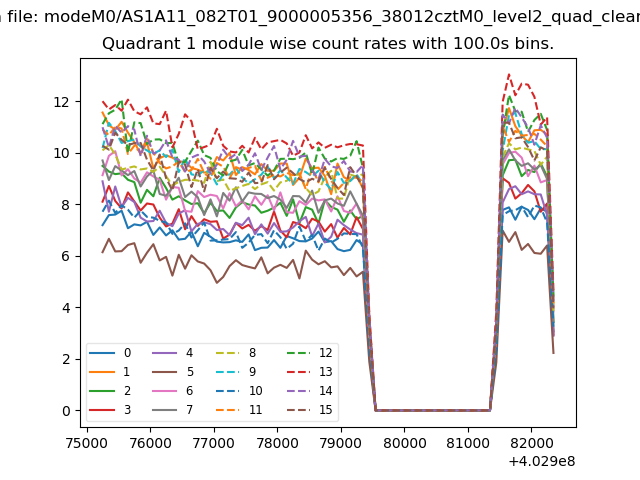
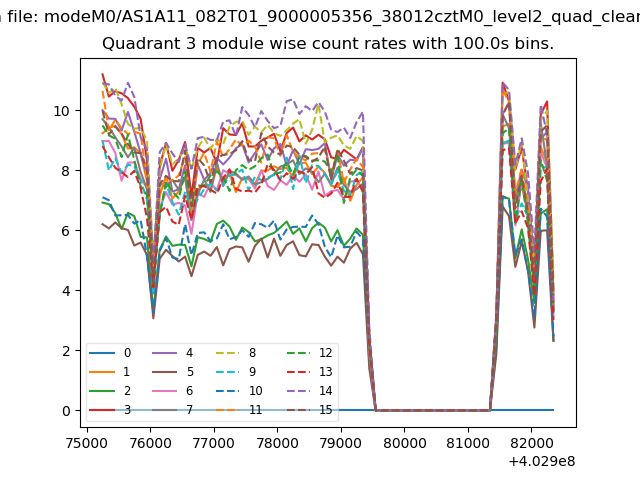
| Module-wise count rates for Quadrant A Data is divided into 100 sec bins |
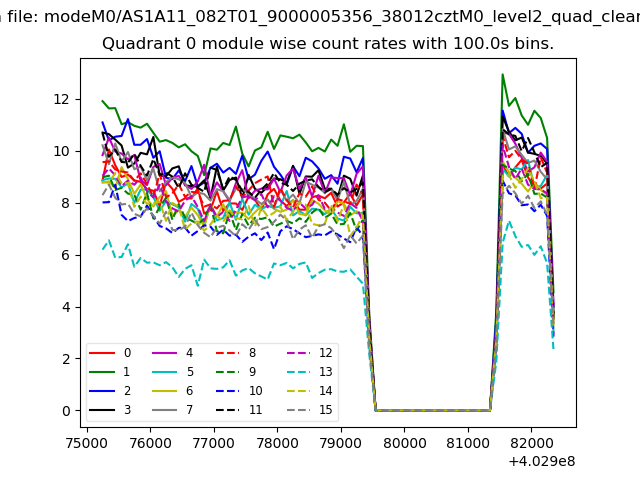 |
 |
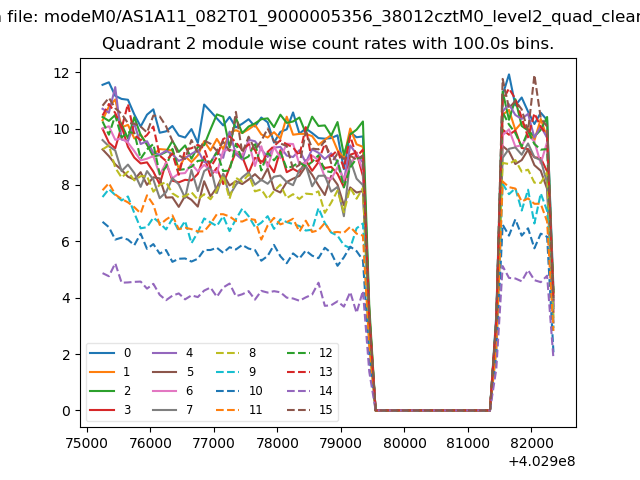
| Module-wise count rates for Quadrant B Data is divided into 100 sec bins |
 |
 |
| Module-wise count rates for Quadrant C Data is divided into 100 sec bins |
 |
 |
| Module-wise count rates for Quadrant D Data is divided into 100 sec bins |
 |
 |
| Parameter | Plot |
|---|---|
| CZT HV Monitor | 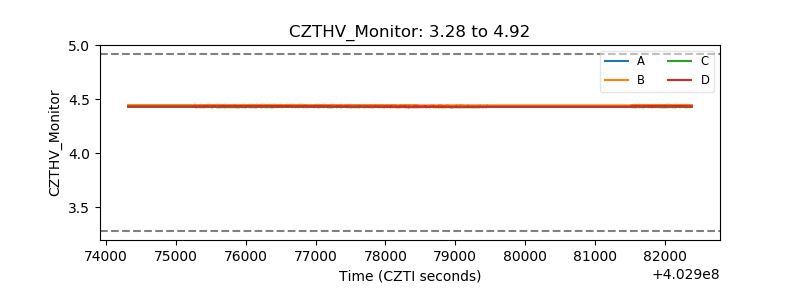 |
| D_VDD | 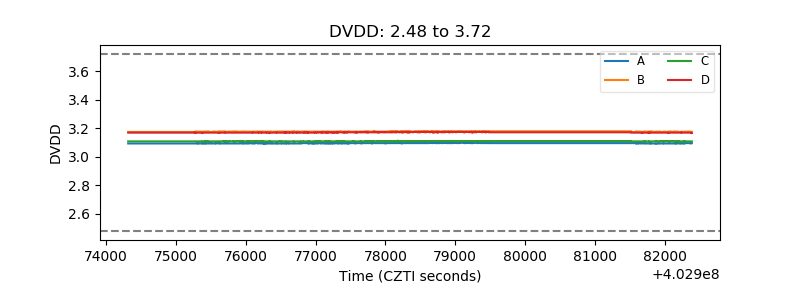 |
| Temperature 1 | 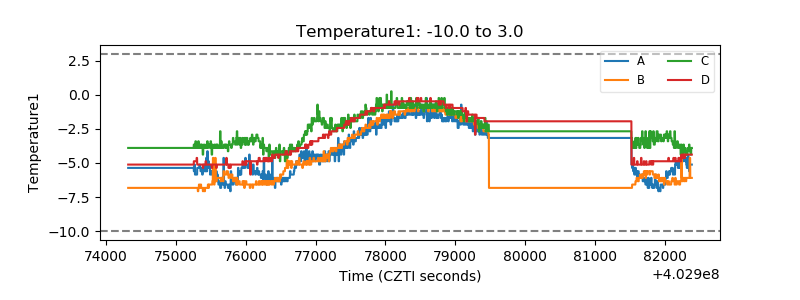 |
| Veto HV Monitor | 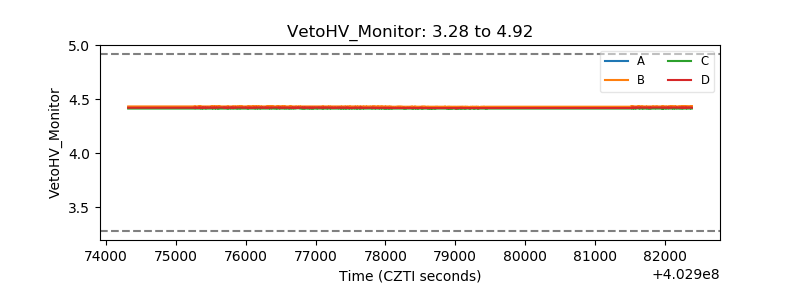 |
| Veto LLD | 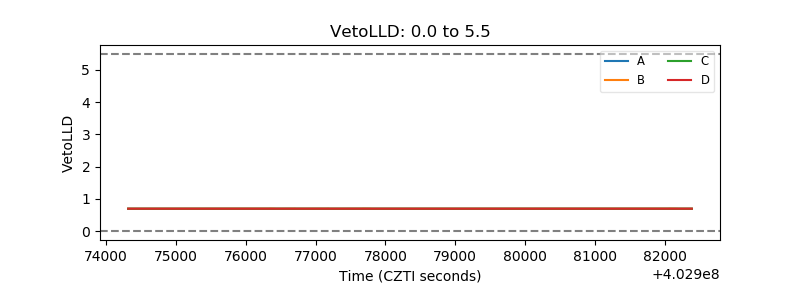 |
| Alpha Counter | 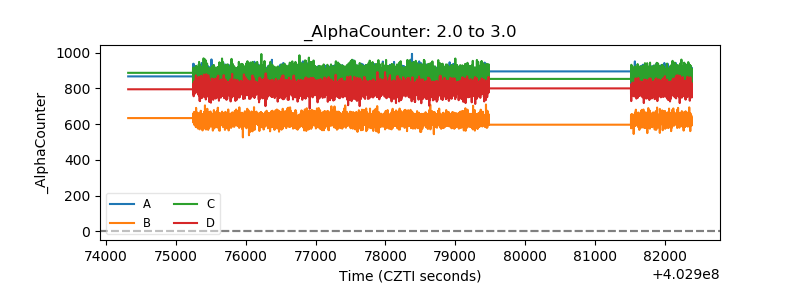 |
| _CPM_Rate | 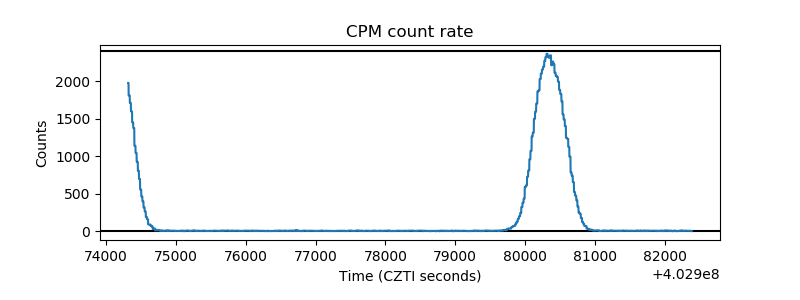 |
| CZT Counter | 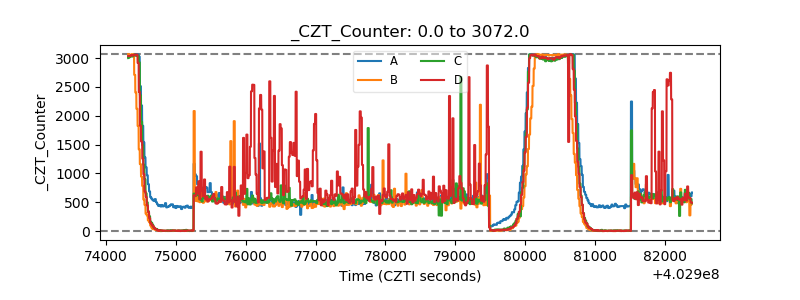 |
| +2.5 Volts monitor | 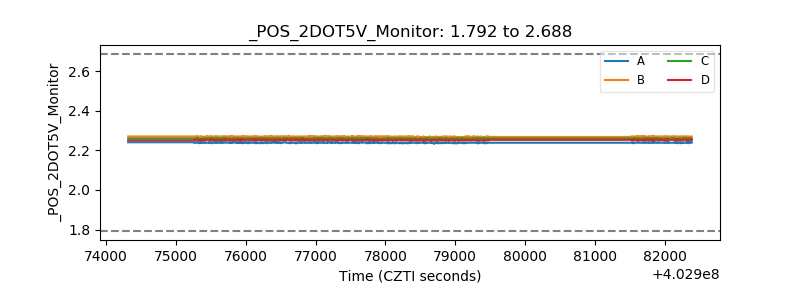 |
| +5 Volts monitor | 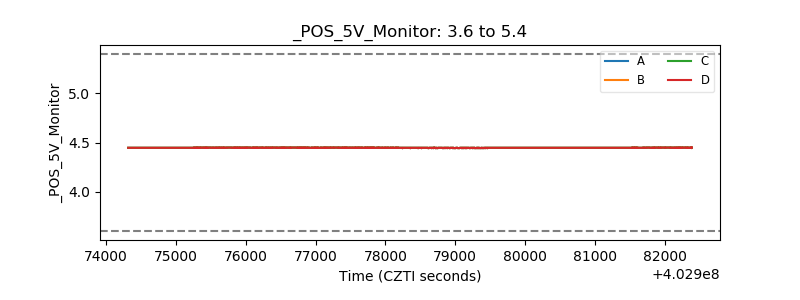 |
| _ROLL_ROT | 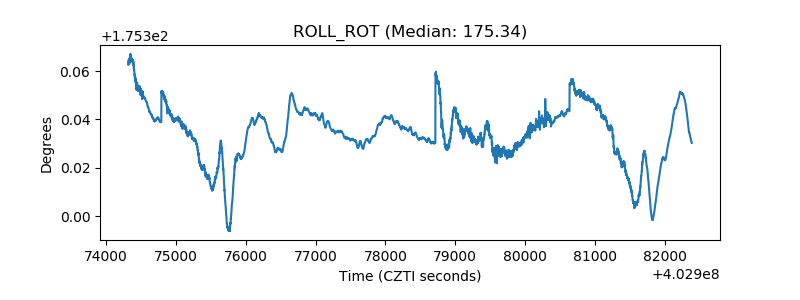 |
| _Roll_DEC | 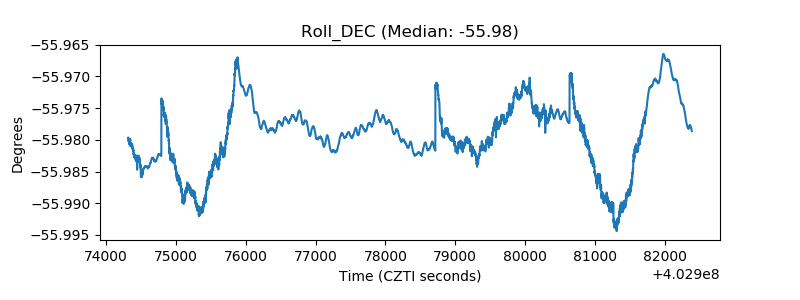 |
| _Roll_RA | 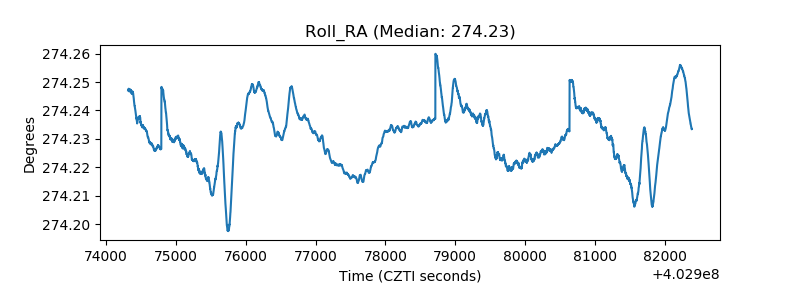 |
| Veto Counter | 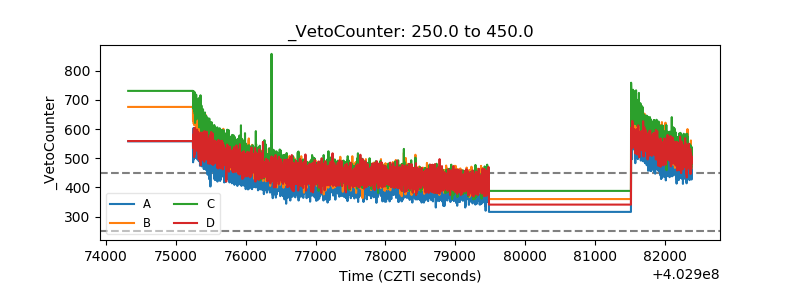 |