| Param | Original file | Final file |
|---|---|---|
| Filename | modeM0/AS1A11_082T01_9000005356_38013cztM0_level2.fits | modeM0/AS1A11_082T01_9000005356_38013cztM0_level2_quad_clean.evt |
| Size (bytes) | 355,576,320 | 49,440,960 |
| Size | 339.1 MB | 47.2 MB |
| Events in quadrant A | 2,811,167 | 291,765 |
| Events in quadrant B | 2,908,180 | 299,374 |
| Events in quadrant C | 2,762,986 | 298,424 |
| Events in quadrant D | 4,294,974 | 260,043 |
| Mode M0 | |||
|---|---|---|---|
| Quadrant | BADHDUFLAG | Total packets | Discarded packets |
| A | 0 | 11122 | 11072 |
| B | 0 | 11466 | 11416 |
| C | 0 | 10947 | 10897 |
| D | 0 | 16056 | 16006 |
| Mode SS | |||
|---|---|---|---|
| Quadrant | BADHDUFLAG | Total packets | Discarded packets |
| A | 0 | 102 | 0 |
| B | 0 | 102 | 0 |
| C | 0 | 102 | 0 |
| D | 0 | 102 | 0 |
| Mode M9 | |||
|---|---|---|---|
| Quadrant | BADHDUFLAG | Total packets | Discarded packets |
| A | 0 | 30 | 0 |
| B | 0 | 30 | 0 |
| C | 0 | 30 | 0 |
| D | 0 | 31 | 0 |
| Quadrant | Total seconds | Saturated seconds | Saturation percentage |
|---|---|---|---|
| A | 4947 | 12 | 0.242571% |
| B | 4947 | 103 | 2.082070% |
| C | 4947 | 15 | 0.303214% |
| D | 4947 | 402 | 8.126137% |
Noise dominated data is calculated using 1-second bins in cleaned event files. If a bin has >2000 counts, and if more than 50% of those come from <1% of pixels, then it is considered to be noise-dominated and hence unusable.
| Quadrant | # 1 sec bins | Bins with >0 counts | Bins with >2000 counts | High rate bins dominated by noise | Noise dominated (total time) | Noise dominated (detector-on time) | Marked lightcurve |
|---|---|---|---|---|---|---|---|
| A | 7038 | 4948 | 6 | 6 | 0.09% | 0.12% | 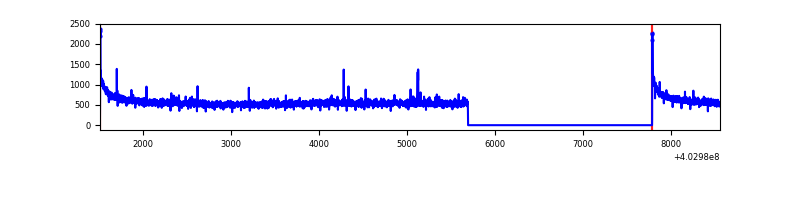 |
| B | 7038 | 4948 | 71 | 71 | 1.01% | 1.43% | 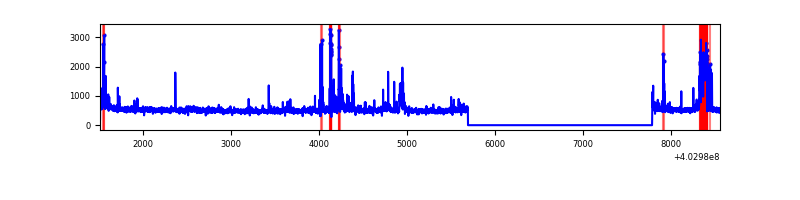 |
| C | 7038 | 4948 | 11 | 11 | 0.16% | 0.22% | 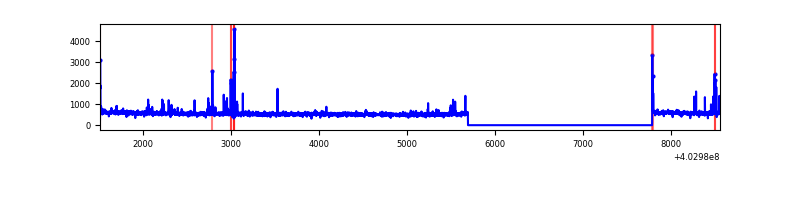 |
| D | 7038 | 4948 | 345 | 345 | 4.90% | 6.97% | 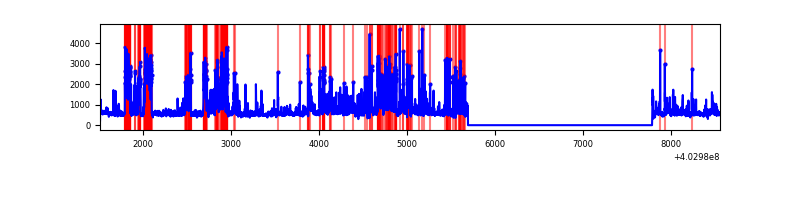 |
Top three noisy pixels from each quadrant. If the there are fewer than three noisy pixels in the level2.evt file, extra rows are filled as -1
| Pixel properties | Quadrant properties | ||||||
|---|---|---|---|---|---|---|---|
| Quadrant | DetID | PixID | Counts | Sigma | Mean | Median | Sigma |
| A | 10 | 83 | 358956 | 2885.74 | 623 | 613 | 124.2 |
| A | 15 | 222 | 13901 | 107.01 | 623 | 613 | 124.2 |
| A | 12 | 189 | 9298 | 69.94 | 623 | 613 | 124.2 |
| B | 0 | 229 | 237877 | 2055.36 | 621 | 608 | 115.4 |
| B | 4 | 171 | 113998 | 982.25 | 621 | 608 | 115.4 |
| B | 5 | 255 | 51502 | 440.87 | 621 | 608 | 115.4 |
| C | 15 | 214 | 214522 | 1517.0 | 618 | 624 | 141.0 |
| C | 14 | 254 | 96598 | 680.66 | 618 | 624 | 141.0 |
| C | 0 | 10 | 16645 | 113.62 | 618 | 624 | 141.0 |
| D | 12 | 227 | 871858 | 6056.71 | 598 | 582 | 143.9 |
| D | 1 | 52 | 579819 | 4026.59 | 598 | 582 | 143.9 |
| D | 7 | 223 | 255774 | 1773.98 | 598 | 582 | 143.9 |
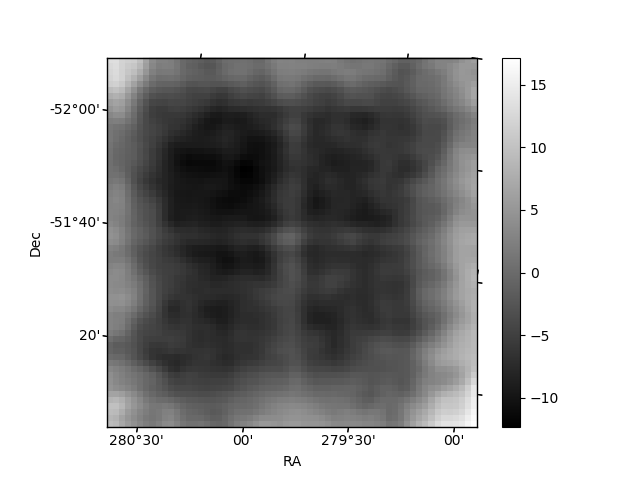
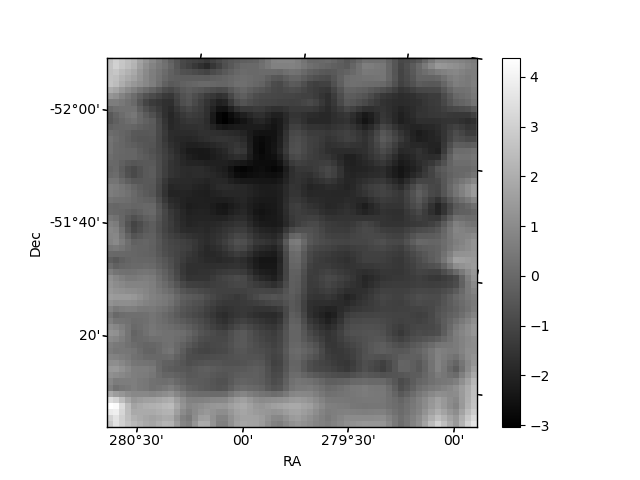
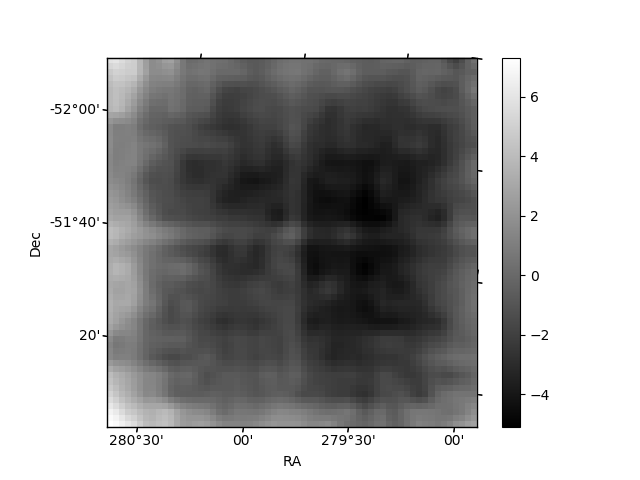
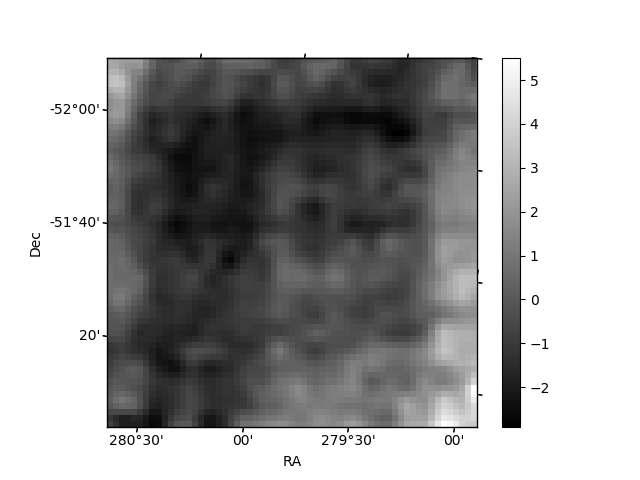
Histogram calculated using DETX and DETY for each event in the final _common_clean file
| Quadrant A | 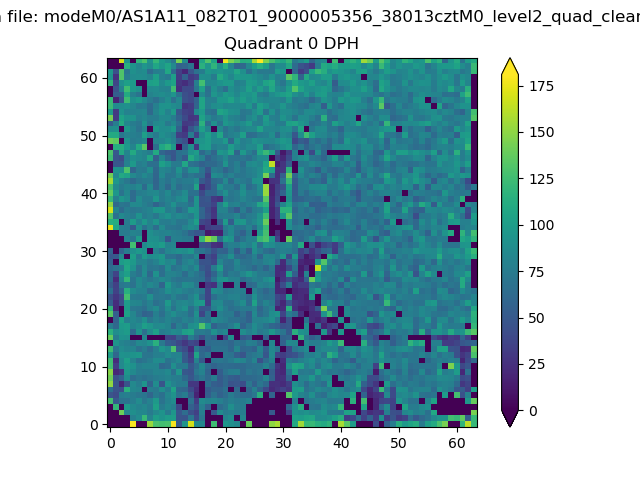 |
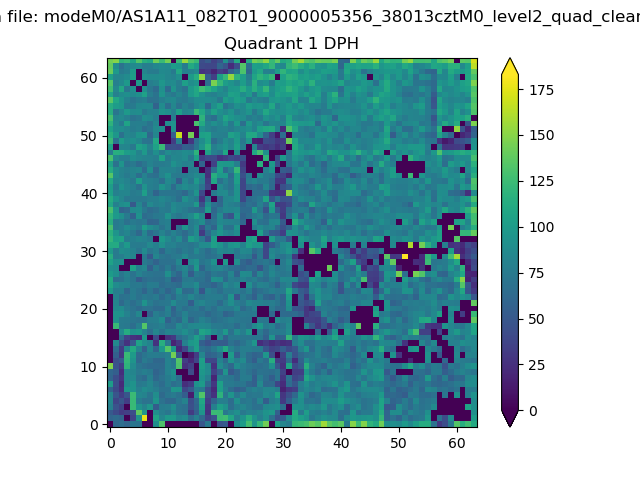 |
Quadrant B |
|---|---|---|---|
| Quadrant D | 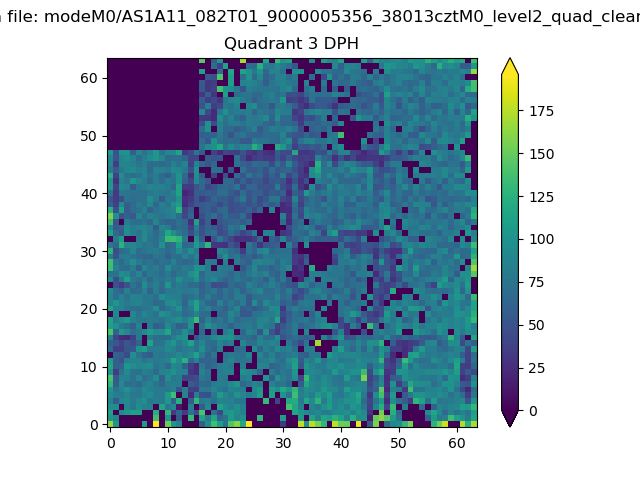 |
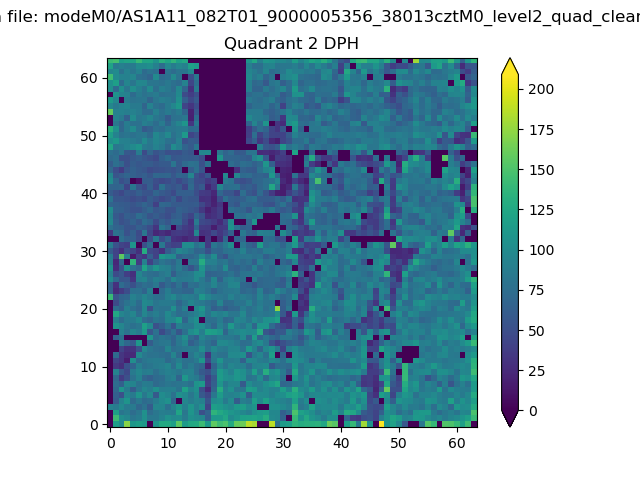 |
Quadrant C |
| Plot type | Count rate plots | Images |
|---|---|---|
| Comparison with Poisson distribution Blue bars denote a histogram of data divided into 1 sec bins. Red curve is a Poisson curve with rate = median count rate of data. |
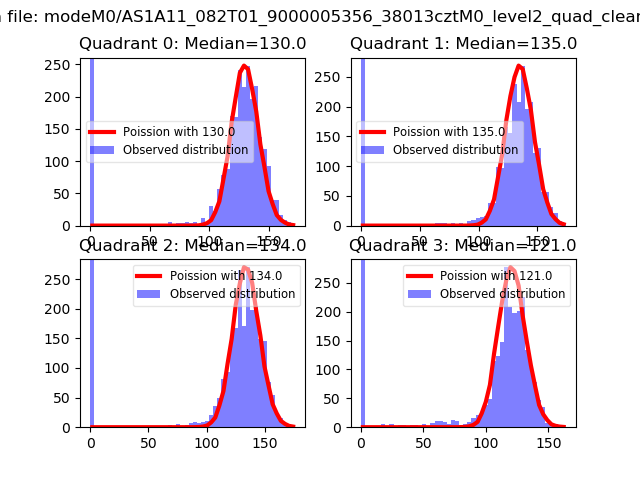 |
 |
| Quadrant-wise count rates Data is divided into 100 sec bins |
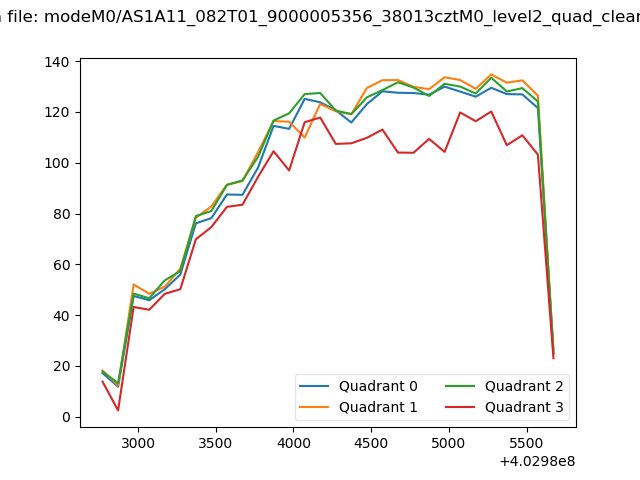 |
|
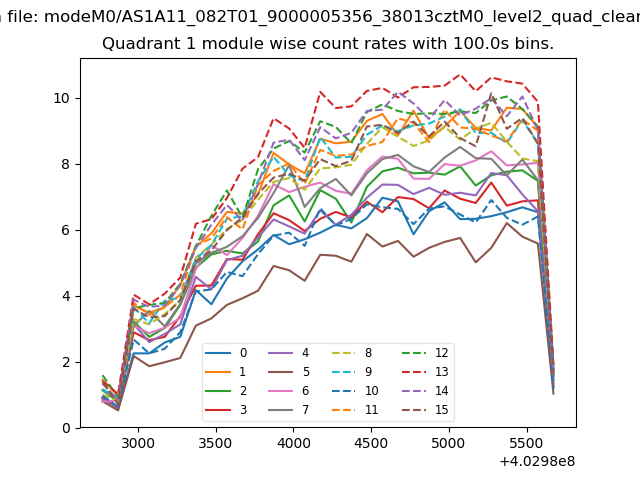
| Module-wise count rates for Quadrant A Data is divided into 100 sec bins |
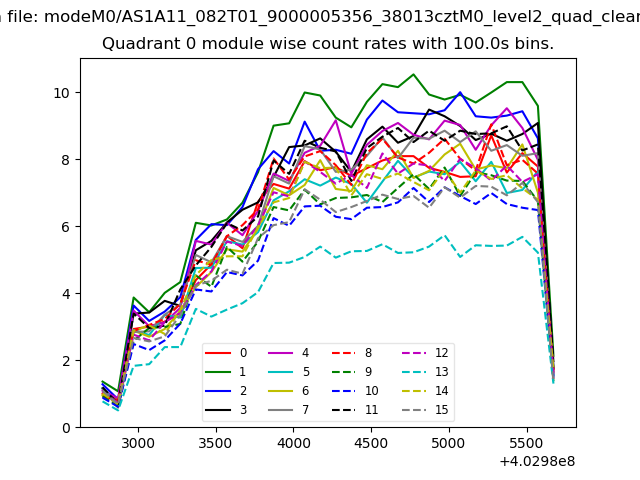 |
 |
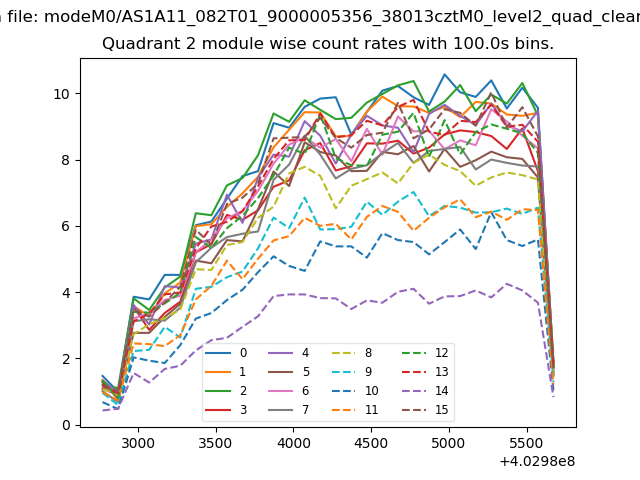
| Module-wise count rates for Quadrant B Data is divided into 100 sec bins |
 |
 |
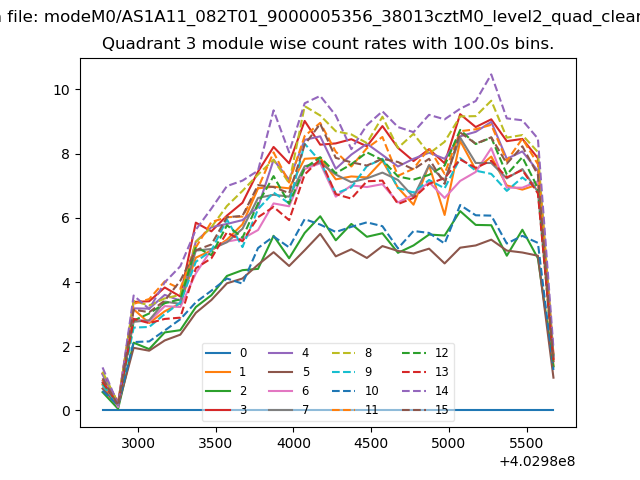
| Module-wise count rates for Quadrant C Data is divided into 100 sec bins |
 |
 |
| Module-wise count rates for Quadrant D Data is divided into 100 sec bins |
 |
 |
| Parameter | Plot |
|---|---|
| CZT HV Monitor |  |
| D_VDD | 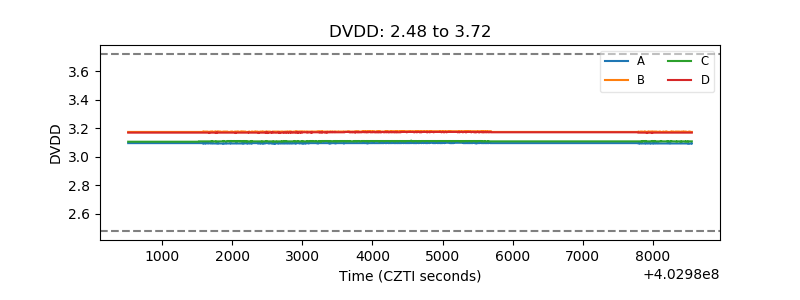 |
| Temperature 1 | 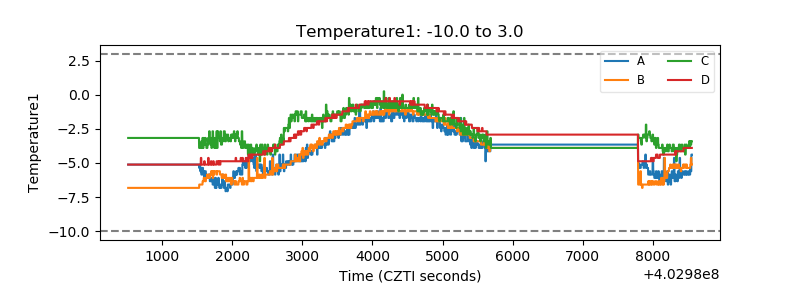 |
| Veto HV Monitor | 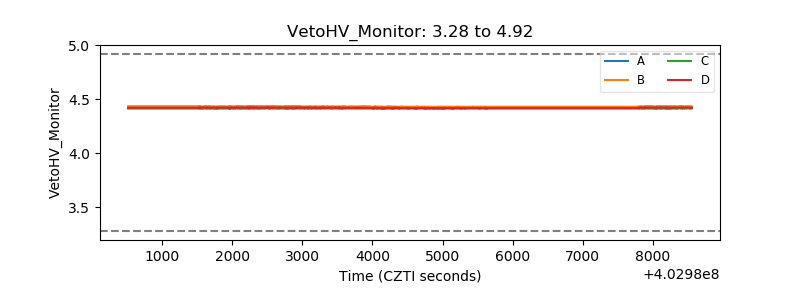 |
| Veto LLD | 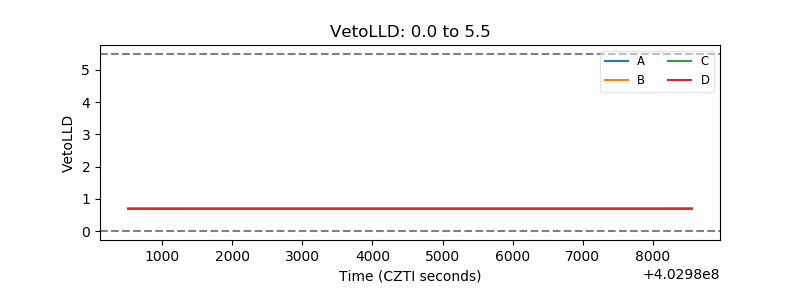 |
| Alpha Counter | 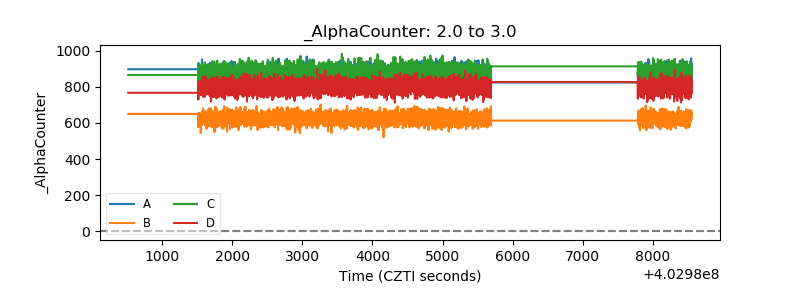 |
| _CPM_Rate | 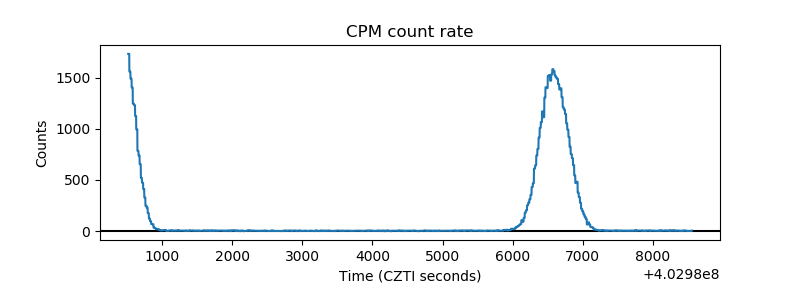 |
| CZT Counter | 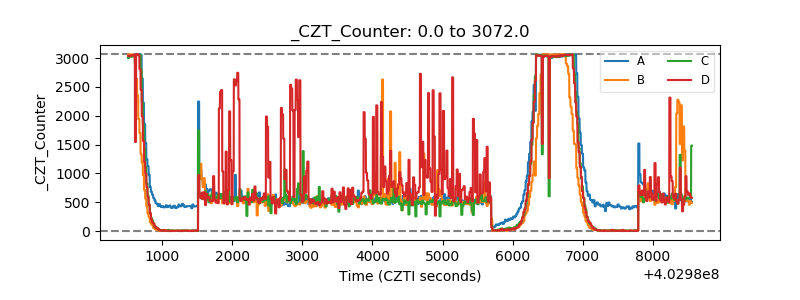 |
| +2.5 Volts monitor | 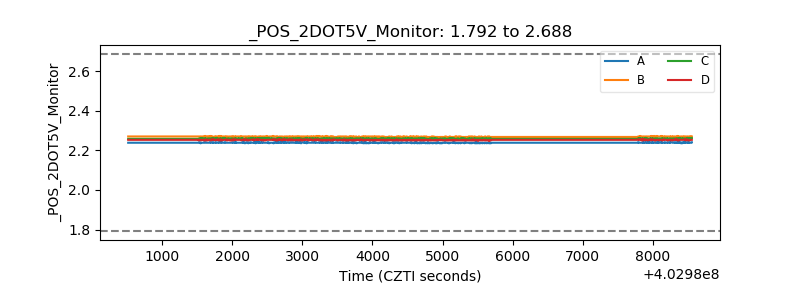 |
| +5 Volts monitor | 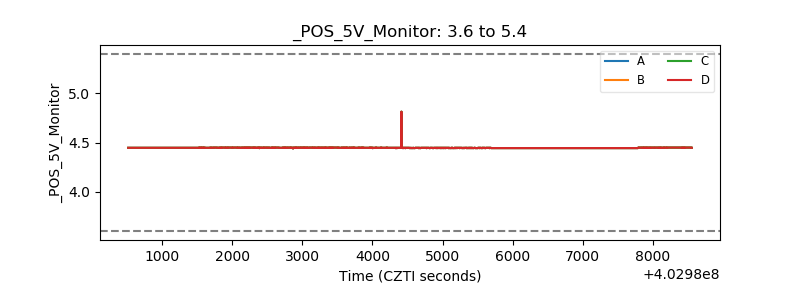 |
| _ROLL_ROT | 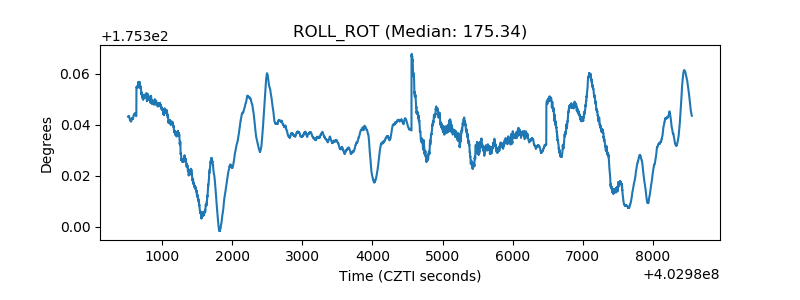 |
| _Roll_DEC | 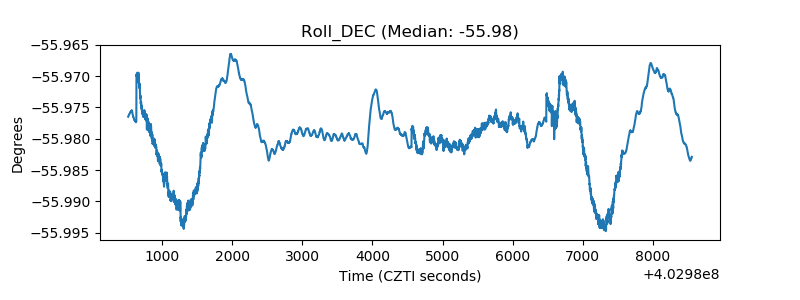 |
| _Roll_RA | 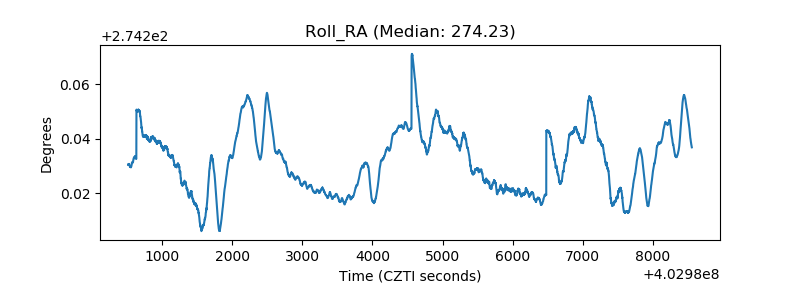 |
| Veto Counter | 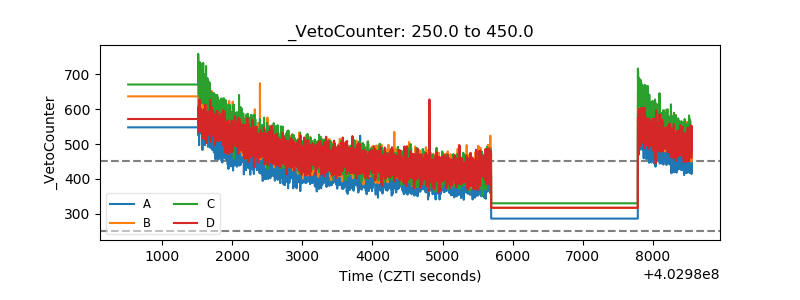 |