| Param | Original file | Final file |
|---|---|---|
| Filename | modeM0/AS1A11_082T01_9000005356_38014cztM0_level2.fits | modeM0/AS1A11_082T01_9000005356_38014cztM0_level2_quad_clean.evt |
| Size (bytes) | 341,913,600 | 95,598,720 |
| Size | 326.1 MB | 91.2 MB |
| Events in quadrant A | 2,775,420 | 645,377 |
| Events in quadrant B | 2,986,721 | 660,702 |
| Events in quadrant C | 2,627,027 | 657,181 |
| Events in quadrant D | 3,884,323 | 586,797 |
| Mode M0 | |||
|---|---|---|---|
| Quadrant | BADHDUFLAG | Total packets | Discarded packets |
| A | 0 | 11024 | 3 |
| B | 0 | 11782 | 2 |
| C | 0 | 10506 | 2 |
| D | 0 | 14886 | 2 |
| Mode SS | |||
|---|---|---|---|
| Quadrant | BADHDUFLAG | Total packets | Discarded packets |
| A | 0 | 100 | 0 |
| B | 0 | 100 | 0 |
| C | 0 | 100 | 0 |
| D | 0 | 100 | 0 |
| Mode M9 | |||
|---|---|---|---|
| Quadrant | BADHDUFLAG | Total packets | Discarded packets |
| A | 0 | 32 | 0 |
| B | 0 | 32 | 0 |
| C | 0 | 32 | 0 |
| D | 0 | 33 | 0 |
| Quadrant | Total seconds | Saturated seconds | Saturation percentage |
|---|---|---|---|
| A | 4921 | 13 | 0.264174% |
| B | 4921 | 146 | 2.966877% |
| C | 4921 | 9 | 0.182890% |
| D | 4921 | 139 | 2.824629% |
Noise dominated data is calculated using 1-second bins in cleaned event files. If a bin has >2000 counts, and if more than 50% of those come from <1% of pixels, then it is considered to be noise-dominated and hence unusable.
| Quadrant | # 1 sec bins | Bins with >0 counts | Bins with >2000 counts | High rate bins dominated by noise | Noise dominated (total time) | Noise dominated (detector-on time) | Marked lightcurve |
|---|---|---|---|---|---|---|---|
| A | 7075 | 4922 | 5 | 5 | 0.07% | 0.10% | 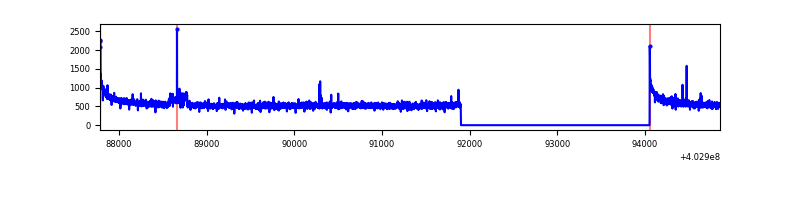 |
| B | 7075 | 4922 | 103 | 103 | 1.46% | 2.09% | 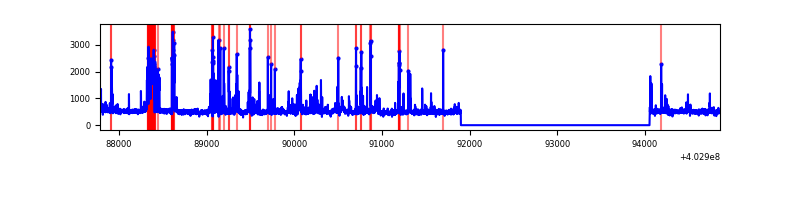 |
| C | 7075 | 4922 | 5 | 5 | 0.07% | 0.10% | 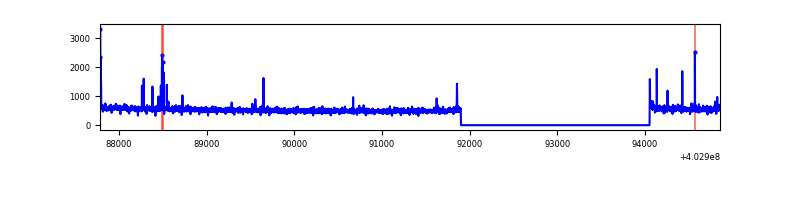 |
| D | 7075 | 4922 | 109 | 109 | 1.54% | 2.21% | 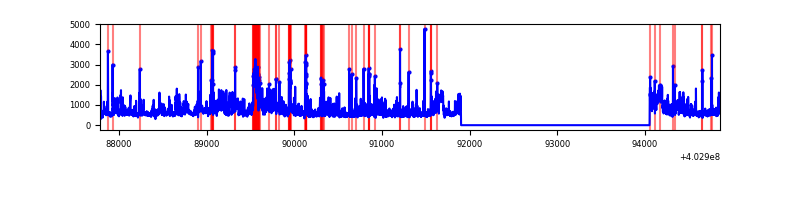 |
Top three noisy pixels from each quadrant. If the there are fewer than three noisy pixels in the level2.evt file, extra rows are filled as -1
| Pixel properties | Quadrant properties | ||||||
|---|---|---|---|---|---|---|---|
| Quadrant | DetID | PixID | Counts | Sigma | Mean | Median | Sigma |
| A | 10 | 83 | 350880 | 2861.17 | 608 | 597 | 122.4 |
| A | 0 | 247 | 30562 | 244.76 | 608 | 597 | 122.4 |
| A | 13 | 6 | 13112 | 102.22 | 608 | 597 | 122.4 |
| B | 0 | 229 | 290339 | 2562.15 | 600 | 585 | 113.1 |
| B | 5 | 255 | 216738 | 1911.33 | 600 | 585 | 113.1 |
| B | 4 | 171 | 40674 | 354.48 | 600 | 585 | 113.1 |
| C | 15 | 214 | 211218 | 1536.65 | 597 | 604 | 137.1 |
| C | 14 | 254 | 51095 | 368.39 | 597 | 604 | 137.1 |
| C | 0 | 10 | 13717 | 95.67 | 597 | 604 | 137.1 |
| D | 1 | 52 | 911038 | 6382.25 | 592 | 577 | 142.7 |
| D | 13 | 171 | 138362 | 965.86 | 592 | 577 | 142.7 |
| D | 7 | 223 | 133386 | 930.98 | 592 | 577 | 142.7 |
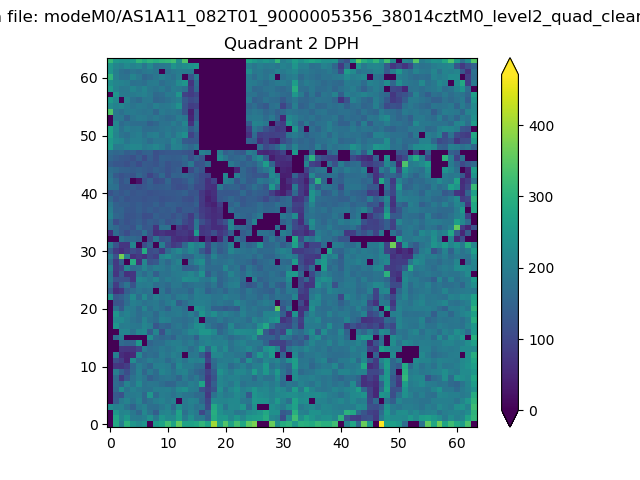
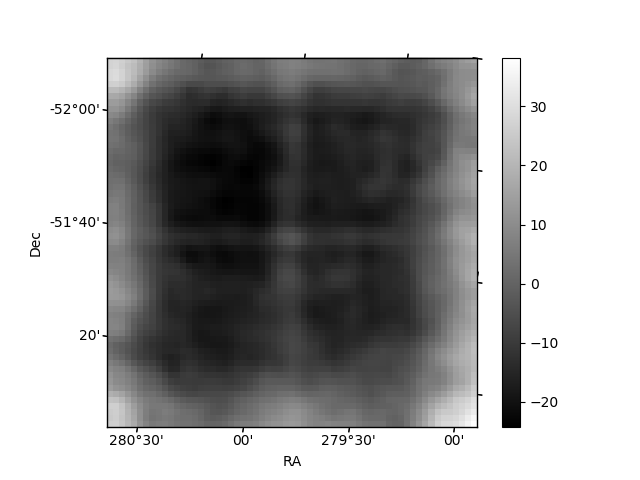
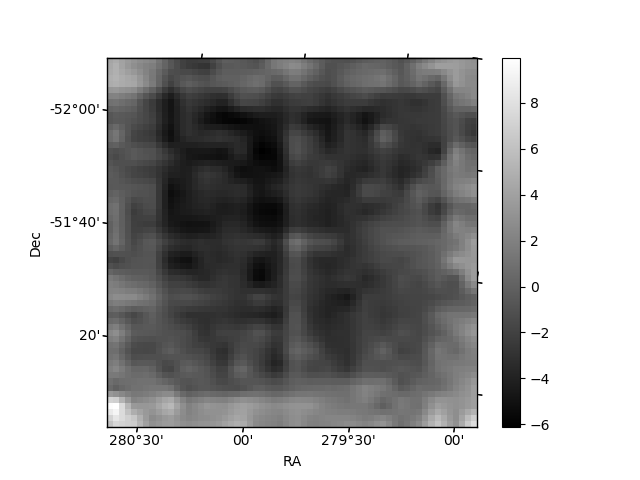
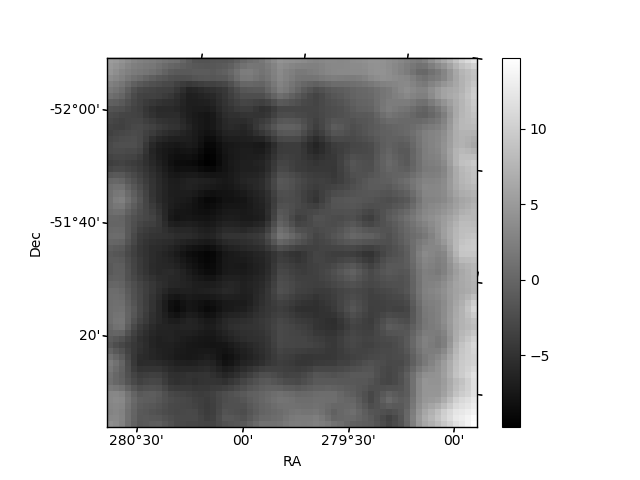
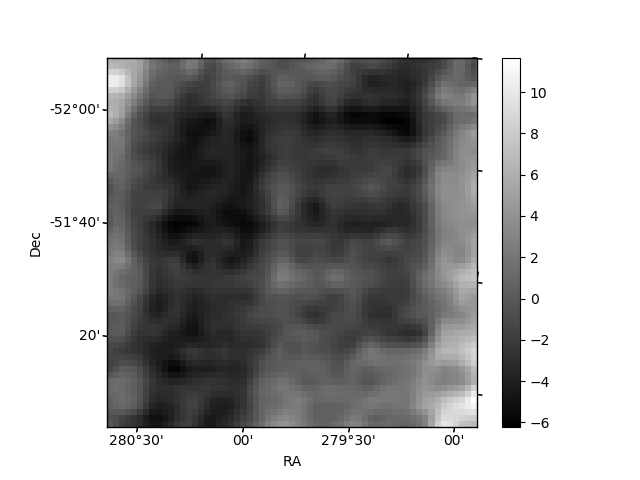
Histogram calculated using DETX and DETY for each event in the final _common_clean file
| Quadrant A | 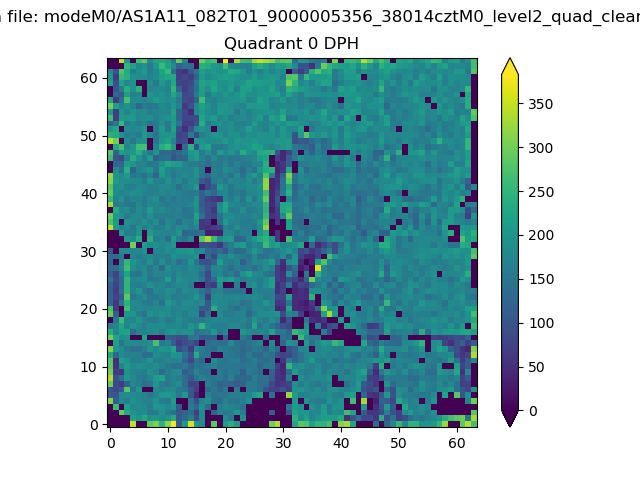 |
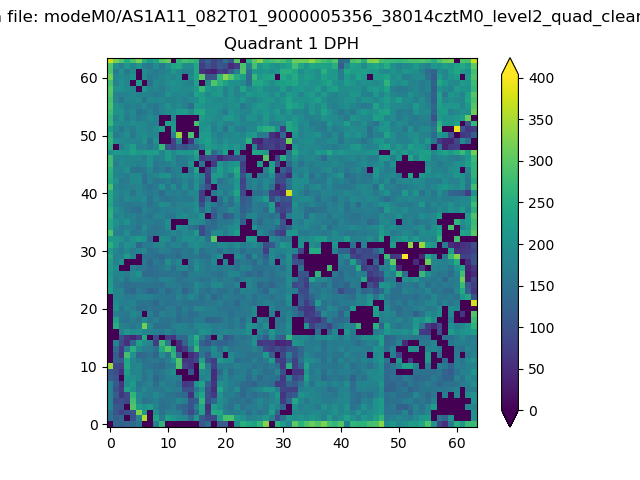 |
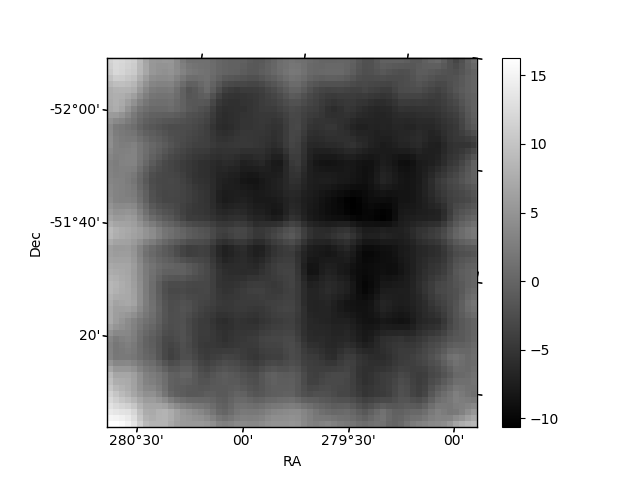
Quadrant B |
|---|---|---|---|
| Quadrant D | 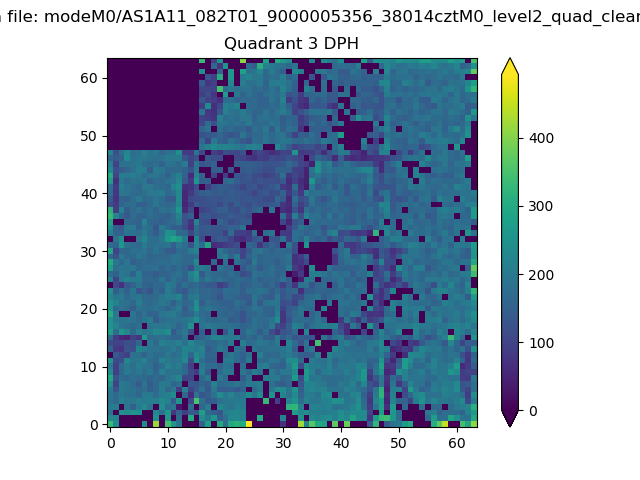 |
 |
Quadrant C |
| Plot type | Count rate plots | Images |
|---|---|---|
| Comparison with Poisson distribution Blue bars denote a histogram of data divided into 1 sec bins. Red curve is a Poisson curve with rate = median count rate of data. |
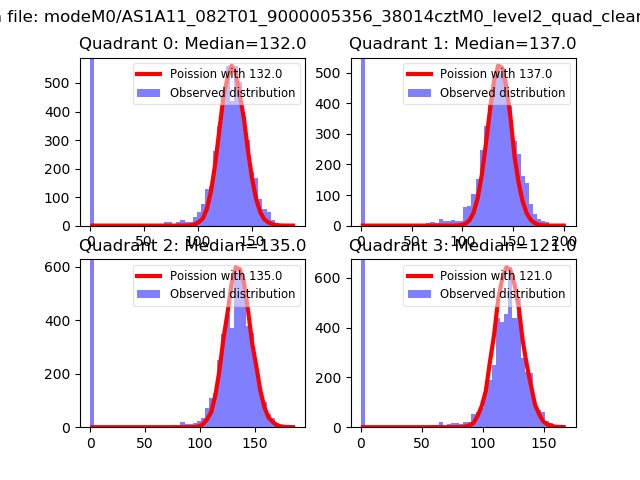 |
 |
| Quadrant-wise count rates Data is divided into 100 sec bins |
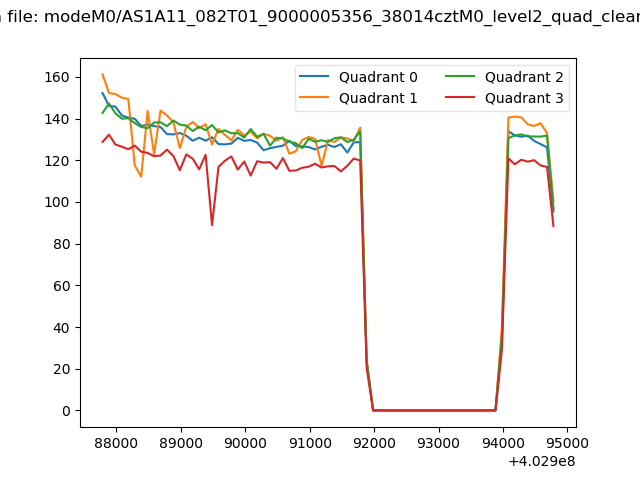 |
|
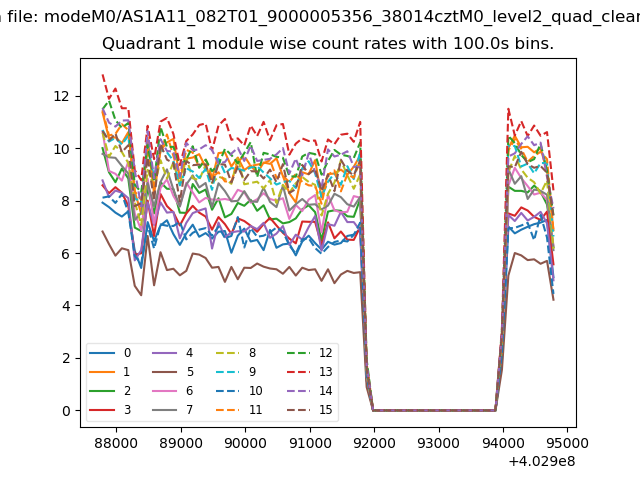
| Module-wise count rates for Quadrant A Data is divided into 100 sec bins |
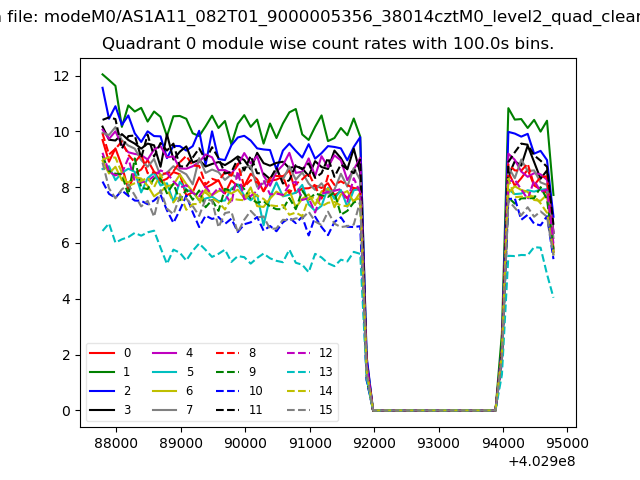 |
 |
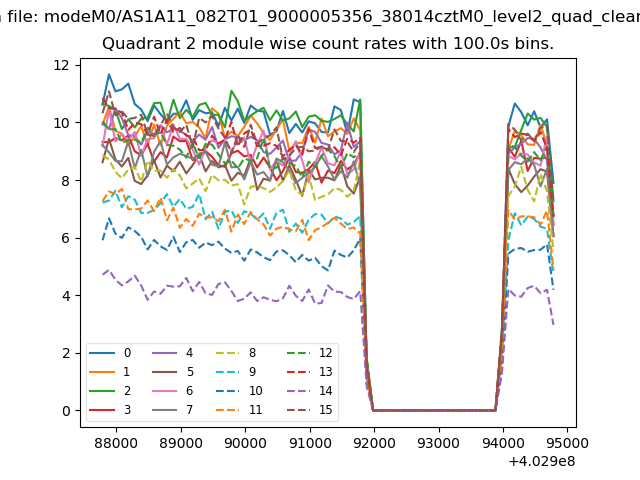
| Module-wise count rates for Quadrant B Data is divided into 100 sec bins |
 |
 |
| Module-wise count rates for Quadrant C Data is divided into 100 sec bins |
 |
 |
| Module-wise count rates for Quadrant D Data is divided into 100 sec bins |
 |
 |
| Parameter | Plot |
|---|---|
| CZT HV Monitor | 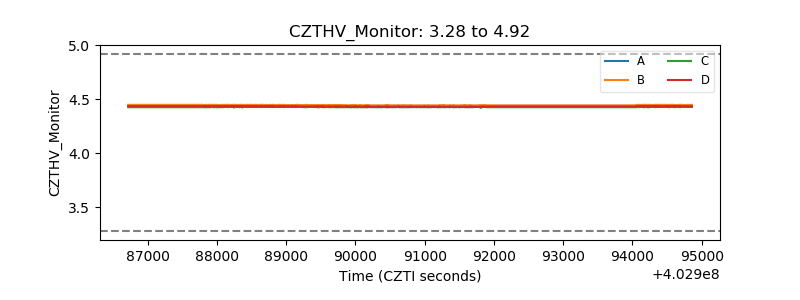 |
| D_VDD | 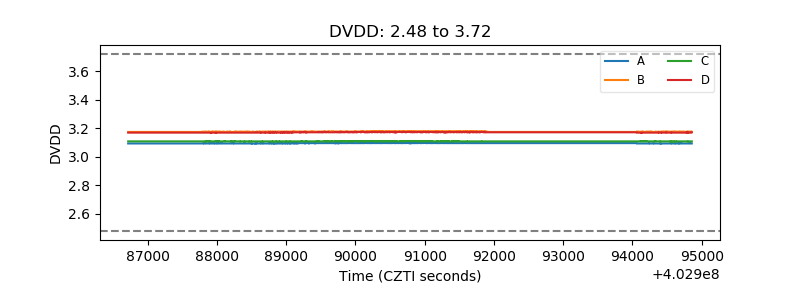 |
| Temperature 1 | 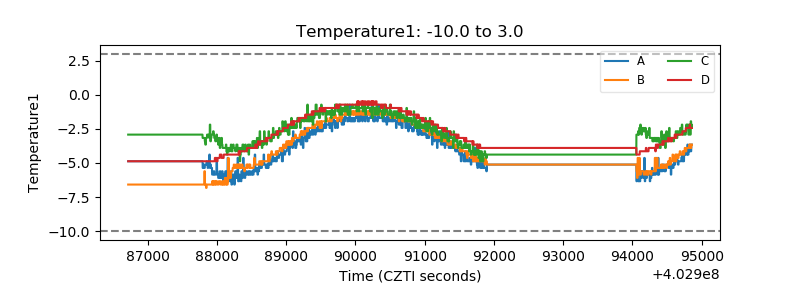 |
| Veto HV Monitor | 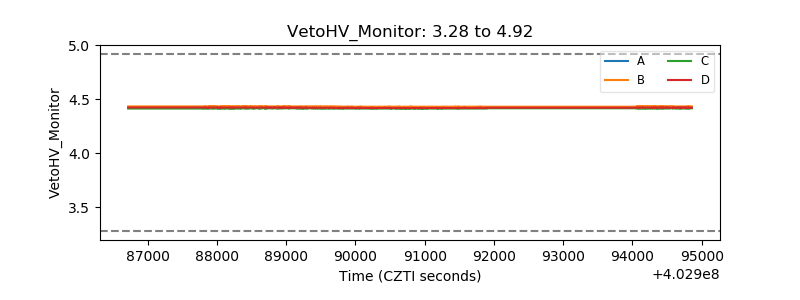 |
| Veto LLD | 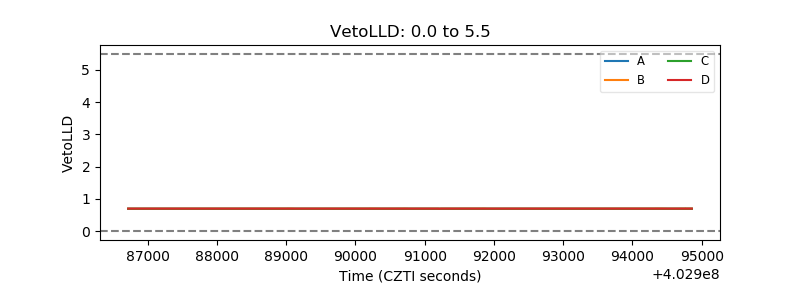 |
| Alpha Counter | 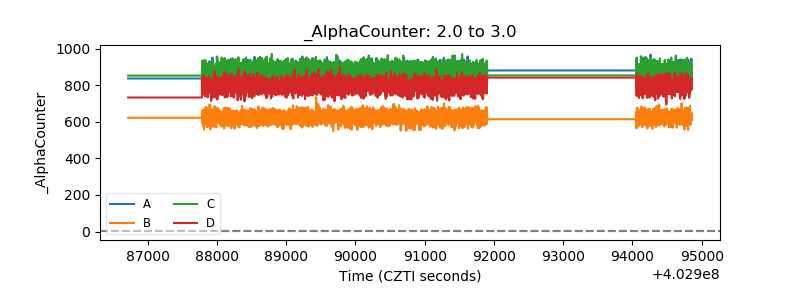 |
| _CPM_Rate | 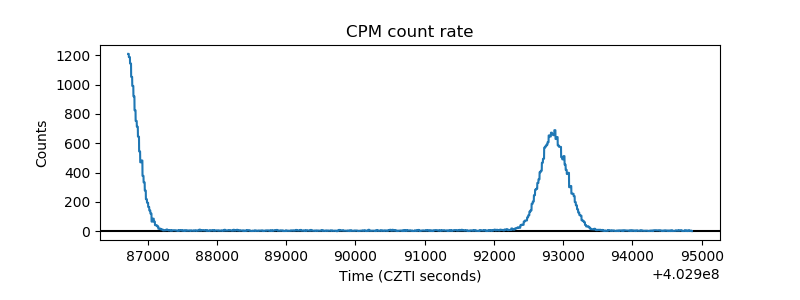 |
| CZT Counter | 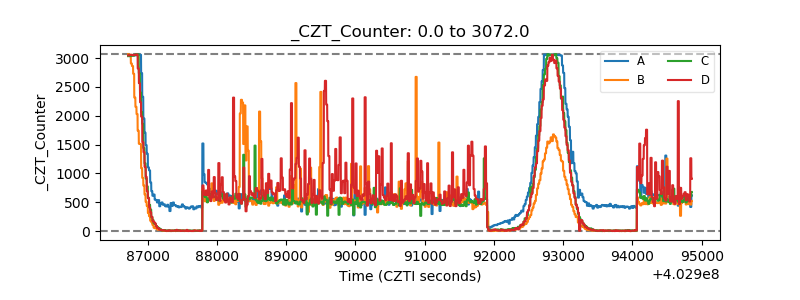 |
| +2.5 Volts monitor | 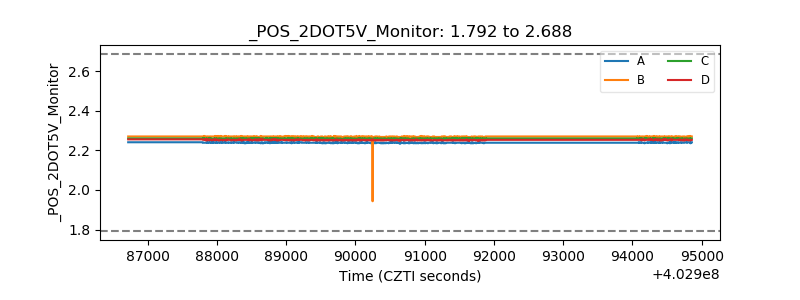 |
| +5 Volts monitor | 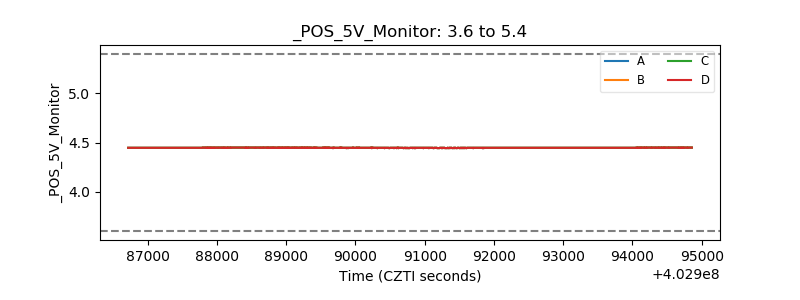 |
| _ROLL_ROT | 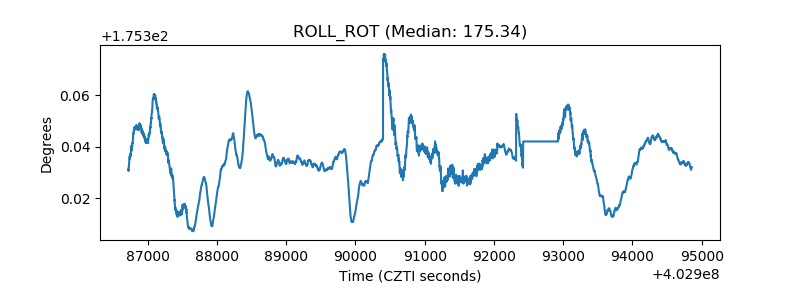 |
| _Roll_DEC | 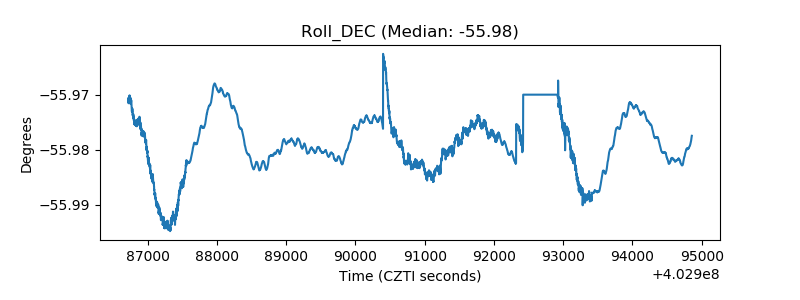 |
| _Roll_RA | 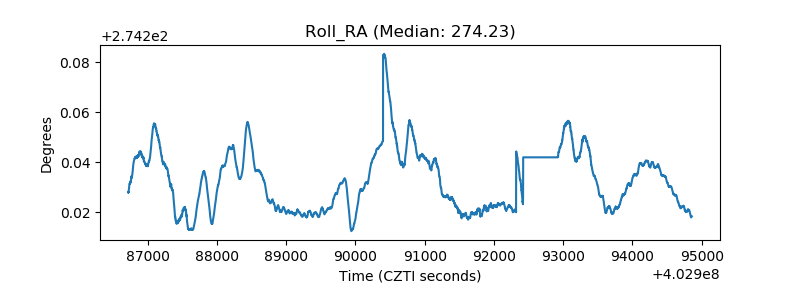 |
| Veto Counter | 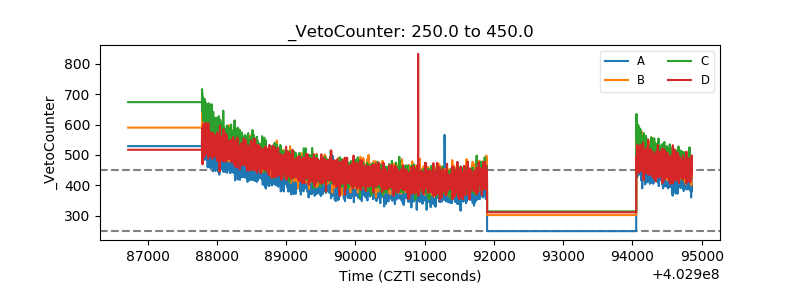 |