| Param | Original file | Final file |
|---|---|---|
| Filename | modeM0/AS1A11_082T01_9000005356_38015cztM0_level2.fits | modeM0/AS1A11_082T01_9000005356_38015cztM0_level2_quad_clean.evt |
| Size (bytes) | 350,259,840 | 90,760,320 |
| Size | 334.0 MB | 86.6 MB |
| Events in quadrant A | 2,750,756 | 616,069 |
| Events in quadrant B | 2,739,089 | 634,406 |
| Events in quadrant C | 2,529,615 | 626,886 |
| Events in quadrant D | 4,558,303 | 522,212 |
| Mode M0 | |||
|---|---|---|---|
| Quadrant | BADHDUFLAG | Total packets | Discarded packets |
| A | 0 | 10998 | 3 |
| B | 0 | 11174 | 2 |
| C | 0 | 10347 | 2 |
| D | 0 | 16816 | 2 |
| Mode SS | |||
|---|---|---|---|
| Quadrant | BADHDUFLAG | Total packets | Discarded packets |
| A | 0 | 100 | 0 |
| B | 0 | 100 | 0 |
| C | 0 | 100 | 0 |
| D | 0 | 100 | 0 |
| Mode M9 | |||
|---|---|---|---|
| Quadrant | BADHDUFLAG | Total packets | Discarded packets |
| A | 0 | 31 | 0 |
| B | 0 | 31 | 0 |
| C | 0 | 31 | 0 |
| D | 0 | 32 | 0 |
| Quadrant | Total seconds | Saturated seconds | Saturation percentage |
|---|---|---|---|
| A | 4978 | 27 | 0.542387% |
| B | 4978 | 66 | 1.325834% |
| C | 4978 | 3 | 0.060265% |
| D | 4978 | 522 | 10.486139% |
Noise dominated data is calculated using 1-second bins in cleaned event files. If a bin has >2000 counts, and if more than 50% of those come from <1% of pixels, then it is considered to be noise-dominated and hence unusable.
| Quadrant | # 1 sec bins | Bins with >0 counts | Bins with >2000 counts | High rate bins dominated by noise | Noise dominated (total time) | Noise dominated (detector-on time) | Marked lightcurve |
|---|---|---|---|---|---|---|---|
| A | 7041 | 4979 | 10 | 10 | 0.14% | 0.20% | 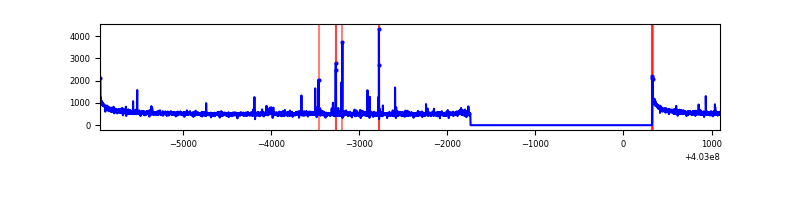 |
| B | 7041 | 4979 | 49 | 49 | 0.70% | 0.98% | 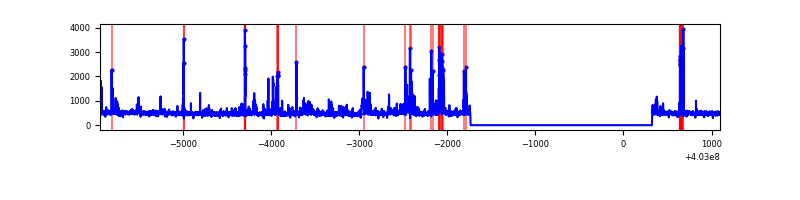 |
| C | 7041 | 4979 | 1 | 1 | 0.01% | 0.02% | 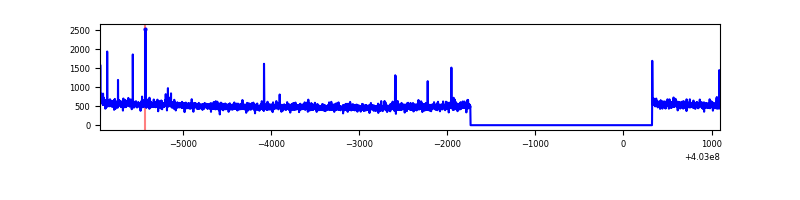 |
| D | 7041 | 4979 | 469 | 469 | 6.66% | 9.42% | 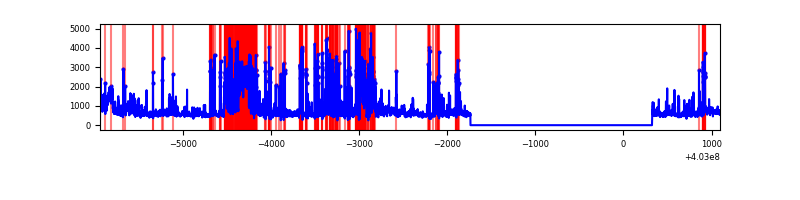 |
Top three noisy pixels from each quadrant. If the there are fewer than three noisy pixels in the level2.evt file, extra rows are filled as -1
| Pixel properties | Quadrant properties | ||||||
|---|---|---|---|---|---|---|---|
| Quadrant | DetID | PixID | Counts | Sigma | Mean | Median | Sigma |
| A | 10 | 83 | 364960 | 3081.75 | 590 | 578 | 118.2 |
| A | 9 | 143 | 61812 | 517.88 | 590 | 578 | 118.2 |
| A | 13 | 6 | 19843 | 162.93 | 590 | 578 | 118.2 |
| B | 5 | 255 | 104173 | 928.74 | 584 | 570 | 111.6 |
| B | 4 | 81 | 99454 | 886.44 | 584 | 570 | 111.6 |
| B | 5 | 200 | 75092 | 668.05 | 584 | 570 | 111.6 |
| C | 15 | 214 | 214353 | 1596.52 | 578 | 583 | 133.9 |
| C | 14 | 254 | 29318 | 214.6 | 578 | 583 | 133.9 |
| C | 0 | 10 | 10603 | 74.83 | 578 | 583 | 133.9 |
| D | 1 | 52 | 941334 | 6981.63 | 554 | 539 | 134.8 |
| D | 12 | 227 | 464840 | 3445.57 | 554 | 539 | 134.8 |
| D | 12 | 233 | 222251 | 1645.32 | 554 | 539 | 134.8 |
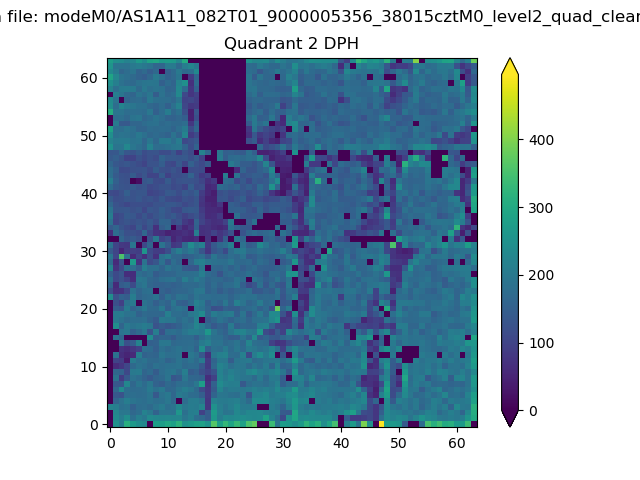
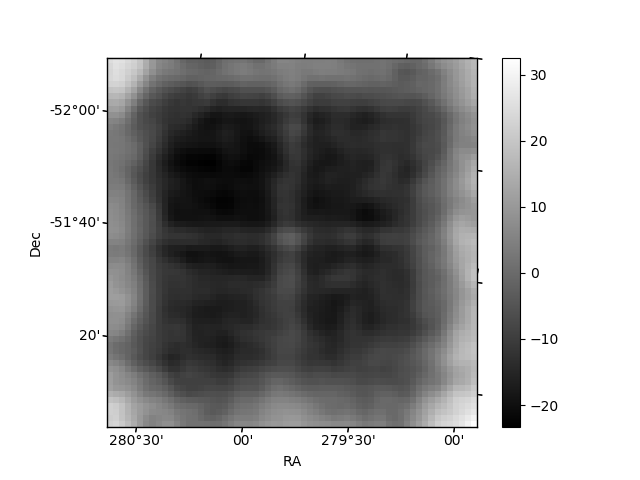
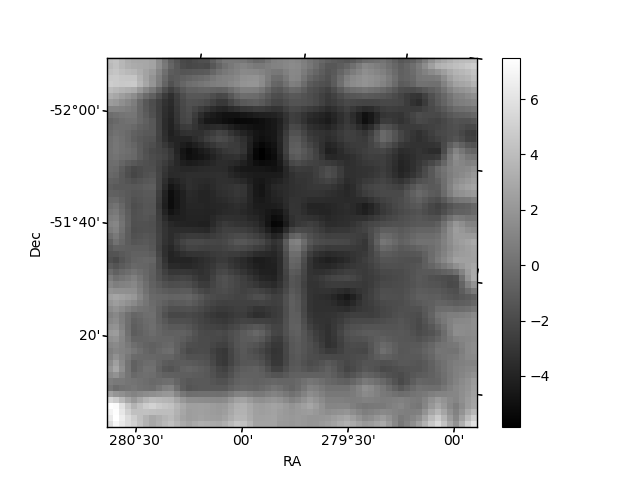
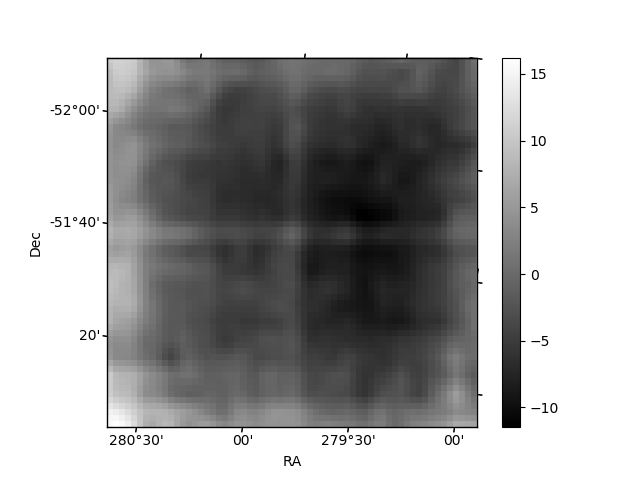
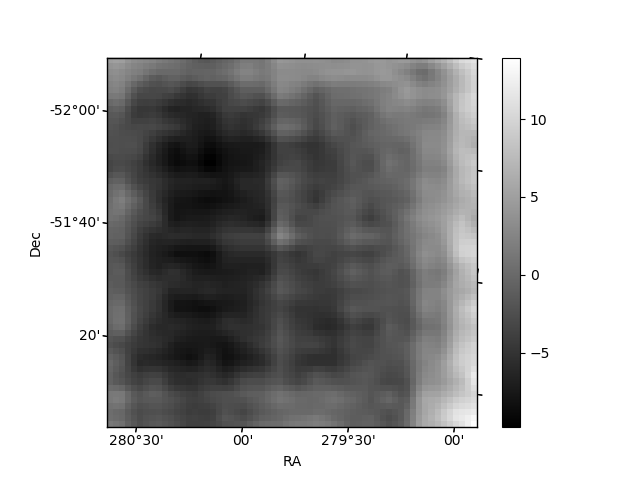
Histogram calculated using DETX and DETY for each event in the final _common_clean file
| Quadrant A | 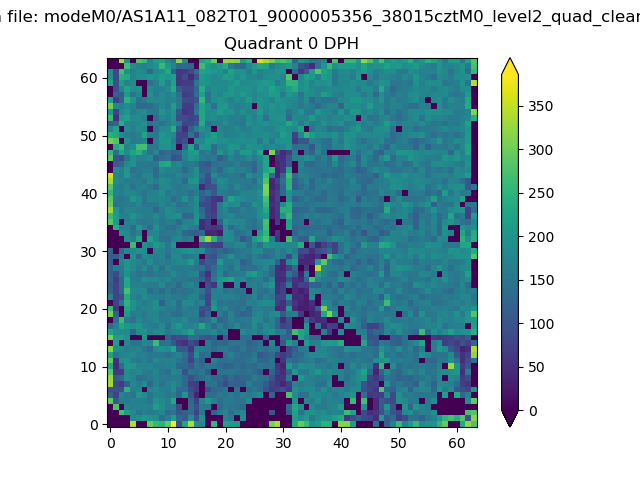 |
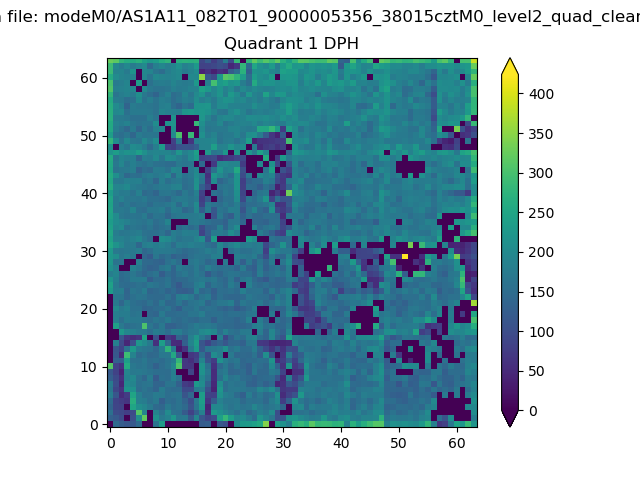 |
Quadrant B |
|---|---|---|---|
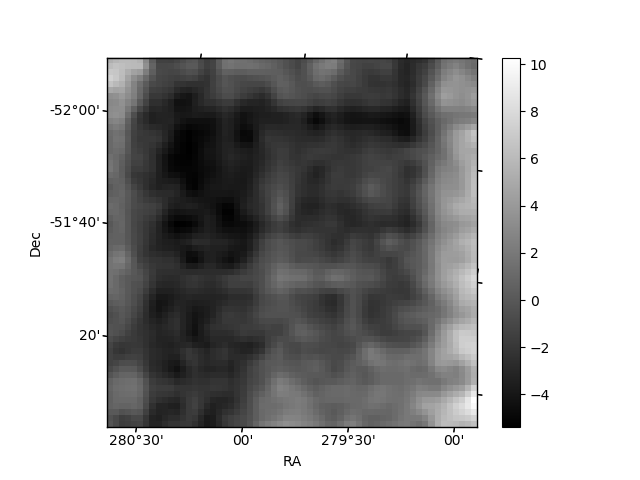
| Quadrant D | 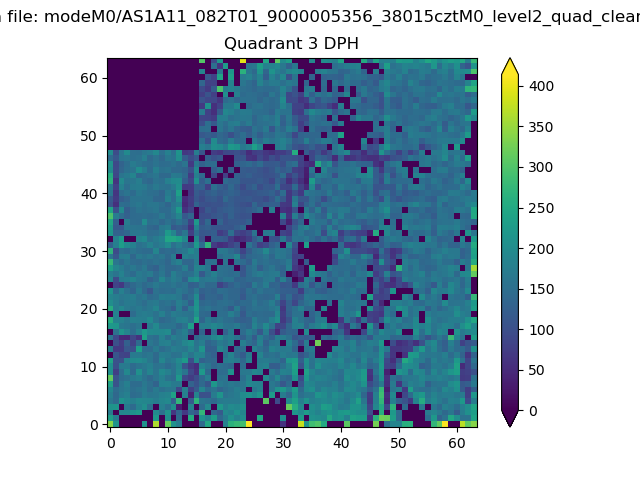 |
 |
Quadrant C |
| Plot type | Count rate plots | Images |
|---|---|---|
| Comparison with Poisson distribution Blue bars denote a histogram of data divided into 1 sec bins. Red curve is a Poisson curve with rate = median count rate of data. |
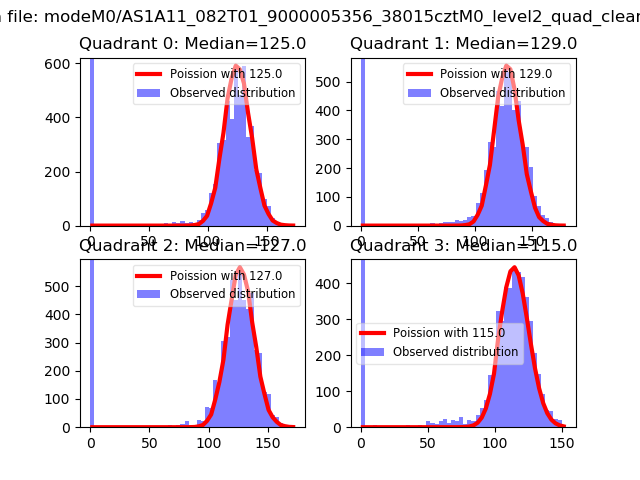 |
 |
| Quadrant-wise count rates Data is divided into 100 sec bins |
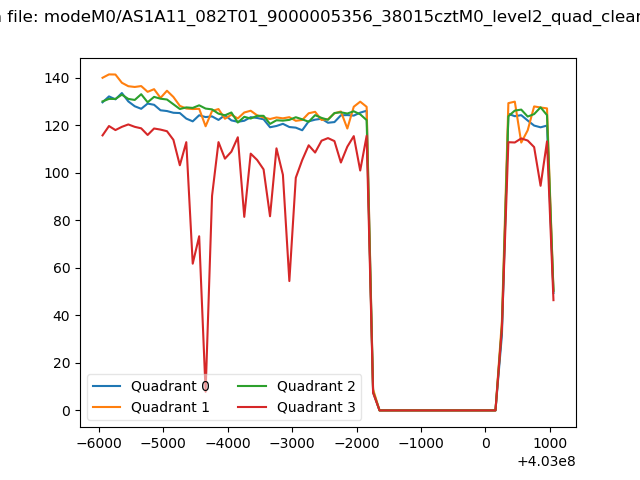 |
|
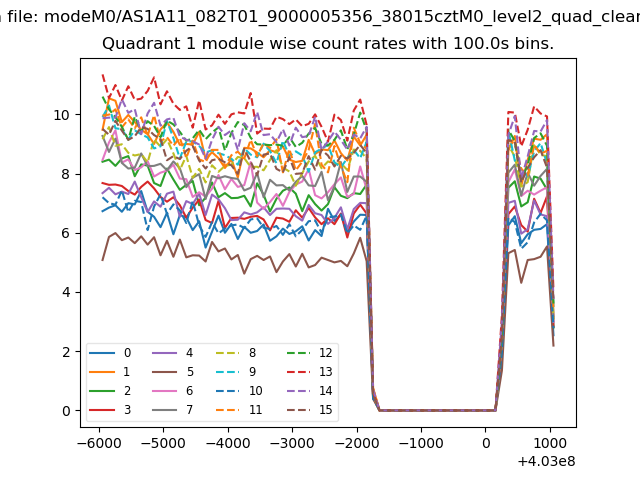
| Module-wise count rates for Quadrant A Data is divided into 100 sec bins |
 |
 |
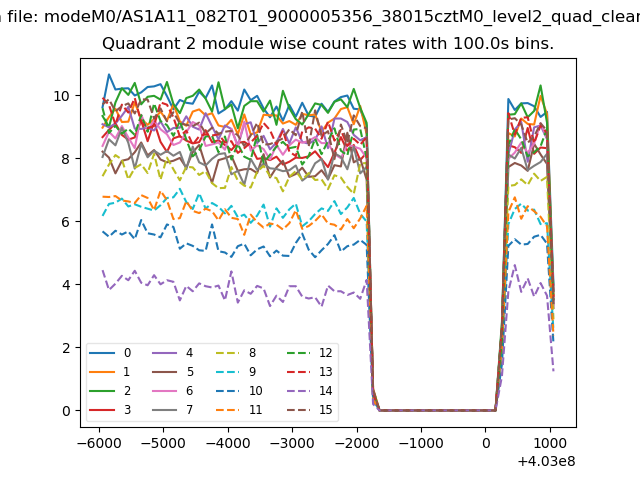
| Module-wise count rates for Quadrant B Data is divided into 100 sec bins |
 |
 |
| Module-wise count rates for Quadrant C Data is divided into 100 sec bins |
 |
 |
| Module-wise count rates for Quadrant D Data is divided into 100 sec bins |
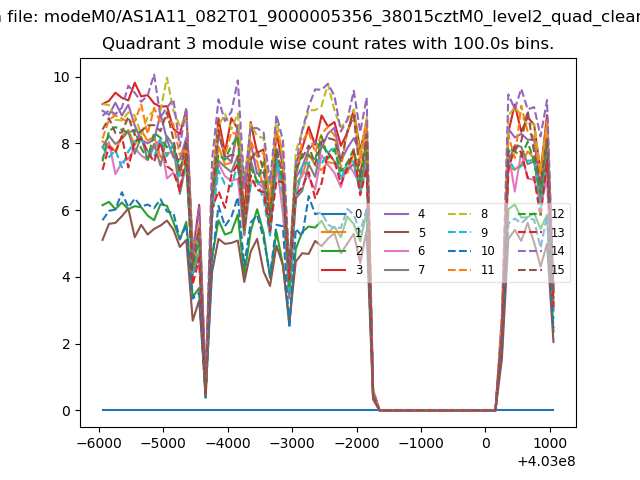 |
 |
| Parameter | Plot |
|---|---|
| CZT HV Monitor | 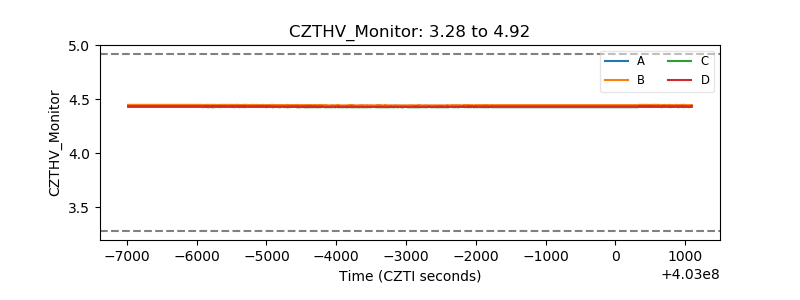 |
| D_VDD | 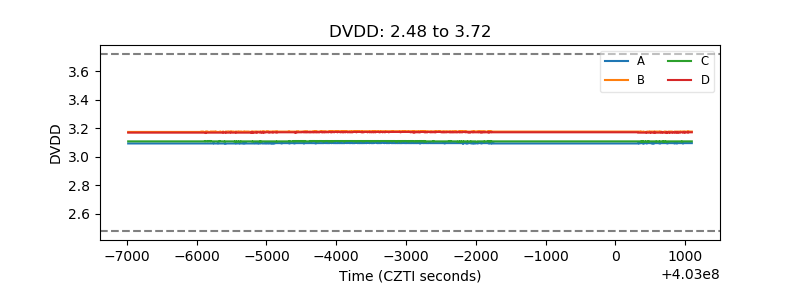 |
| Temperature 1 | 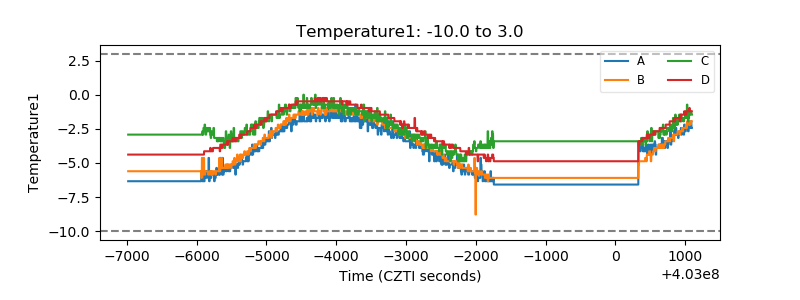 |
| Veto HV Monitor | 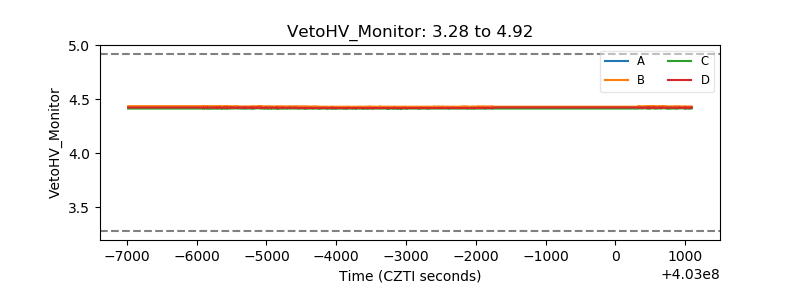 |
| Veto LLD | 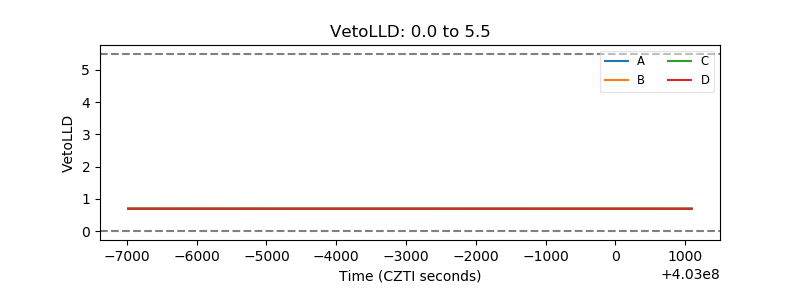 |
| Alpha Counter | 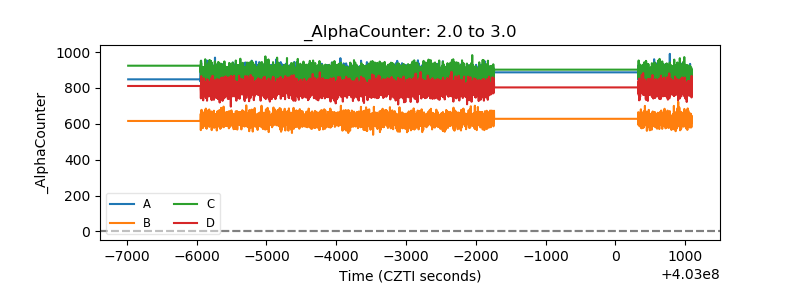 |
| _CPM_Rate | 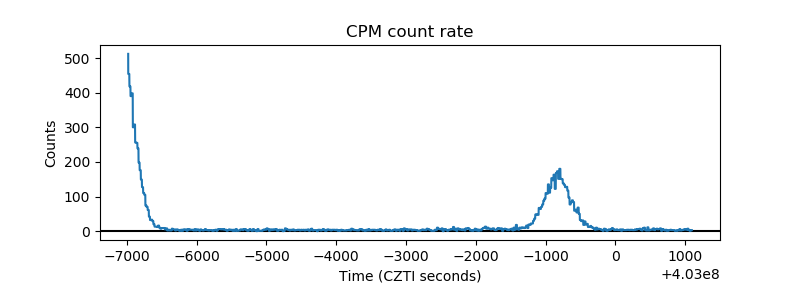 |
| CZT Counter | 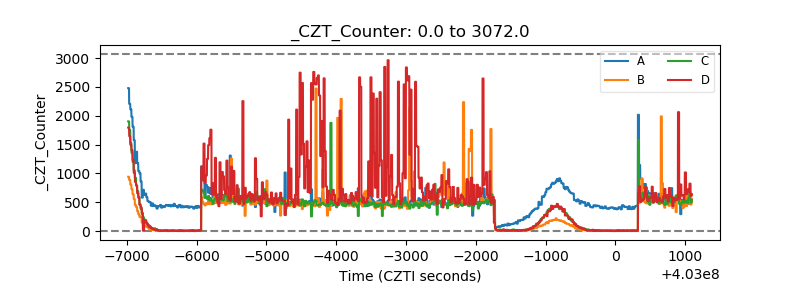 |
| +2.5 Volts monitor | 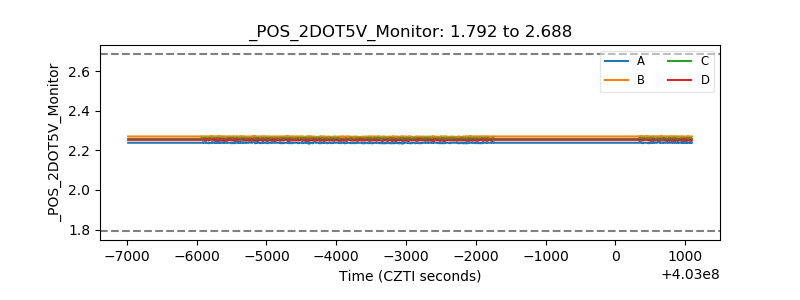 |
| +5 Volts monitor | 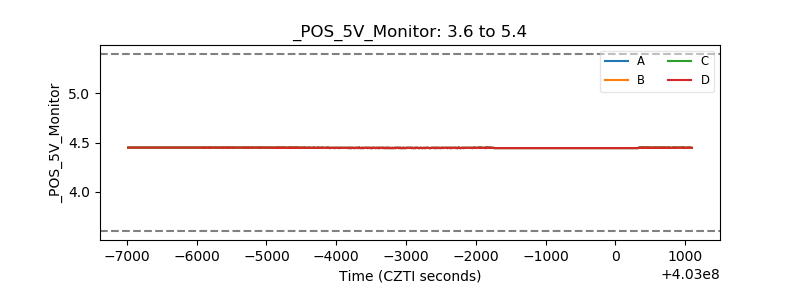 |
| _ROLL_ROT | 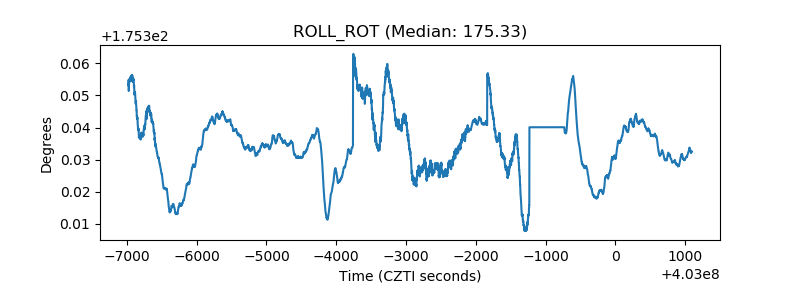 |
| _Roll_DEC | 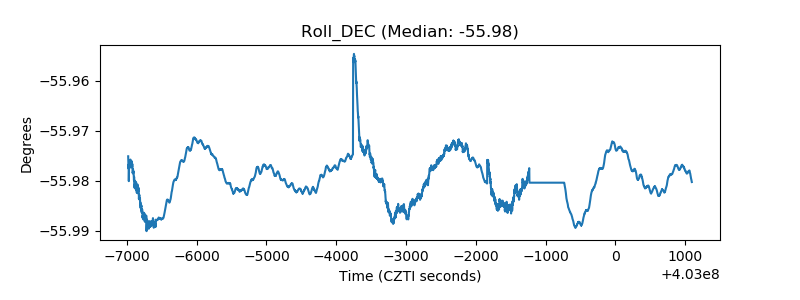 |
| _Roll_RA | 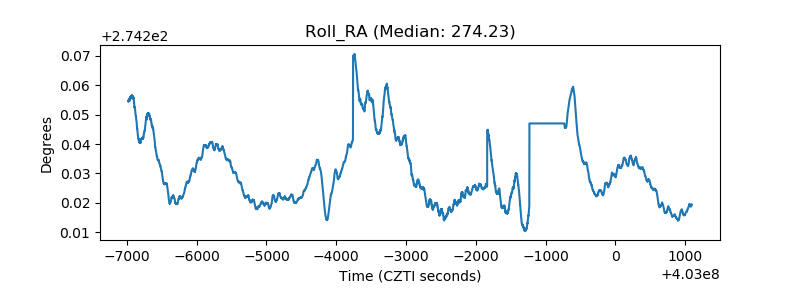 |
| Veto Counter | 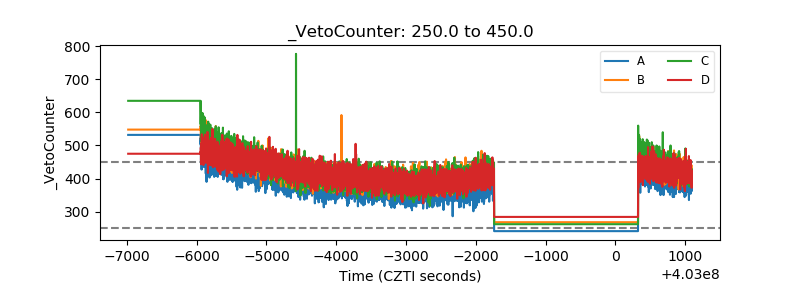 |