| Param | Original file | Final file |
|---|---|---|
| Filename | modeM0/AS1A11_082T01_9000005356_38016cztM0_level2.fits | modeM0/AS1A11_082T01_9000005356_38016cztM0_level2_quad_clean.evt |
| Size (bytes) | 366,825,600 | 89,881,920 |
| Size | 349.8 MB | 85.7 MB |
| Events in quadrant A | 2,762,285 | 612,651 |
| Events in quadrant B | 3,423,807 | 612,174 |
| Events in quadrant C | 2,612,895 | 622,704 |
| Events in quadrant D | 4,374,968 | 509,941 |
| Mode M0 | |||
|---|---|---|---|
| Quadrant | BADHDUFLAG | Total packets | Discarded packets |
| A | 0 | 11271 | 3 |
| B | 0 | 13495 | 2 |
| C | 0 | 10792 | 2 |
| D | 0 | 16378 | 2 |
| Mode SS | |||
|---|---|---|---|
| Quadrant | BADHDUFLAG | Total packets | Discarded packets |
| A | 0 | 106 | 0 |
| B | 0 | 106 | 0 |
| C | 0 | 106 | 0 |
| D | 0 | 106 | 0 |
| Mode M9 | |||
|---|---|---|---|
| Quadrant | BADHDUFLAG | Total packets | Discarded packets |
| A | 0 | 28 | 0 |
| B | 0 | 28 | 0 |
| C | 0 | 28 | 0 |
| D | 0 | 29 | 0 |
| Quadrant | Total seconds | Saturated seconds | Saturation percentage |
|---|---|---|---|
| A | 5197 | 12 | 0.230902% |
| B | 5197 | 235 | 4.521840% |
| C | 5197 | 11 | 0.211661% |
| D | 5197 | 594 | 11.429671% |
Noise dominated data is calculated using 1-second bins in cleaned event files. If a bin has >2000 counts, and if more than 50% of those come from <1% of pixels, then it is considered to be noise-dominated and hence unusable.
| Quadrant | # 1 sec bins | Bins with >0 counts | Bins with >2000 counts | High rate bins dominated by noise | Noise dominated (total time) | Noise dominated (detector-on time) | Marked lightcurve |
|---|---|---|---|---|---|---|---|
| A | 7019 | 5198 | 5 | 5 | 0.07% | 0.10% | 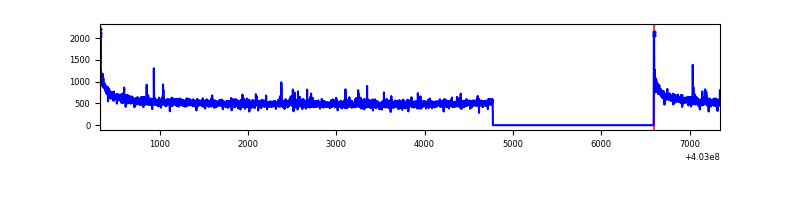 |
| B | 7019 | 5198 | 171 | 171 | 2.44% | 3.29% | 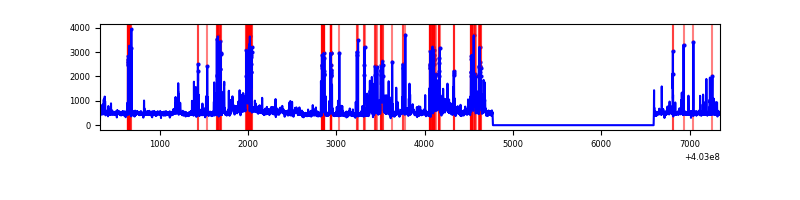 |
| C | 7019 | 5198 | 6 | 6 | 0.09% | 0.12% | 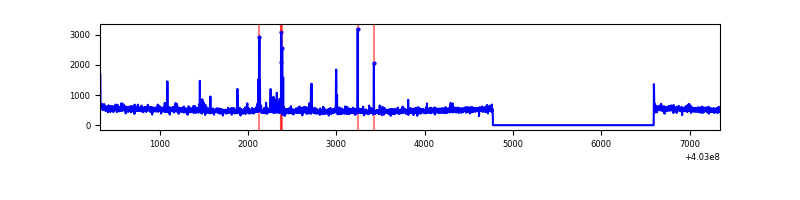 |
| D | 7019 | 5198 | 529 | 529 | 7.54% | 10.18% | 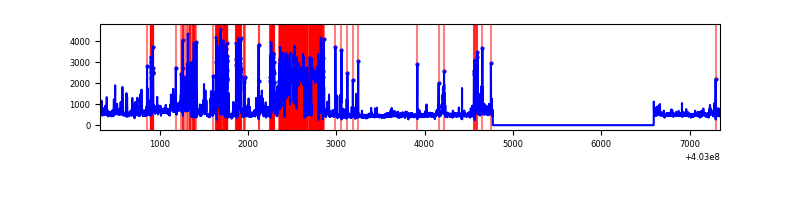 |
Top three noisy pixels from each quadrant. If the there are fewer than three noisy pixels in the level2.evt file, extra rows are filled as -1
| Pixel properties | Quadrant properties | ||||||
|---|---|---|---|---|---|---|---|
| Quadrant | DetID | PixID | Counts | Sigma | Mean | Median | Sigma |
| A | 10 | 83 | 392827 | 3235.19 | 597 | 587 | 121.2 |
| A | 12 | 189 | 15207 | 120.59 | 597 | 587 | 121.2 |
| A | 13 | 6 | 14954 | 118.5 | 597 | 587 | 121.2 |
| B | 4 | 171 | 404469 | 3599.12 | 586 | 572 | 112.2 |
| B | 5 | 255 | 197163 | 1751.82 | 586 | 572 | 112.2 |
| B | 5 | 184 | 185745 | 1650.07 | 586 | 572 | 112.2 |
| C | 15 | 214 | 223752 | 1655.08 | 584 | 589 | 134.8 |
| C | 1 | 23 | 36496 | 266.3 | 584 | 589 | 134.8 |
| C | 15 | 159 | 31591 | 229.93 | 584 | 589 | 134.8 |
| D | 10 | 199 | 948665 | 7055.28 | 548 | 533 | 134.4 |
| D | 1 | 52 | 837631 | 6229.05 | 548 | 533 | 134.4 |
| D | 13 | 171 | 102551 | 759.14 | 548 | 533 | 134.4 |
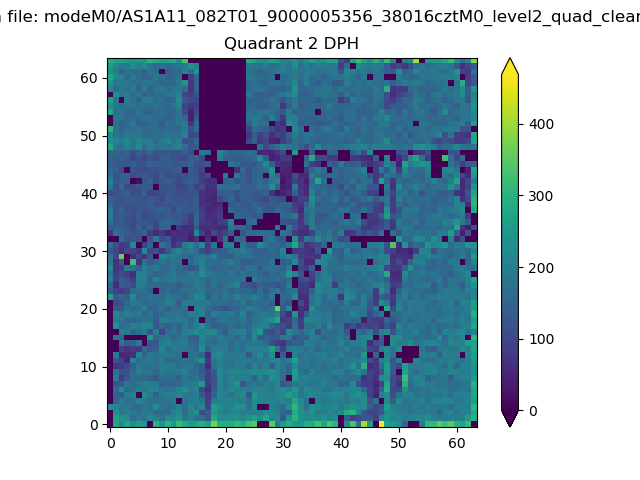
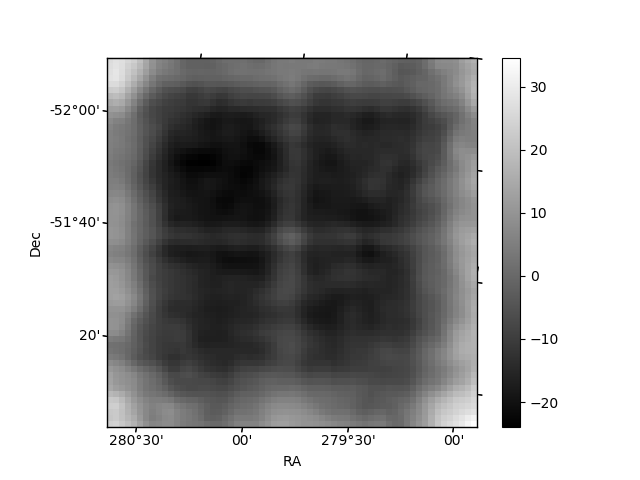
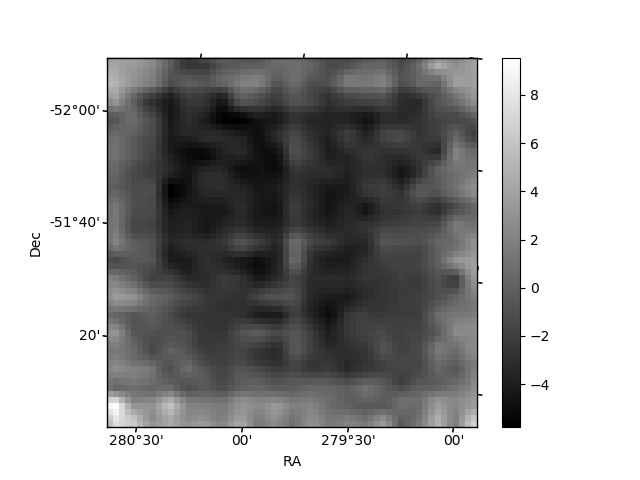
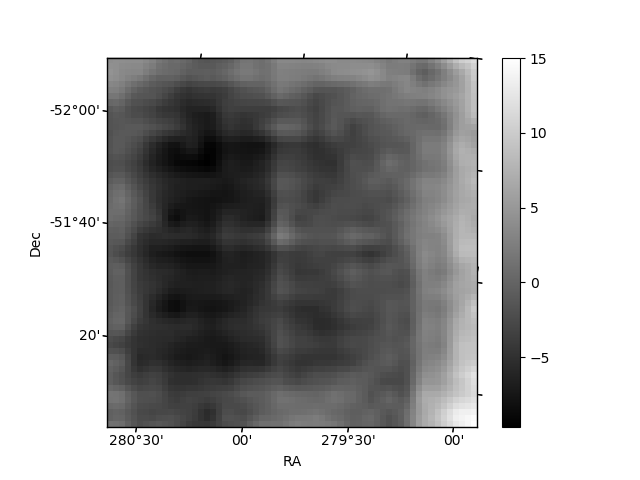
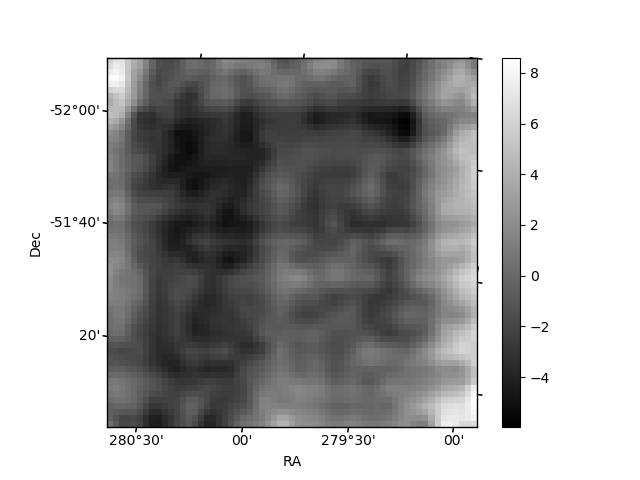
Histogram calculated using DETX and DETY for each event in the final _common_clean file
| Quadrant A | 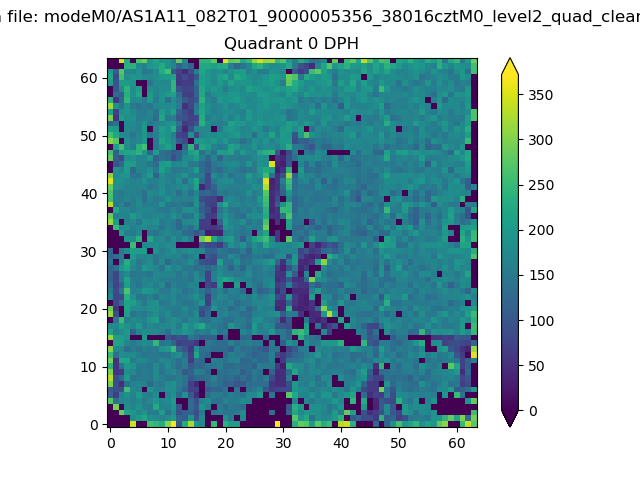 |
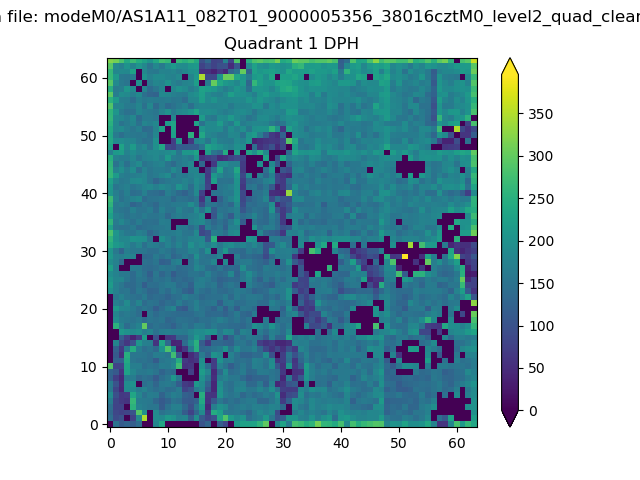 |
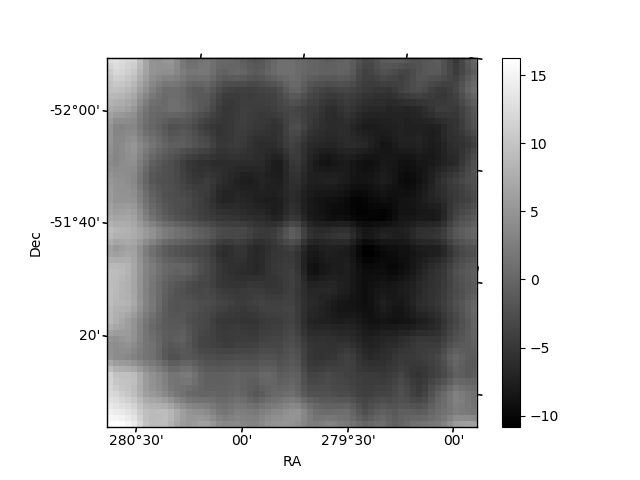
Quadrant B |
|---|---|---|---|
| Quadrant D | 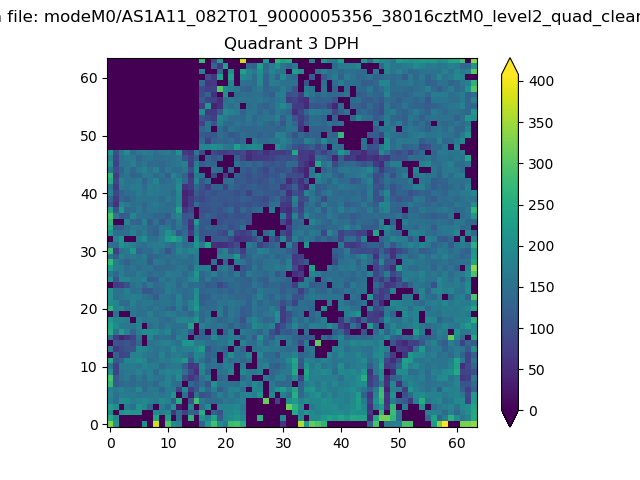 |
 |
Quadrant C |
| Plot type | Count rate plots | Images |
|---|---|---|
| Comparison with Poisson distribution Blue bars denote a histogram of data divided into 1 sec bins. Red curve is a Poisson curve with rate = median count rate of data. |
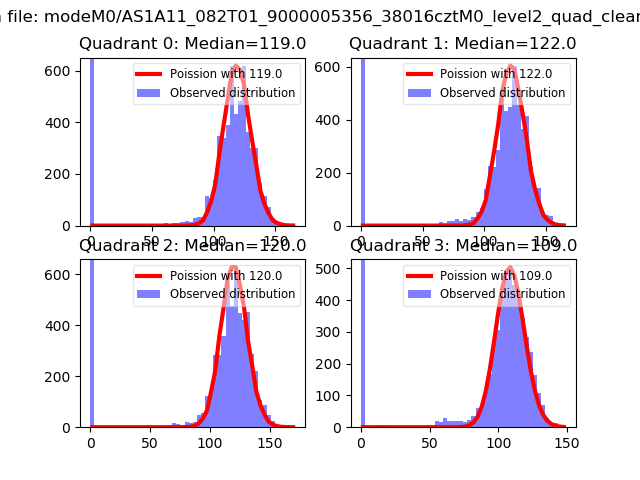 |
 |
| Quadrant-wise count rates Data is divided into 100 sec bins |
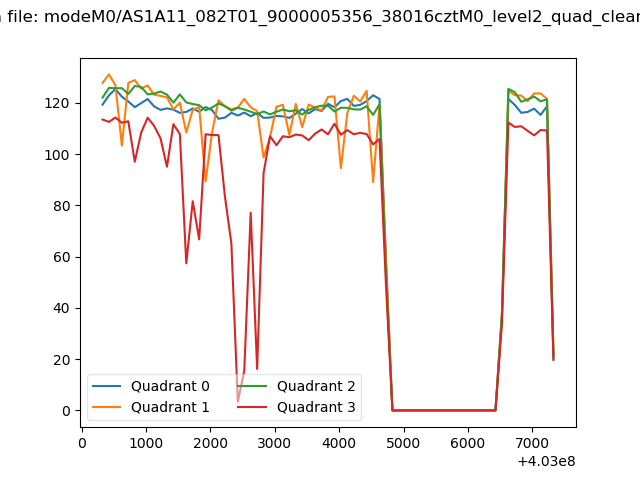 |
|
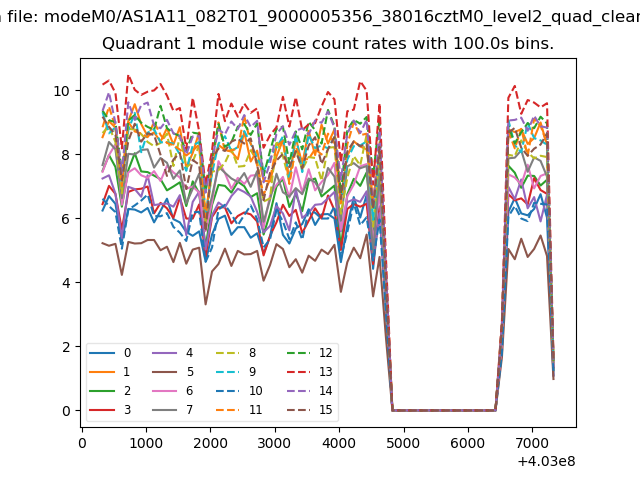
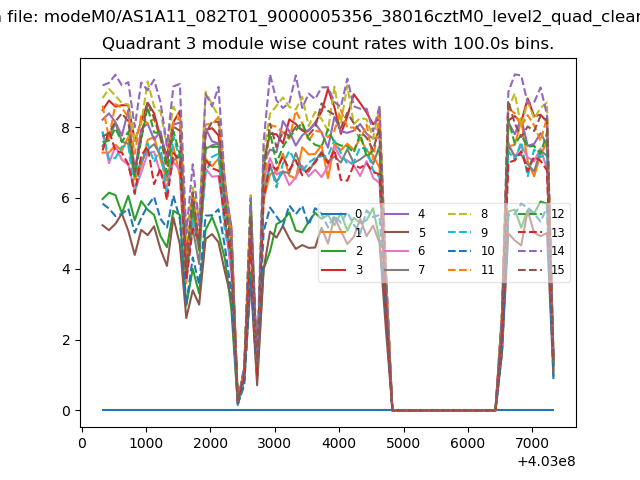
| Module-wise count rates for Quadrant A Data is divided into 100 sec bins |
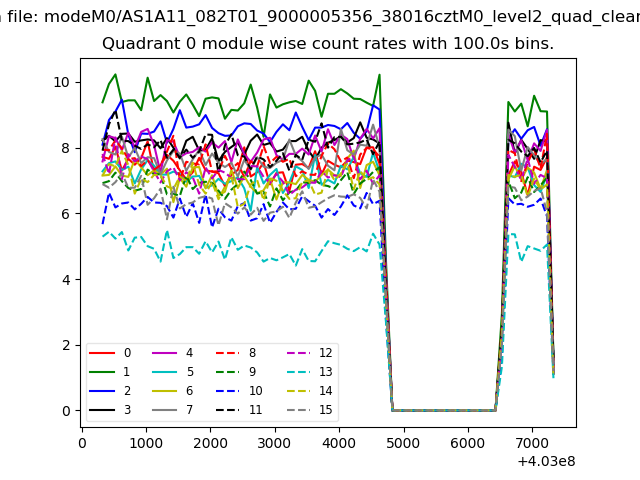 |
 |
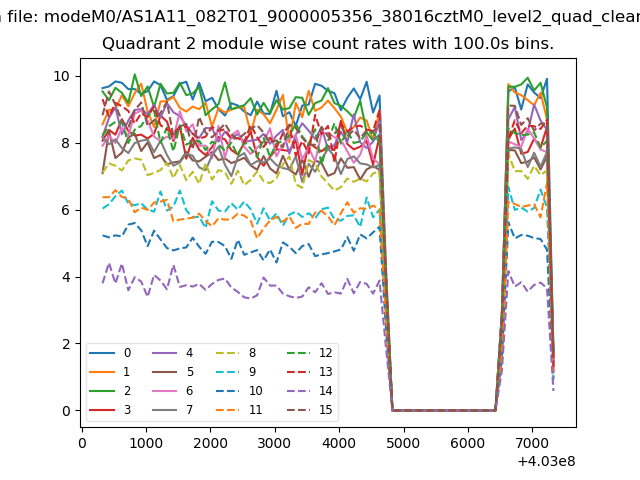
| Module-wise count rates for Quadrant B Data is divided into 100 sec bins |
 |
 |
| Module-wise count rates for Quadrant C Data is divided into 100 sec bins |
 |
 |
| Module-wise count rates for Quadrant D Data is divided into 100 sec bins |
 |
 |
| Parameter | Plot |
|---|---|
| CZT HV Monitor |  |
| D_VDD | 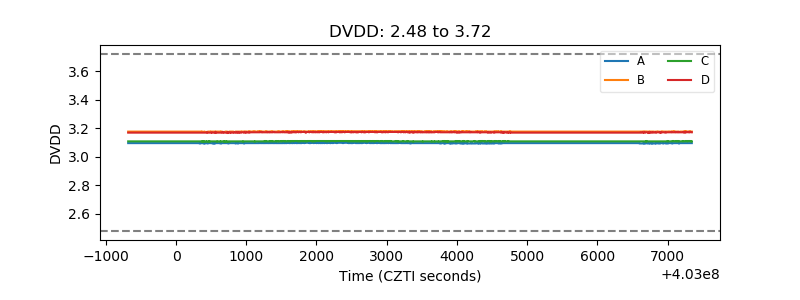 |
| Temperature 1 | 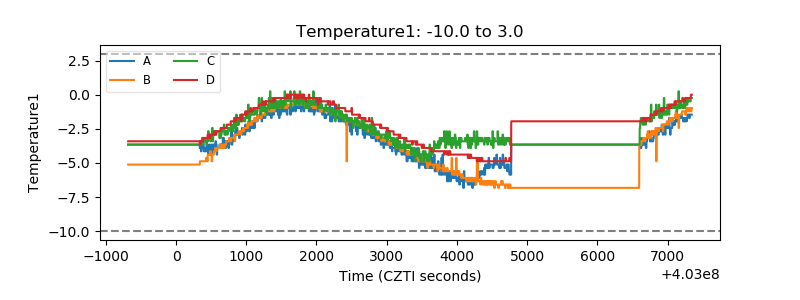 |
| Veto HV Monitor | 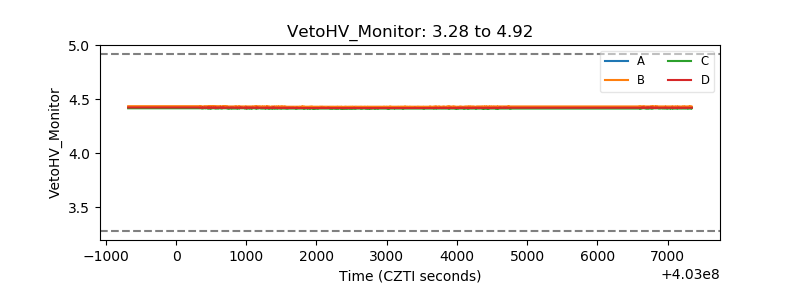 |
| Veto LLD | 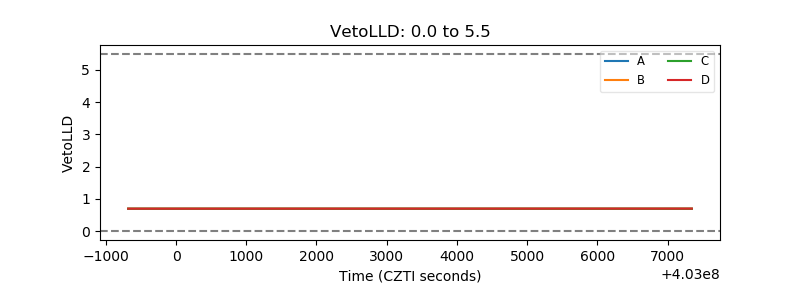 |
| Alpha Counter | 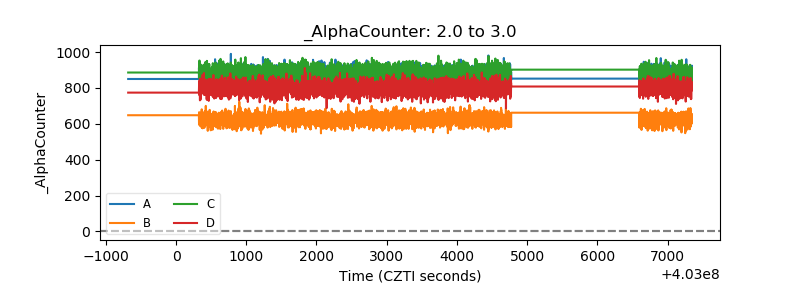 |
| _CPM_Rate | 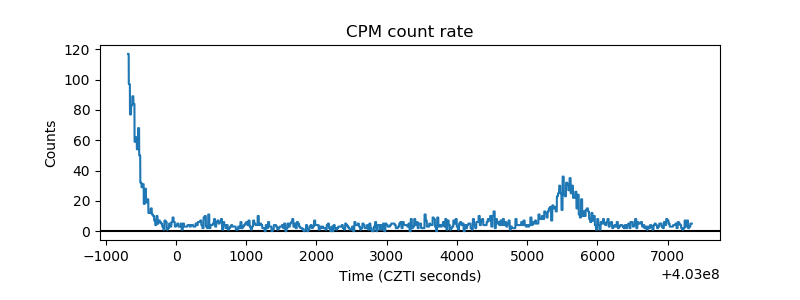 |
| CZT Counter | 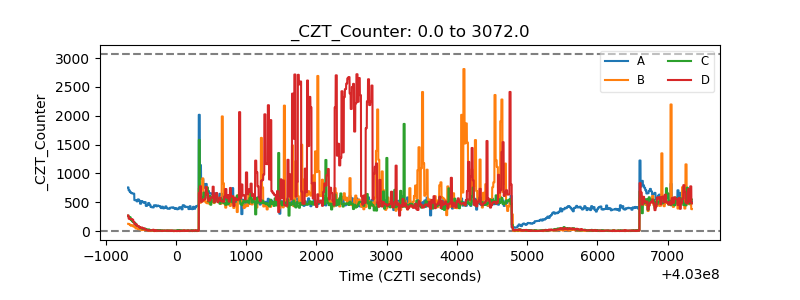 |
| +2.5 Volts monitor | 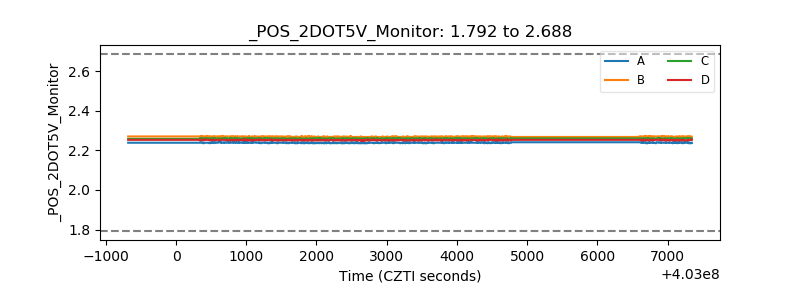 |
| +5 Volts monitor | 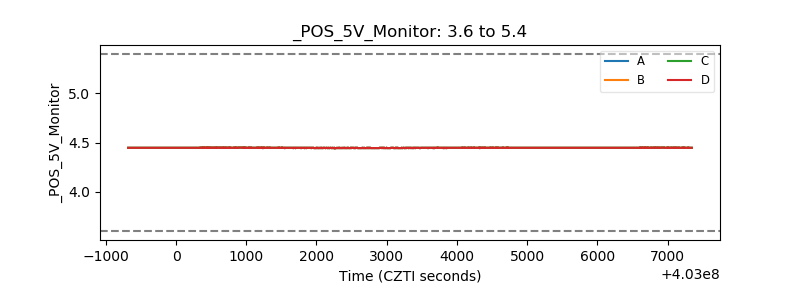 |
| _ROLL_ROT | 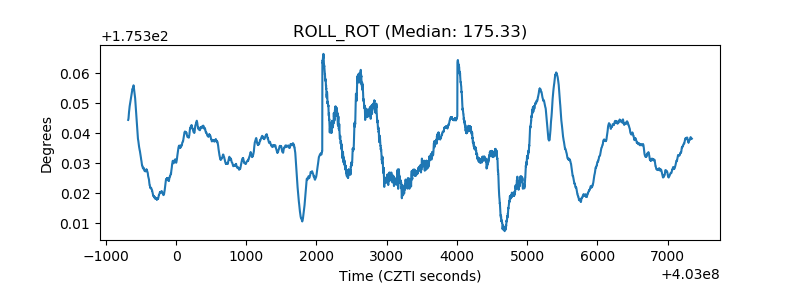 |
| _Roll_DEC | 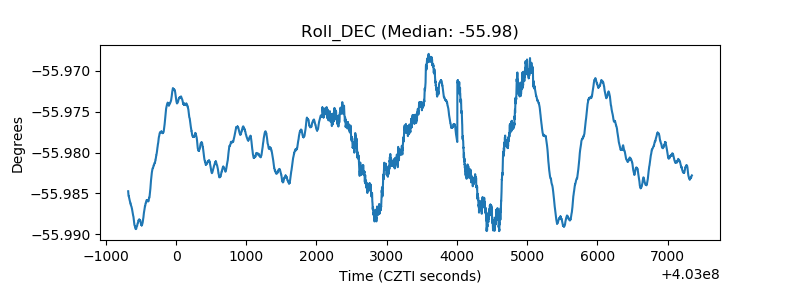 |
| _Roll_RA | 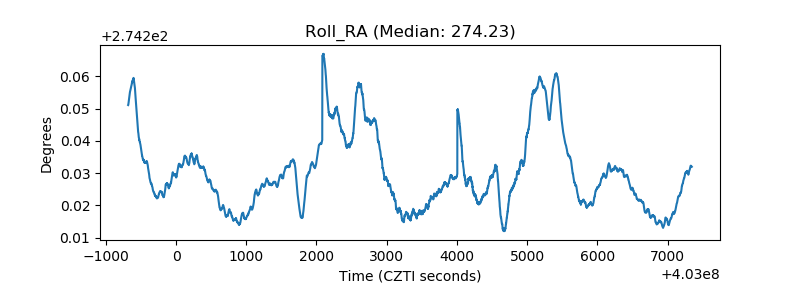 |
| Veto Counter | 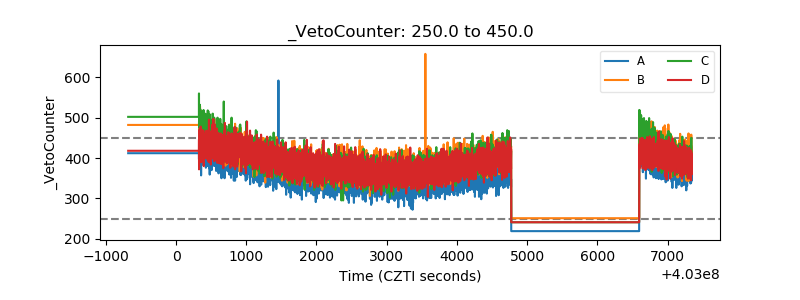 |