| Param | Original file | Final file |
|---|---|---|
| Filename | modeM0/AS1A11_082T01_9000005356_38017cztM0_level2.fits | modeM0/AS1A11_082T01_9000005356_38017cztM0_level2_quad_clean.evt |
| Size (bytes) | 338,204,160 | 96,595,200 |
| Size | 322.5 MB | 92.1 MB |
| Events in quadrant A | 2,947,227 | 645,323 |
| Events in quadrant B | 3,174,769 | 655,051 |
| Events in quadrant C | 2,776,678 | 647,825 |
| Events in quadrant D | 3,186,594 | 586,778 |
| Mode M0 | |||
|---|---|---|---|
| Quadrant | BADHDUFLAG | Total packets | Discarded packets |
| A | 0 | 12098 | 3 |
| B | 0 | 12954 | 2 |
| C | 0 | 11537 | 2 |
| D | 0 | 13066 | 2 |
| Mode SS | |||
|---|---|---|---|
| Quadrant | BADHDUFLAG | Total packets | Discarded packets |
| A | 0 | 114 | 0 |
| B | 0 | 114 | 0 |
| C | 0 | 114 | 0 |
| D | 0 | 114 | 0 |
| Mode M9 | |||
|---|---|---|---|
| Quadrant | BADHDUFLAG | Total packets | Discarded packets |
| A | 0 | 19 | 0 |
| B | 0 | 19 | 0 |
| C | 0 | 19 | 0 |
| D | 0 | 20 | 0 |
| Quadrant | Total seconds | Saturated seconds | Saturation percentage |
|---|---|---|---|
| A | 5571 | 18 | 0.323102% |
| B | 5571 | 107 | 1.920661% |
| C | 5571 | 14 | 0.251301% |
| D | 5571 | 81 | 1.453958% |
Noise dominated data is calculated using 1-second bins in cleaned event files. If a bin has >2000 counts, and if more than 50% of those come from <1% of pixels, then it is considered to be noise-dominated and hence unusable.
| Quadrant | # 1 sec bins | Bins with >0 counts | Bins with >2000 counts | High rate bins dominated by noise | Noise dominated (total time) | Noise dominated (detector-on time) | Marked lightcurve |
|---|---|---|---|---|---|---|---|
| A | 7064 | 5572 | 6 | 6 | 0.08% | 0.11% | 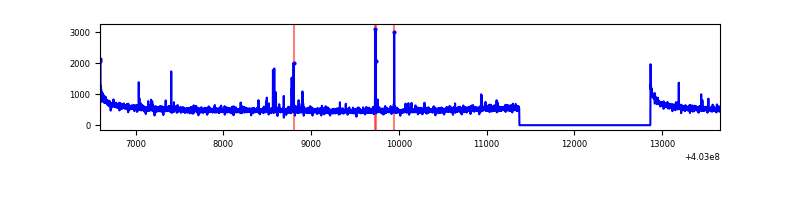 |
| B | 7064 | 5572 | 69 | 69 | 0.98% | 1.24% | 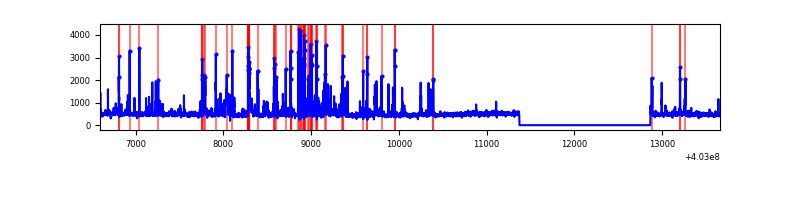 |
| C | 7064 | 5572 | 4 | 4 | 0.06% | 0.07% | 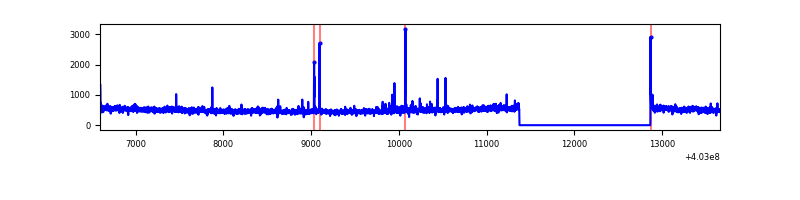 |
| D | 7064 | 5572 | 67 | 67 | 0.95% | 1.20% | 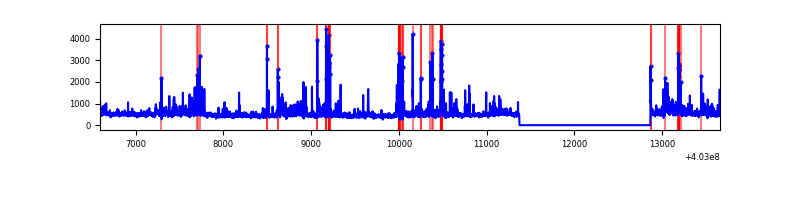 |
Top three noisy pixels from each quadrant. If the there are fewer than three noisy pixels in the level2.evt file, extra rows are filled as -1
| Pixel properties | Quadrant properties | ||||||
|---|---|---|---|---|---|---|---|
| Quadrant | DetID | PixID | Counts | Sigma | Mean | Median | Sigma |
| A | 10 | 83 | 403231 | 3152.6 | 634 | 619 | 127.7 |
| A | 9 | 143 | 43592 | 336.49 | 634 | 619 | 127.7 |
| A | 15 | 222 | 20767 | 157.76 | 634 | 619 | 127.7 |
| B | 5 | 255 | 299054 | 2490.02 | 629 | 611 | 119.9 |
| B | 4 | 171 | 151825 | 1261.64 | 629 | 611 | 119.9 |
| B | 5 | 184 | 72945 | 603.51 | 629 | 611 | 119.9 |
| C | 15 | 214 | 242435 | 1680.06 | 620 | 624 | 143.9 |
| C | 3 | 233 | 34947 | 238.47 | 620 | 624 | 143.9 |
| C | 14 | 254 | 23474 | 158.76 | 620 | 624 | 143.9 |
| D | 1 | 52 | 213506 | 1407.59 | 615 | 600 | 151.3 |
| D | 13 | 249 | 93956 | 617.21 | 615 | 600 | 151.3 |
| D | 7 | 223 | 87375 | 573.7 | 615 | 600 | 151.3 |
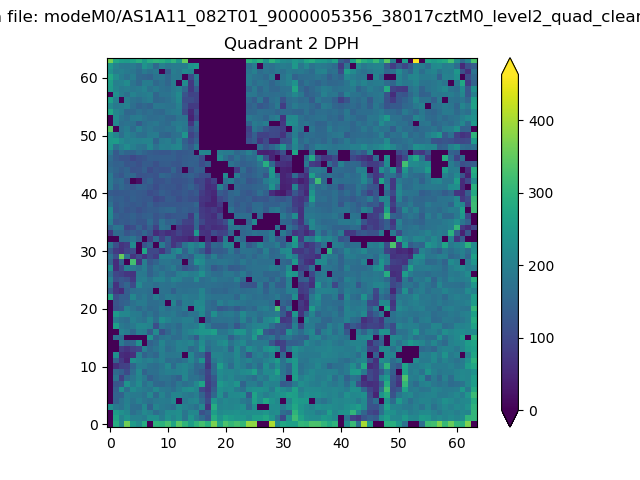
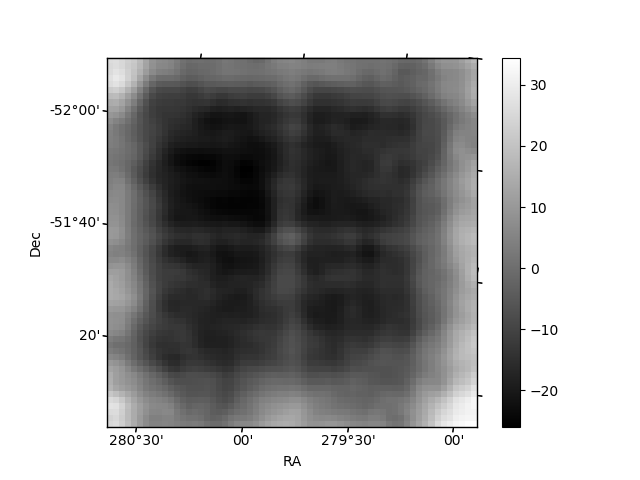
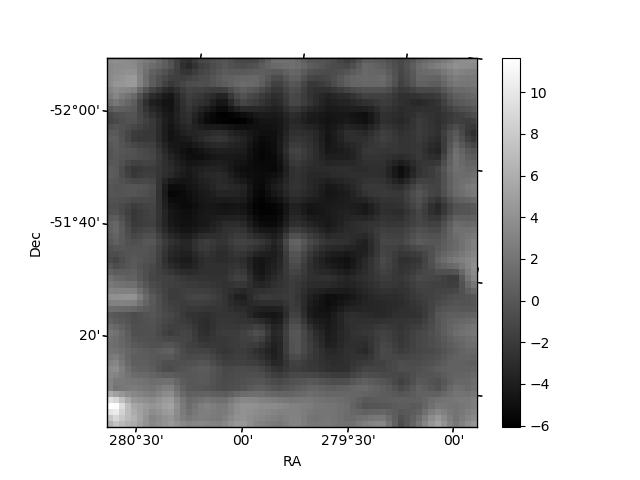
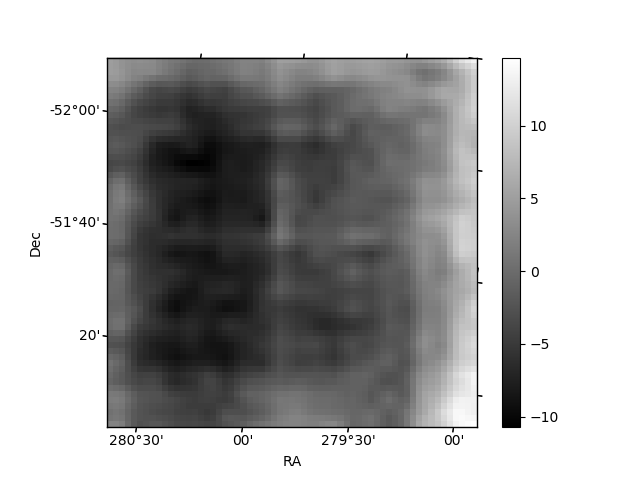
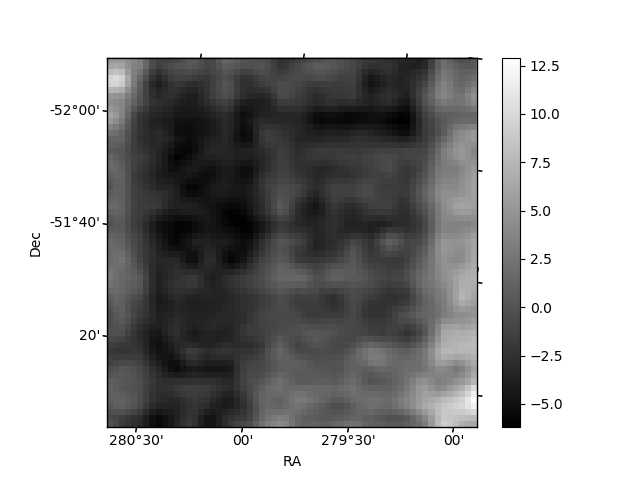
Histogram calculated using DETX and DETY for each event in the final _common_clean file
| Quadrant A | 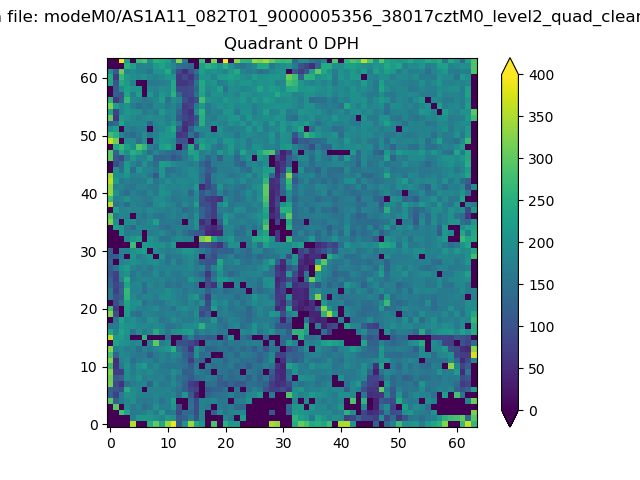 |
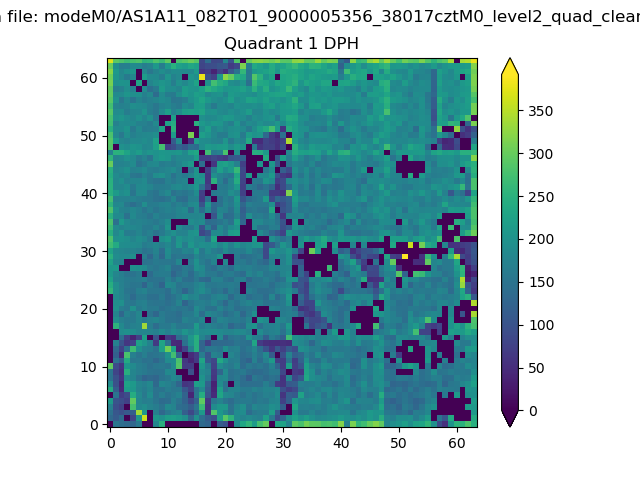 |
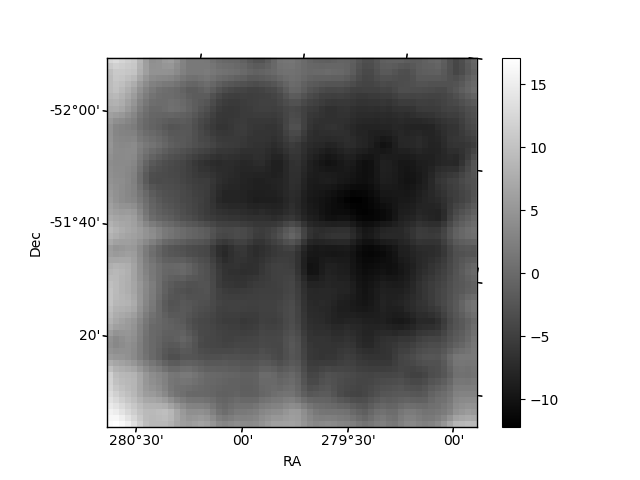
Quadrant B |
|---|---|---|---|
| Quadrant D | 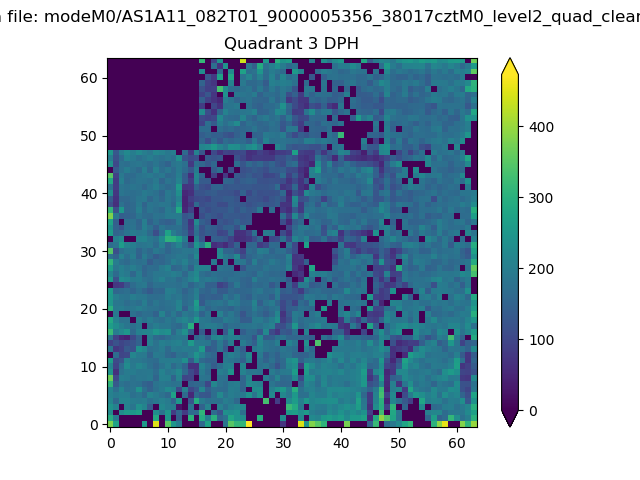 |
 |
Quadrant C |
| Plot type | Count rate plots | Images |
|---|---|---|
| Comparison with Poisson distribution Blue bars denote a histogram of data divided into 1 sec bins. Red curve is a Poisson curve with rate = median count rate of data. |
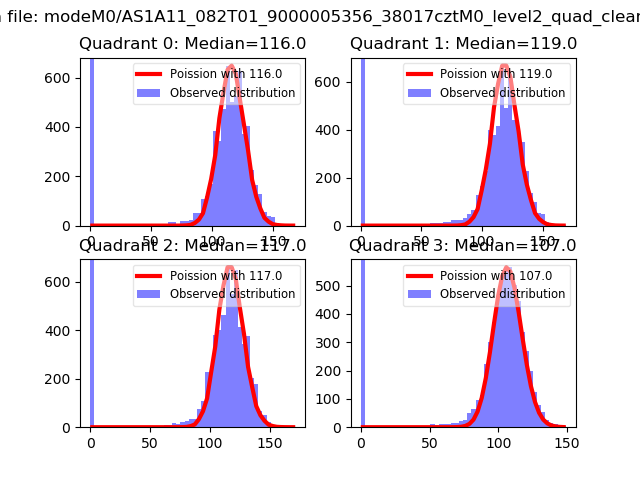 |
 |
| Quadrant-wise count rates Data is divided into 100 sec bins |
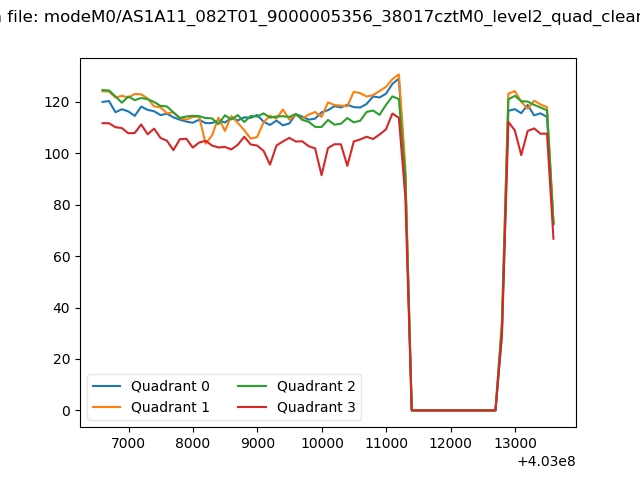 |
|
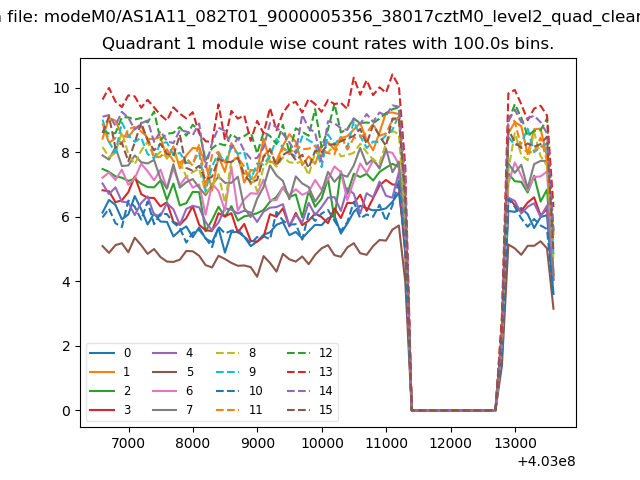
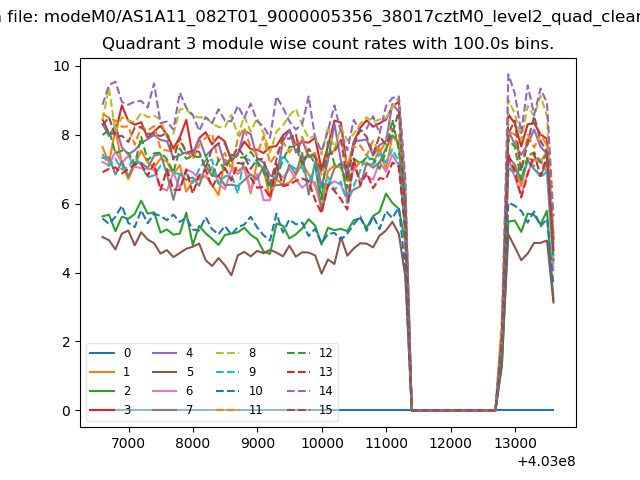
| Module-wise count rates for Quadrant A Data is divided into 100 sec bins |
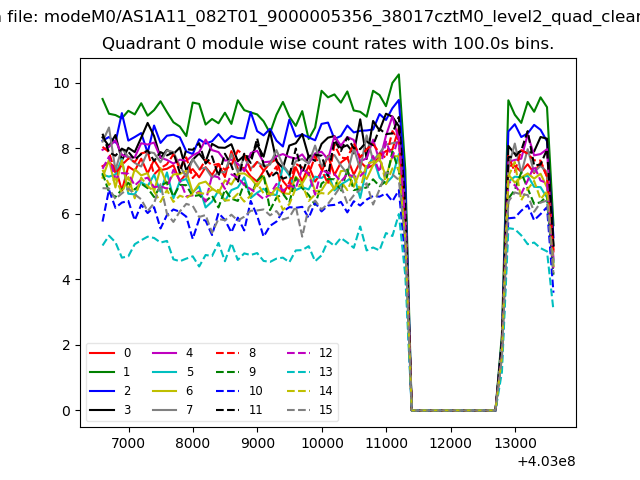 |
 |
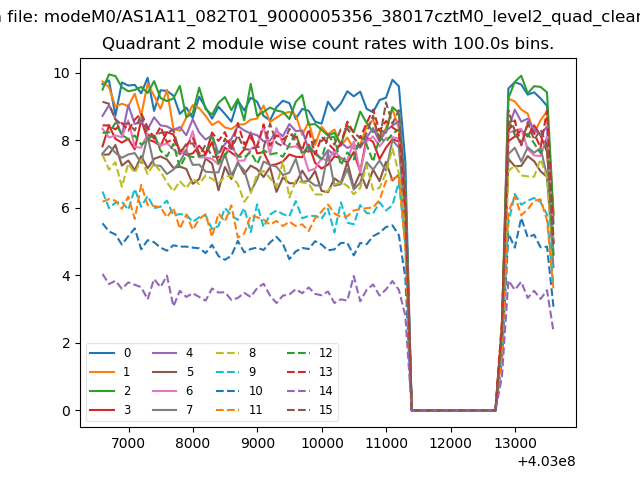
| Module-wise count rates for Quadrant B Data is divided into 100 sec bins |
 |
 |
| Module-wise count rates for Quadrant C Data is divided into 100 sec bins |
 |
 |
| Module-wise count rates for Quadrant D Data is divided into 100 sec bins |
 |
 |
| Parameter | Plot |
|---|---|
| CZT HV Monitor | 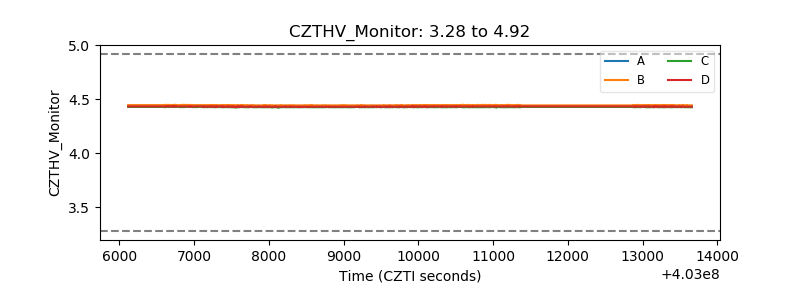 |
| D_VDD | 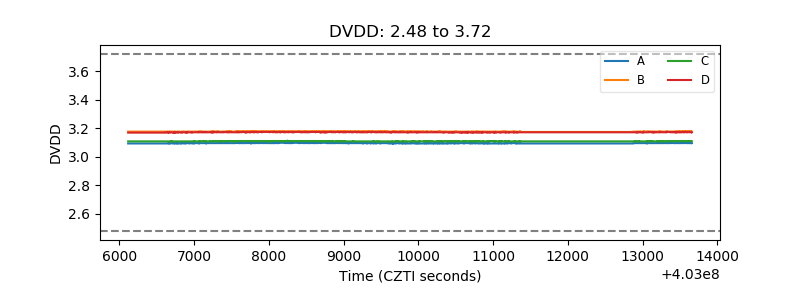 |
| Temperature 1 | 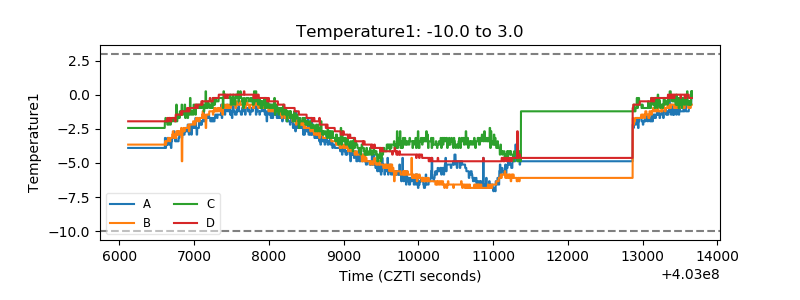 |
| Veto HV Monitor | 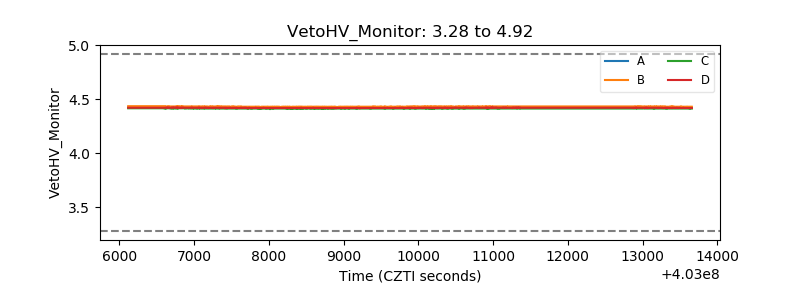 |
| Veto LLD | 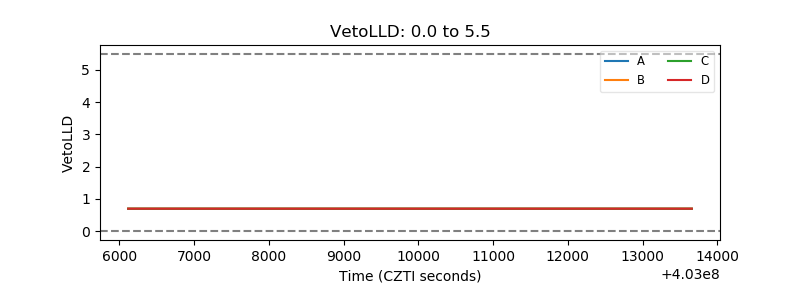 |
| Alpha Counter | 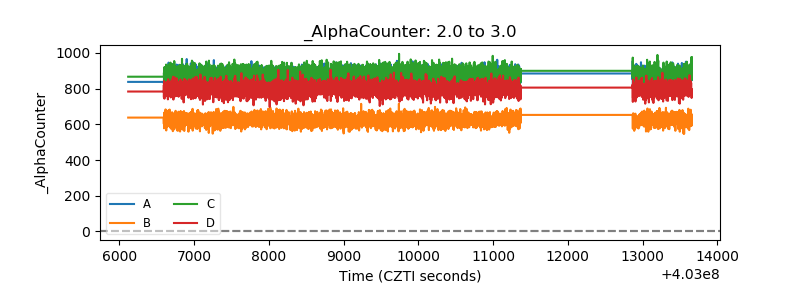 |
| _CPM_Rate | 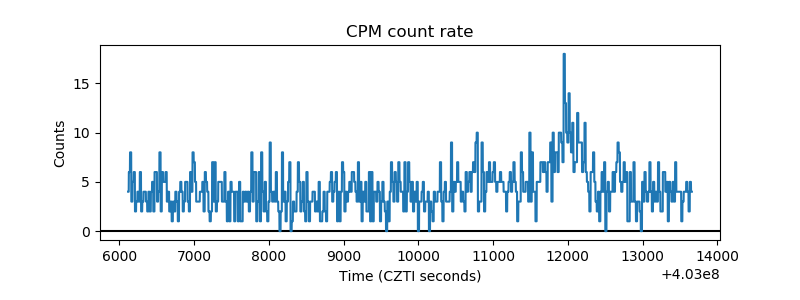 |
| CZT Counter | 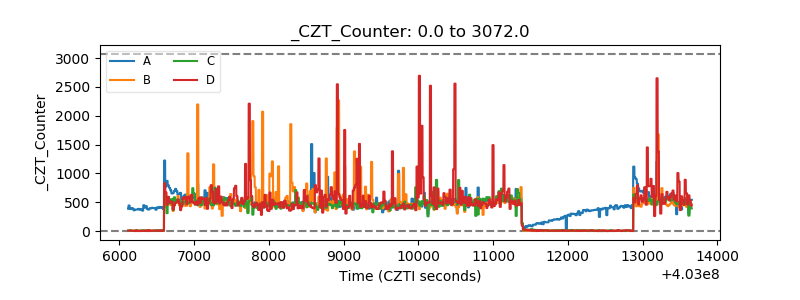 |
| +2.5 Volts monitor |  |
| +5 Volts monitor | 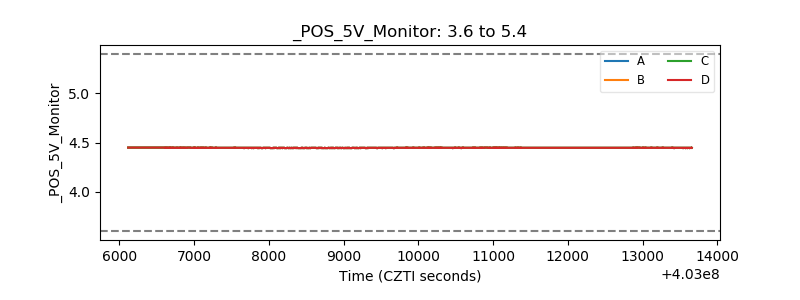 |
| _ROLL_ROT | 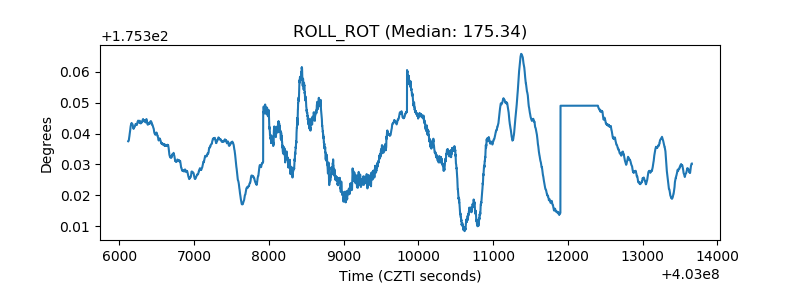 |
| _Roll_DEC | 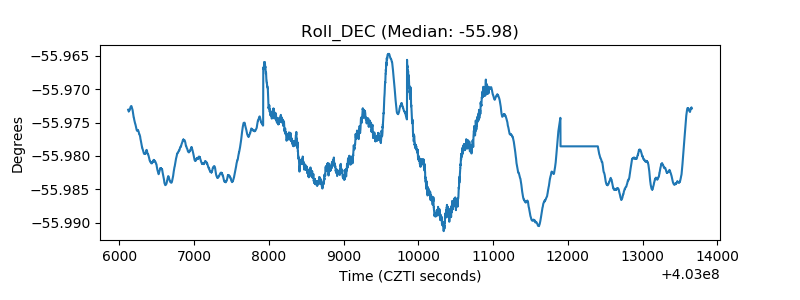 |
| _Roll_RA | 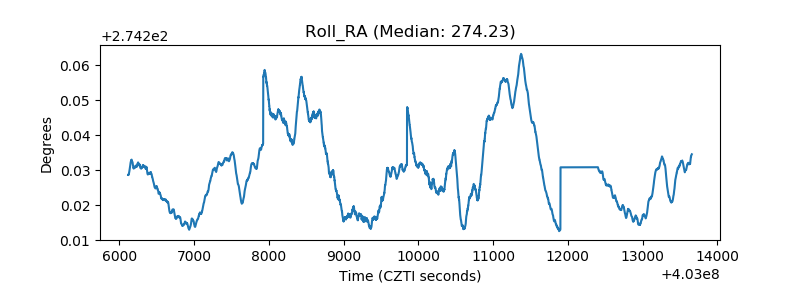 |
| Veto Counter | 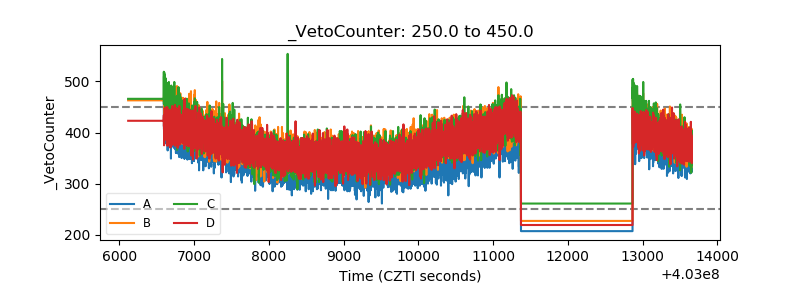 |