| Param | Original file | Final file |
|---|---|---|
| Filename | modeM0/AS1A11_082T01_9000005356_38018cztM0_level2.fits | modeM0/AS1A11_082T01_9000005356_38018cztM0_level2_quad_clean.evt |
| Size (bytes) | 403,977,600 | 101,174,400 |
| Size | 385.3 MB | 96.5 MB |
| Events in quadrant A | 3,104,753 | 682,002 |
| Events in quadrant B | 4,337,662 | 661,041 |
| Events in quadrant C | 2,919,784 | 688,687 |
| Events in quadrant D | 4,129,654 | 616,443 |
| Mode M0 | |||
|---|---|---|---|
| Quadrant | BADHDUFLAG | Total packets | Discarded packets |
| A | 0 | 12800 | 3 |
| B | 0 | 16707 | 2 |
| C | 0 | 12239 | 2 |
| D | 0 | 16125 | 2 |
| Mode SS | |||
|---|---|---|---|
| Quadrant | BADHDUFLAG | Total packets | Discarded packets |
| A | 0 | 122 | 0 |
| B | 0 | 122 | 0 |
| C | 0 | 122 | 0 |
| D | 0 | 122 | 0 |
| Mode M9 | |||
|---|---|---|---|
| Quadrant | BADHDUFLAG | Total packets | Discarded packets |
| A | 0 | 17 | 0 |
| B | 0 | 17 | 0 |
| C | 0 | 17 | 0 |
| D | 0 | 18 | 0 |
| Quadrant | Total seconds | Saturated seconds | Saturation percentage |
|---|---|---|---|
| A | 5939 | 15 | 0.252568% |
| B | 5939 | 495 | 8.334736% |
| C | 5939 | 7 | 0.117865% |
| D | 5939 | 230 | 3.872706% |
Noise dominated data is calculated using 1-second bins in cleaned event files. If a bin has >2000 counts, and if more than 50% of those come from <1% of pixels, then it is considered to be noise-dominated and hence unusable.
| Quadrant | # 1 sec bins | Bins with >0 counts | Bins with >2000 counts | High rate bins dominated by noise | Noise dominated (total time) | Noise dominated (detector-on time) | Marked lightcurve |
|---|---|---|---|---|---|---|---|
| A | 7253 | 5940 | 2 | 2 | 0.03% | 0.03% | 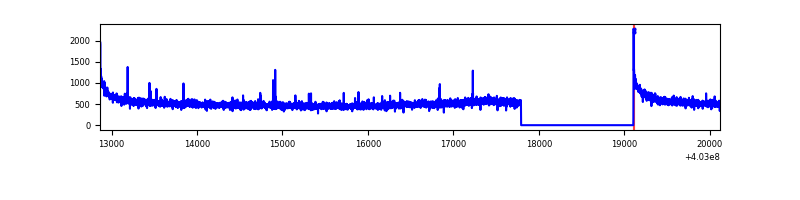 |
| B | 7253 | 5940 | 354 | 354 | 4.88% | 5.96% | 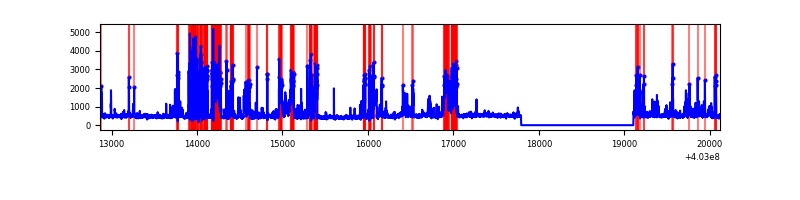 |
| C | 7253 | 5940 | 3 | 3 | 0.04% | 0.05% | 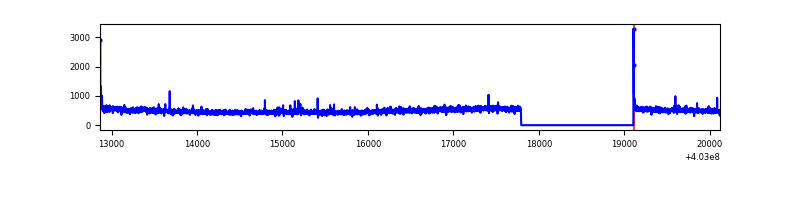 |
| D | 7253 | 5940 | 200 | 200 | 2.76% | 3.37% | 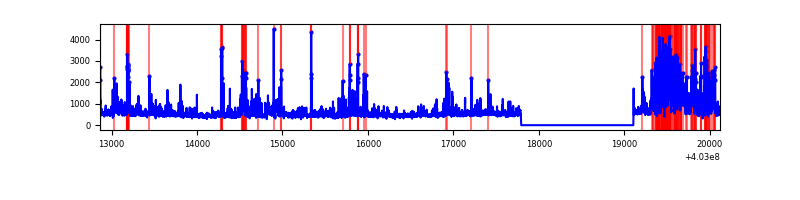 |
Top three noisy pixels from each quadrant. If the there are fewer than three noisy pixels in the level2.evt file, extra rows are filled as -1
| Pixel properties | Quadrant properties | ||||||
|---|---|---|---|---|---|---|---|
| Quadrant | DetID | PixID | Counts | Sigma | Mean | Median | Sigma |
| A | 10 | 83 | 431931 | 3127.74 | 677 | 663 | 137.9 |
| A | 13 | 6 | 17166 | 119.69 | 677 | 663 | 137.9 |
| A | 9 | 143 | 14625 | 101.26 | 677 | 663 | 137.9 |
| B | 5 | 184 | 734818 | 5879.68 | 654 | 637 | 124.9 |
| B | 4 | 171 | 445875 | 3565.68 | 654 | 637 | 124.9 |
| B | 12 | 18 | 162479 | 1296.11 | 654 | 637 | 124.9 |
| C | 15 | 214 | 255915 | 1649.62 | 664 | 668 | 154.7 |
| C | 3 | 233 | 31105 | 196.71 | 664 | 668 | 154.7 |
| C | 0 | 10 | 17281 | 107.37 | 664 | 668 | 154.7 |
| D | 1 | 52 | 463013 | 2880.57 | 653 | 635 | 160.5 |
| D | 12 | 233 | 322411 | 2004.63 | 653 | 635 | 160.5 |
| D | 12 | 227 | 195651 | 1214.93 | 653 | 635 | 160.5 |
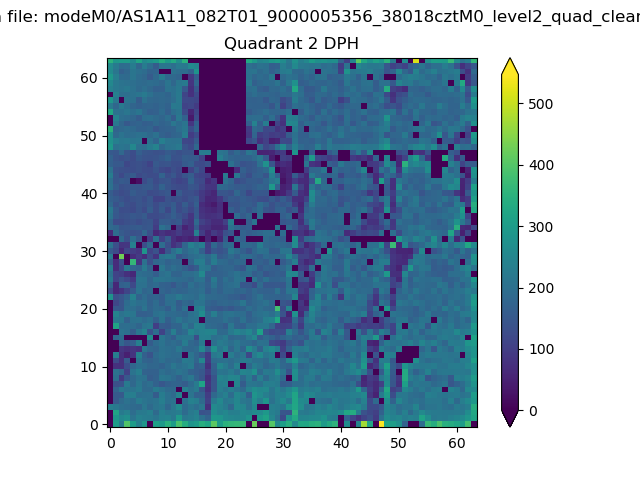
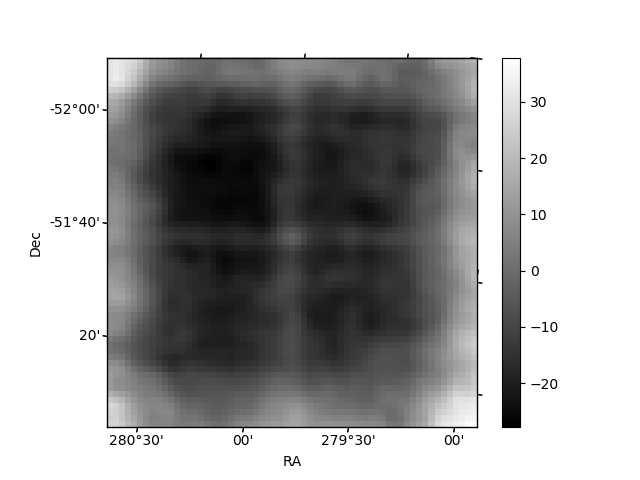
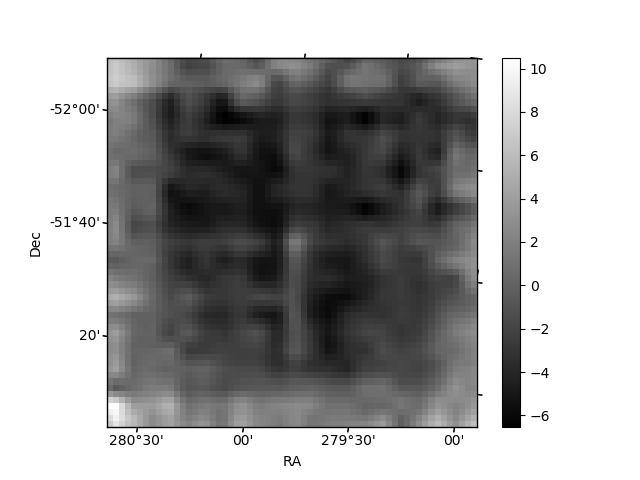
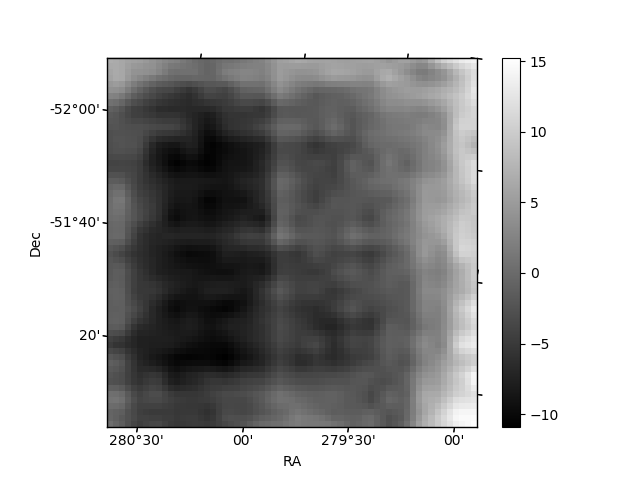
Histogram calculated using DETX and DETY for each event in the final _common_clean file
| Quadrant A | 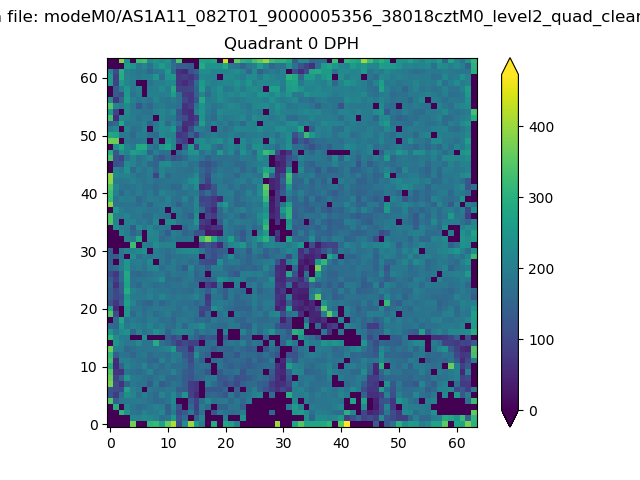 |
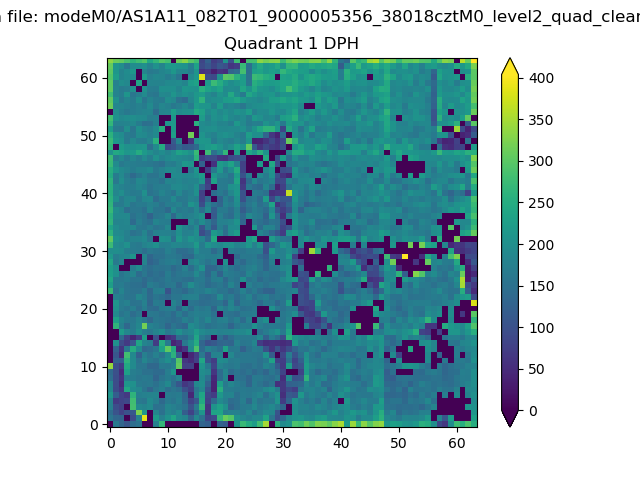 |
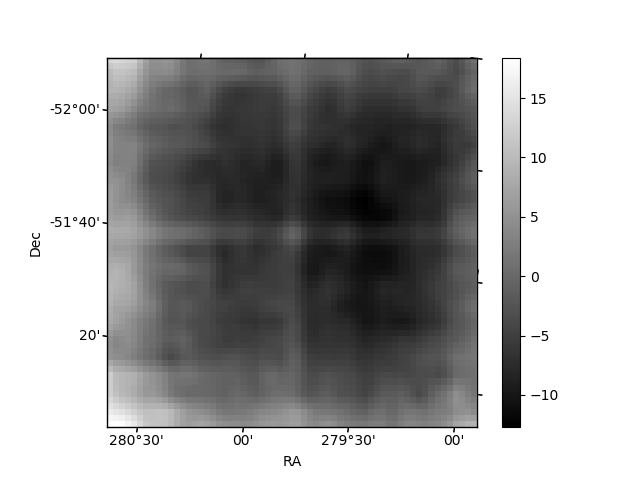
Quadrant B |
|---|---|---|---|
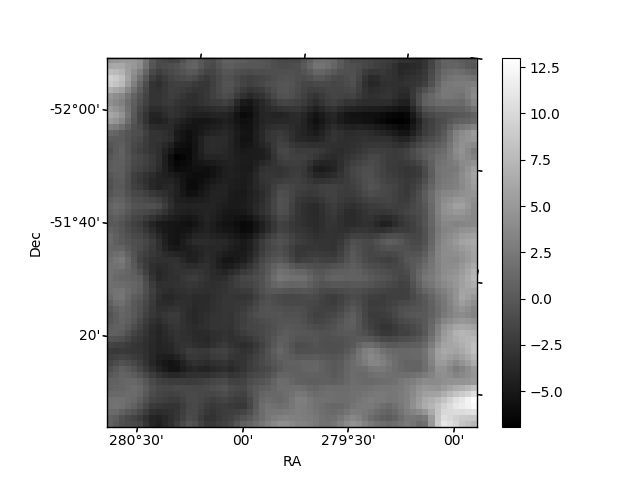
| Quadrant D | 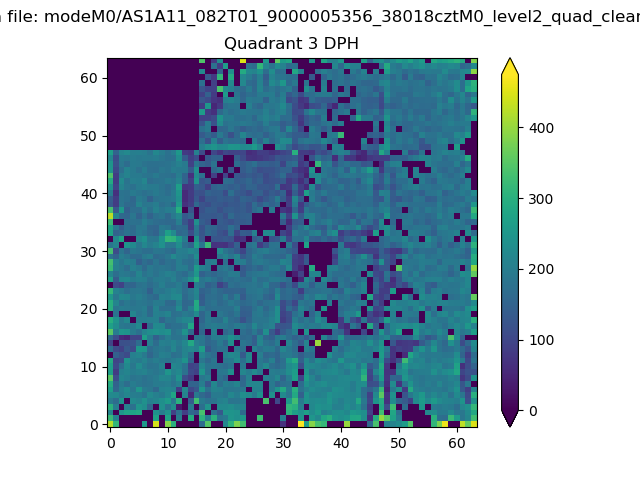 |
 |
Quadrant C |
| Plot type | Count rate plots | Images |
|---|---|---|
| Comparison with Poisson distribution Blue bars denote a histogram of data divided into 1 sec bins. Red curve is a Poisson curve with rate = median count rate of data. |
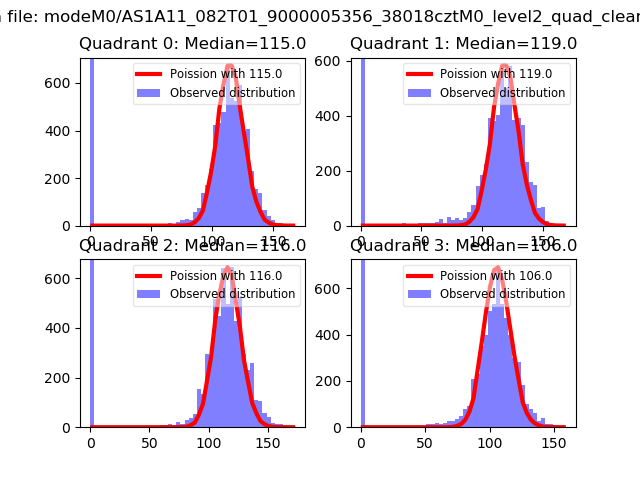 |
 |
| Quadrant-wise count rates Data is divided into 100 sec bins |
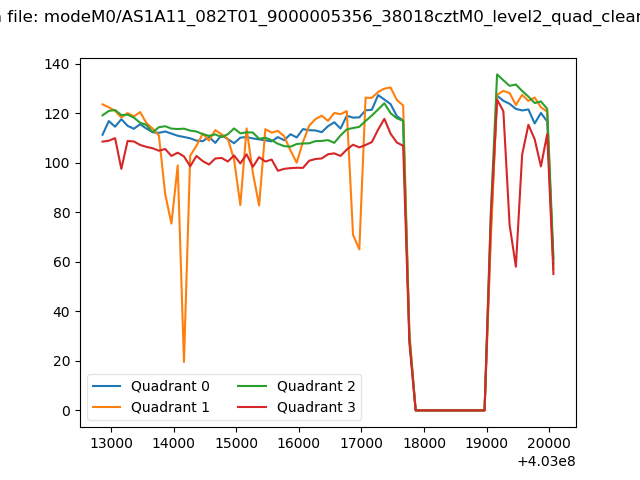 |
|
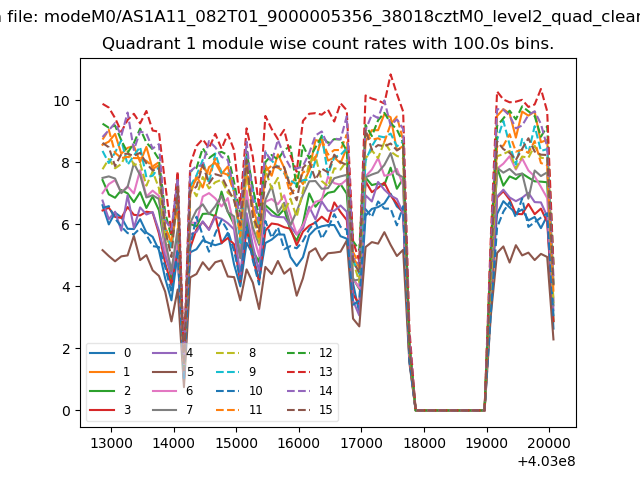
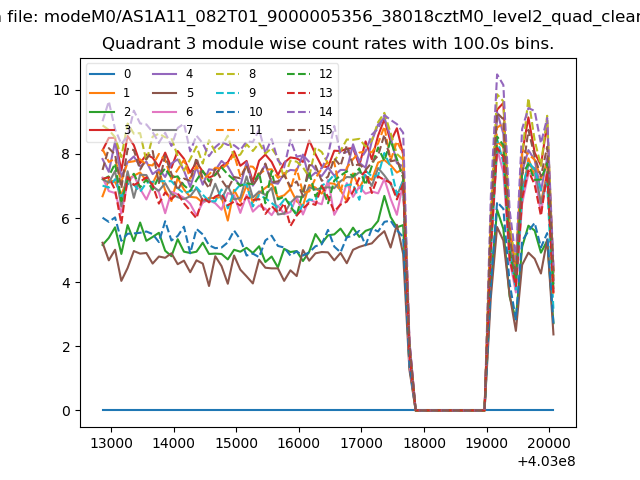
| Module-wise count rates for Quadrant A Data is divided into 100 sec bins |
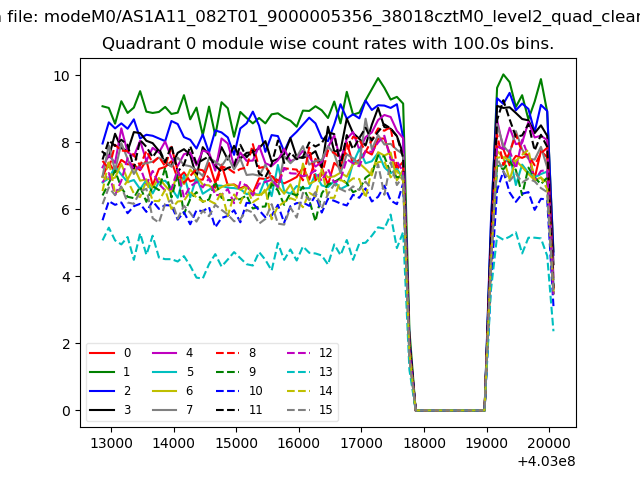 |
 |
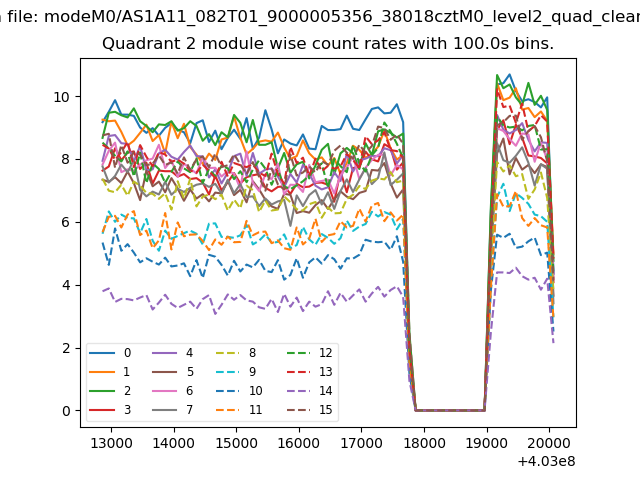
| Module-wise count rates for Quadrant B Data is divided into 100 sec bins |
 |
 |
| Module-wise count rates for Quadrant C Data is divided into 100 sec bins |
 |
 |
| Module-wise count rates for Quadrant D Data is divided into 100 sec bins |
 |
 |
| Parameter | Plot |
|---|---|
| CZT HV Monitor | 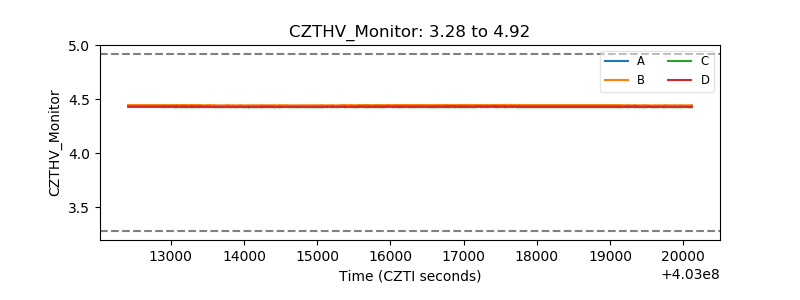 |
| D_VDD | 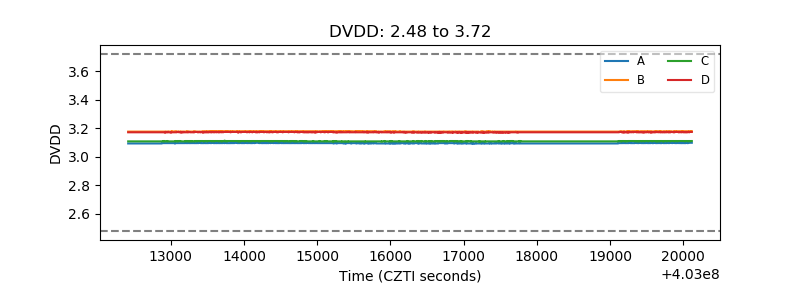 |
| Temperature 1 | 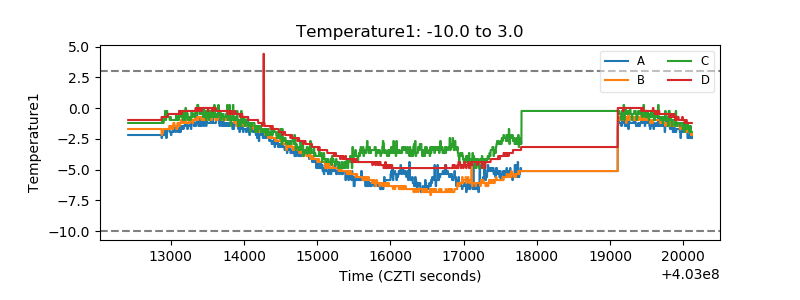 |
| Veto HV Monitor | 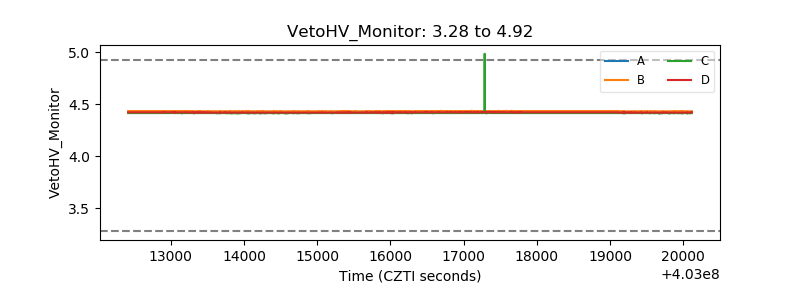 |
| Veto LLD | 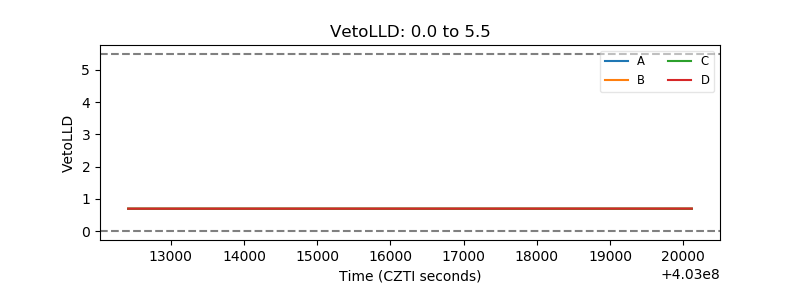 |
| Alpha Counter | 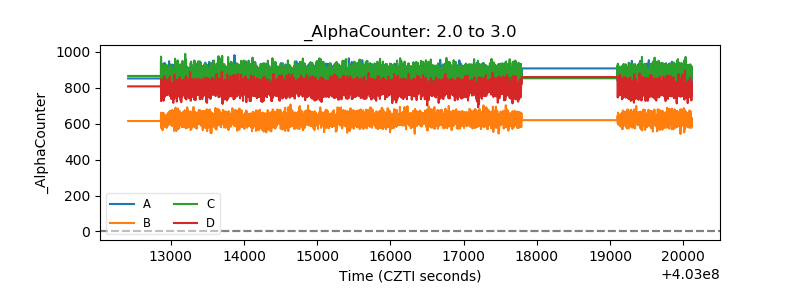 |
| _CPM_Rate | 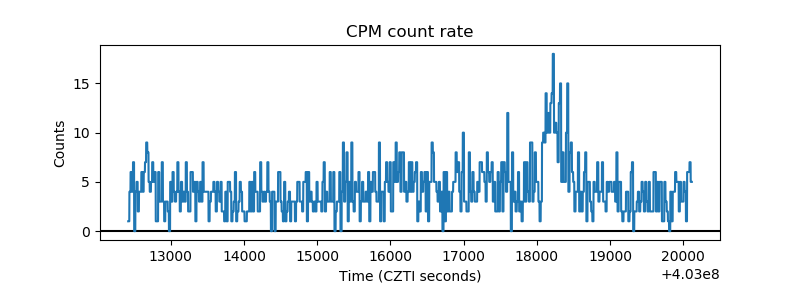 |
| CZT Counter | 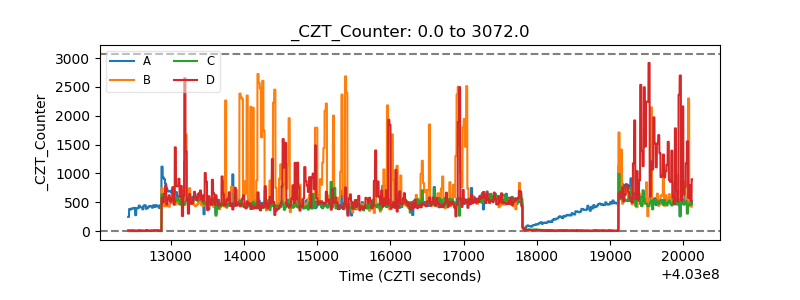 |
| +2.5 Volts monitor | 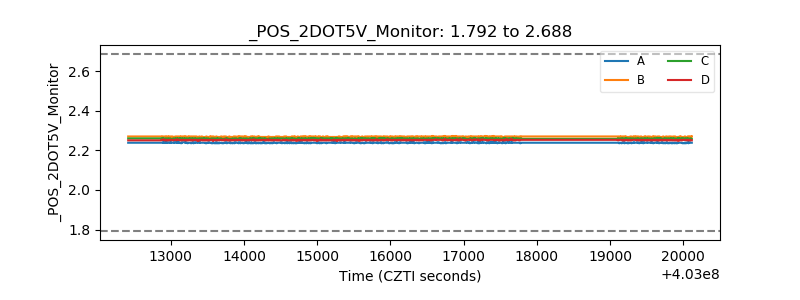 |
| +5 Volts monitor | 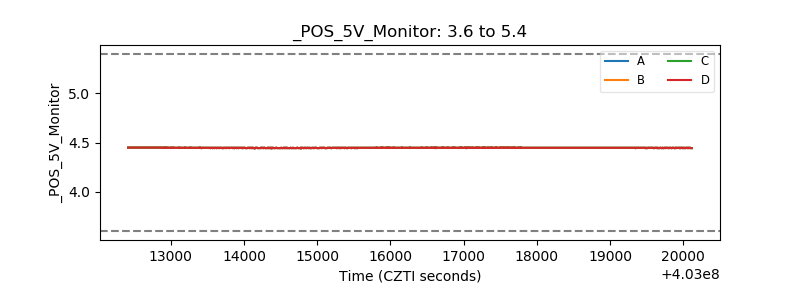 |
| _ROLL_ROT | 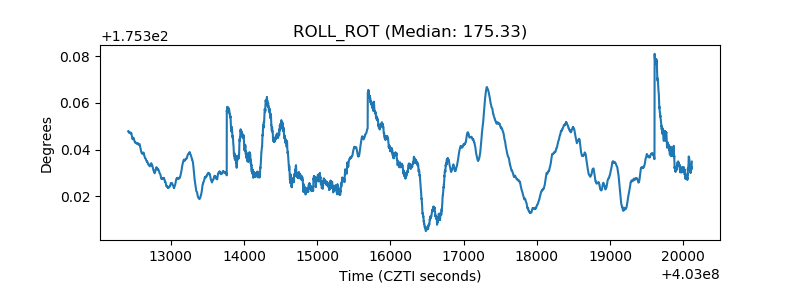 |
| _Roll_DEC | 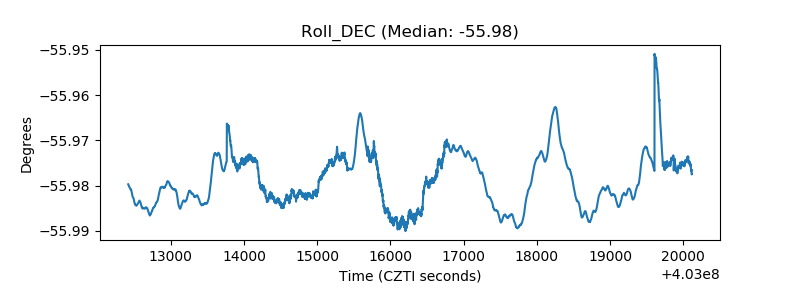 |
| _Roll_RA | 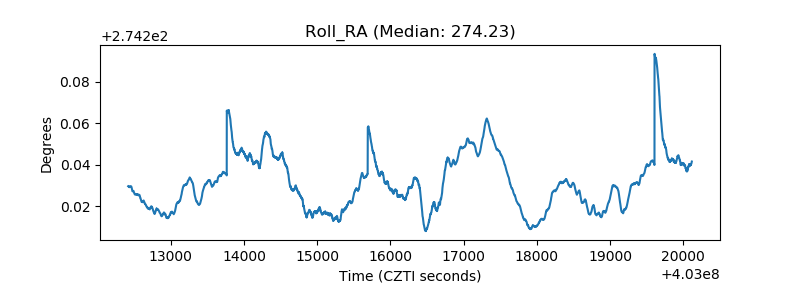 |
| Veto Counter | 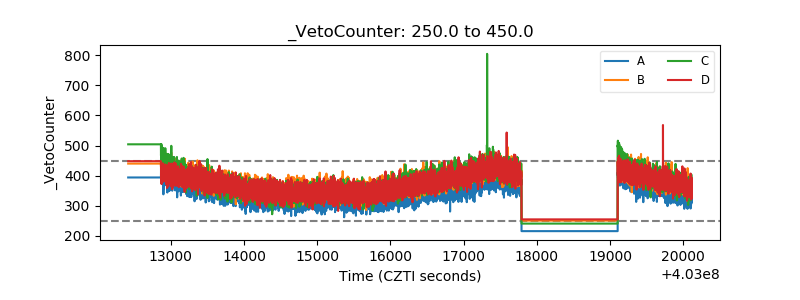 |