| Param | Original file | Final file |
|---|---|---|
| Filename | modeM0/AS1A11_082T01_9000005356_38021cztM0_level2.fits | modeM0/AS1A11_082T01_9000005356_38021cztM0_level2_quad_clean.evt |
| Size (bytes) | 721,206,720 | 176,077,440 |
| Size | 687.8 MB | 167.9 MB |
| Events in quadrant A | 5,922,347 | 1,178,472 |
| Events in quadrant B | 6,126,244 | 1,212,442 |
| Events in quadrant C | 5,410,618 | 1,172,585 |
| Events in quadrant D | 8,415,985 | 1,033,229 |
| Mode M0 | |||
|---|---|---|---|
| Quadrant | BADHDUFLAG | Total packets | Discarded packets |
| A | 0 | 24285 | 4 |
| B | 0 | 25095 | 3 |
| C | 0 | 22739 | 3 |
| D | 0 | 32183 | 3 |
| Mode SS | |||
|---|---|---|---|
| Quadrant | BADHDUFLAG | Total packets | Discarded packets |
| A | 0 | 216 | 0 |
| B | 0 | 216 | 0 |
| C | 0 | 216 | 0 |
| D | 0 | 216 | 0 |
| Mode M9 | |||
|---|---|---|---|
| Quadrant | BADHDUFLAG | Total packets | Discarded packets |
| A | 0 | 35 | 0 |
| B | 0 | 35 | 0 |
| C | 0 | 35 | 0 |
| D | 0 | 36 | 0 |
| Quadrant | Total seconds | Saturated seconds | Saturation percentage |
|---|---|---|---|
| A | 10605 | 73 | 0.688355% |
| B | 10605 | 183 | 1.725601% |
| C | 10605 | 57 | 0.537482% |
| D | 10605 | 562 | 5.299387% |
Noise dominated data is calculated using 1-second bins in cleaned event files. If a bin has >2000 counts, and if more than 50% of those come from <1% of pixels, then it is considered to be noise-dominated and hence unusable.
| Quadrant | # 1 sec bins | Bins with >0 counts | Bins with >2000 counts | High rate bins dominated by noise | Noise dominated (total time) | Noise dominated (detector-on time) | Marked lightcurve |
|---|---|---|---|---|---|---|---|
| A | 13471 | 10607 | 40 | 40 | 0.30% | 0.38% | 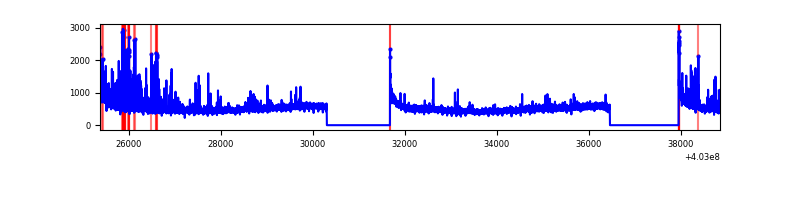 |
| B | 13471 | 10607 | 105 | 105 | 0.78% | 0.99% | 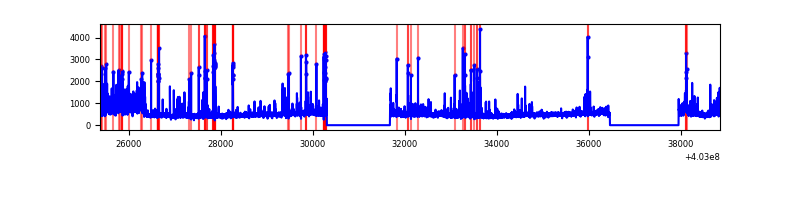 |
| C | 13471 | 10607 | 37 | 37 | 0.27% | 0.35% | 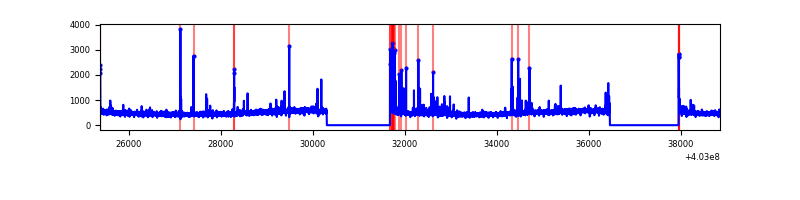 |
| D | 13471 | 10607 | 515 | 515 | 3.82% | 4.86% | 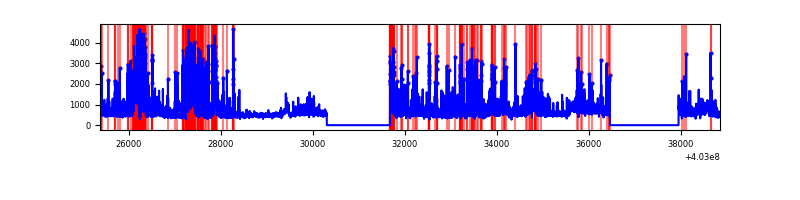 |
Top three noisy pixels from each quadrant. If the there are fewer than three noisy pixels in the level2.evt file, extra rows are filled as -1
| Pixel properties | Quadrant properties | ||||||
|---|---|---|---|---|---|---|---|
| Quadrant | DetID | PixID | Counts | Sigma | Mean | Median | Sigma |
| A | 10 | 83 | 707068 | 2875.23 | 1202 | 1178 | 245.5 |
| A | 12 | 16 | 380393 | 1544.62 | 1202 | 1178 | 245.5 |
| A | 12 | 194 | 63247 | 252.82 | 1202 | 1178 | 245.5 |
| B | 5 | 172 | 310272 | 1351.83 | 1201 | 1168 | 228.7 |
| B | 4 | 232 | 233609 | 1016.56 | 1201 | 1168 | 228.7 |
| B | 0 | 197 | 186188 | 809.17 | 1201 | 1168 | 228.7 |
| C | 15 | 214 | 445284 | 1628.19 | 1176 | 1185 | 272.8 |
| C | 1 | 23 | 132717 | 482.23 | 1176 | 1185 | 272.8 |
| C | 14 | 254 | 109593 | 397.45 | 1176 | 1185 | 272.8 |
| D | 12 | 227 | 1238271 | 4446.7 | 1145 | 1114 | 278.2 |
| D | 5 | 222 | 840241 | 3016.06 | 1145 | 1114 | 278.2 |
| D | 2 | 250 | 455522 | 1633.27 | 1145 | 1114 | 278.2 |
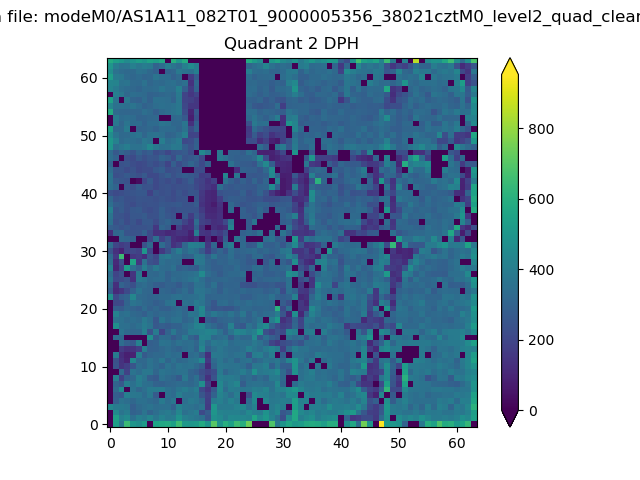
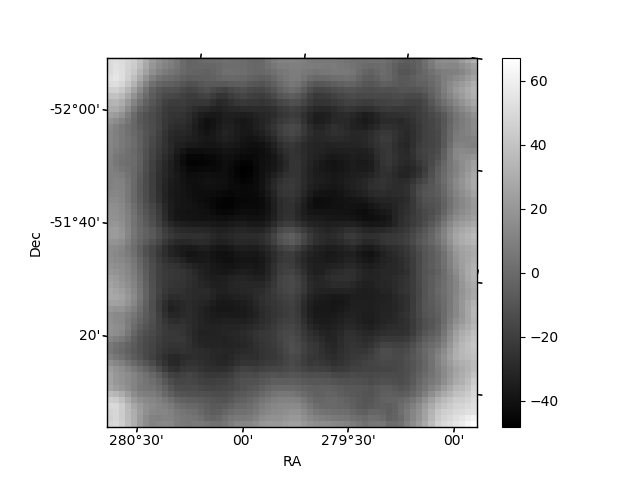
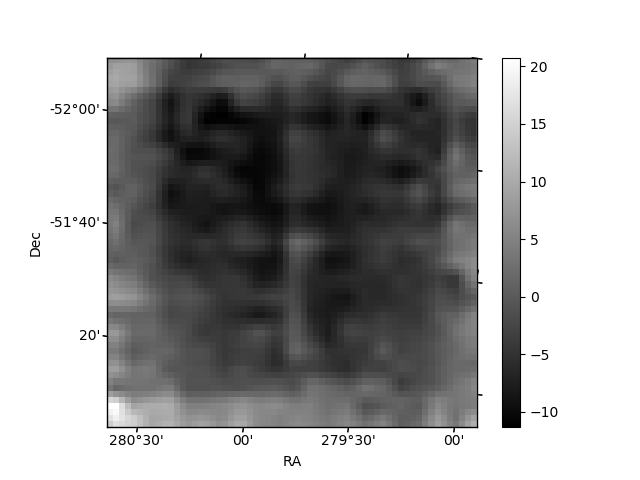
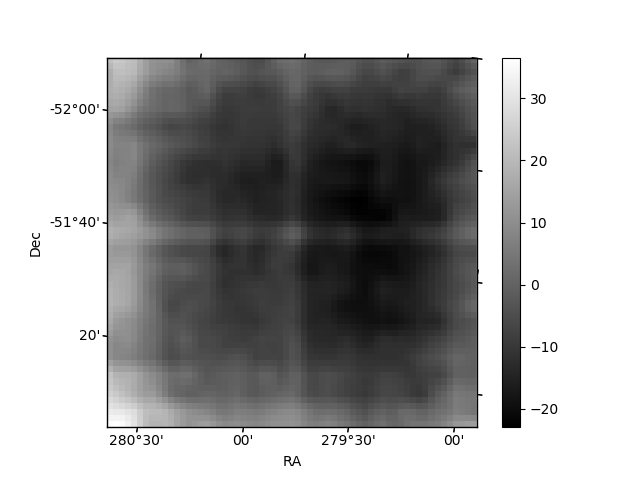
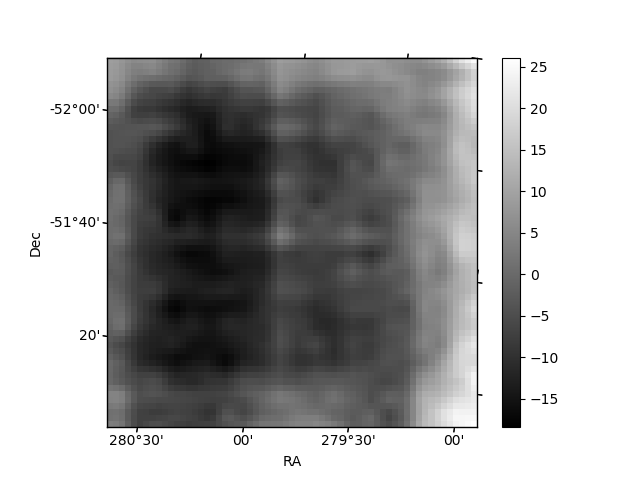
Histogram calculated using DETX and DETY for each event in the final _common_clean file
| Quadrant A | 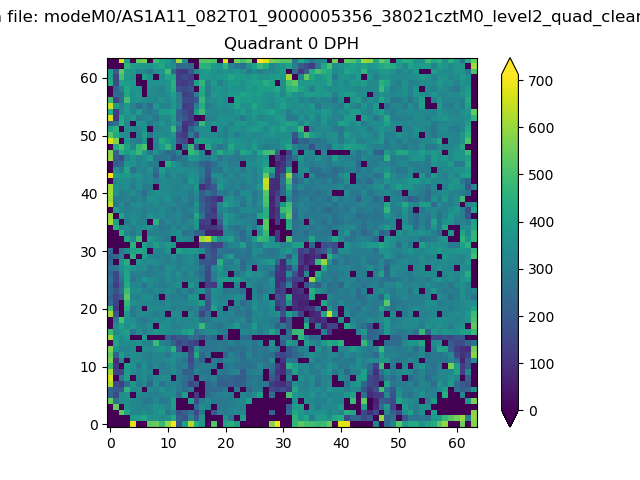 |
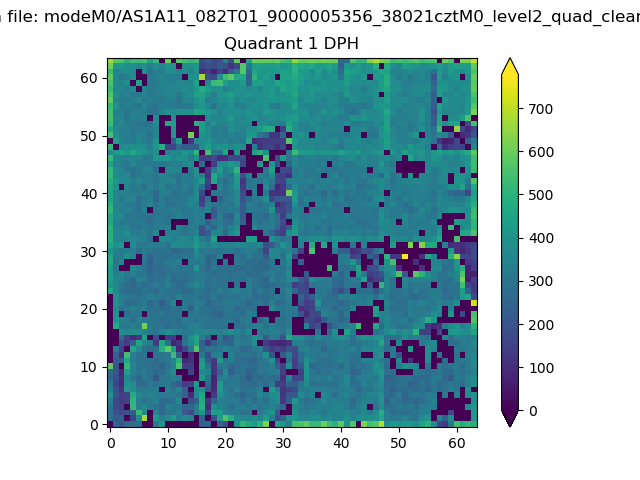 |
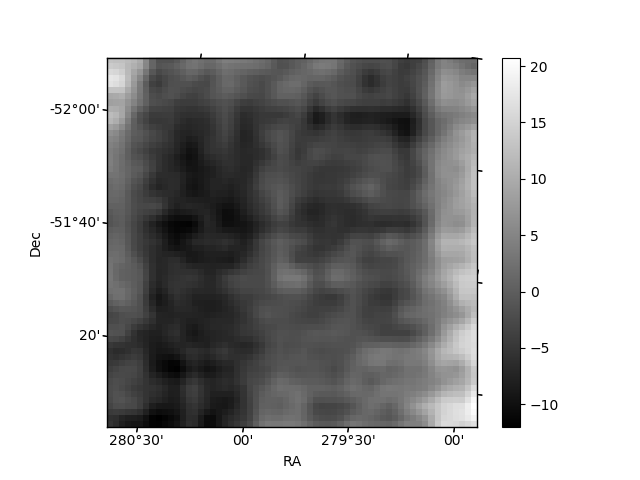
Quadrant B |
|---|---|---|---|
| Quadrant D | 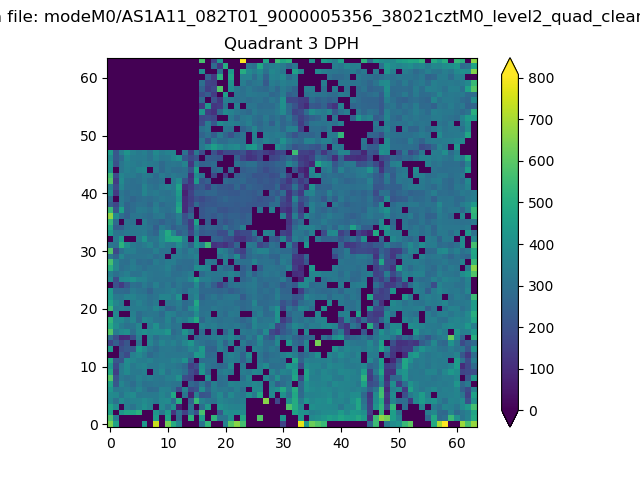 |
 |
Quadrant C |
| Plot type | Count rate plots | Images |
|---|---|---|
| Comparison with Poisson distribution Blue bars denote a histogram of data divided into 1 sec bins. Red curve is a Poisson curve with rate = median count rate of data. |
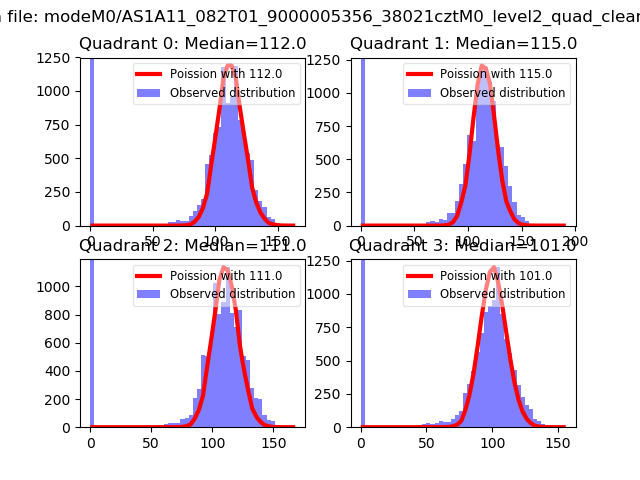 |
 |
| Quadrant-wise count rates Data is divided into 100 sec bins |
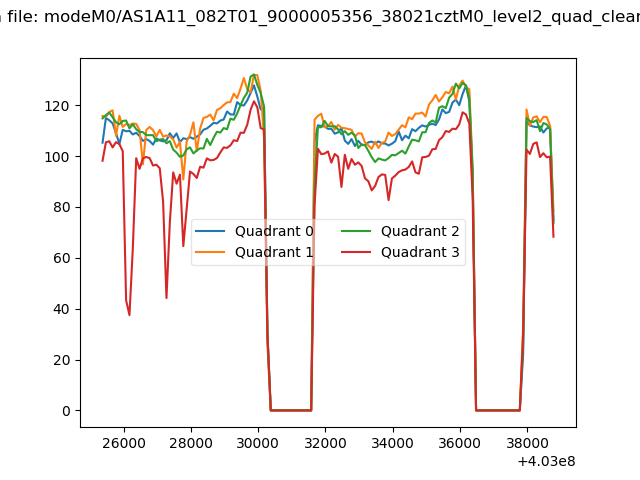 |
|
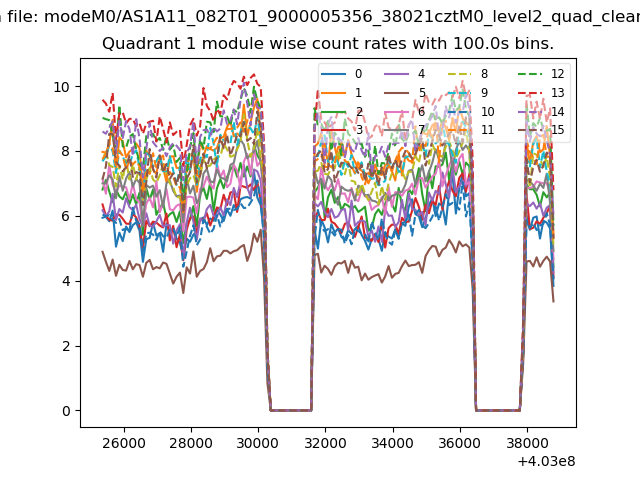
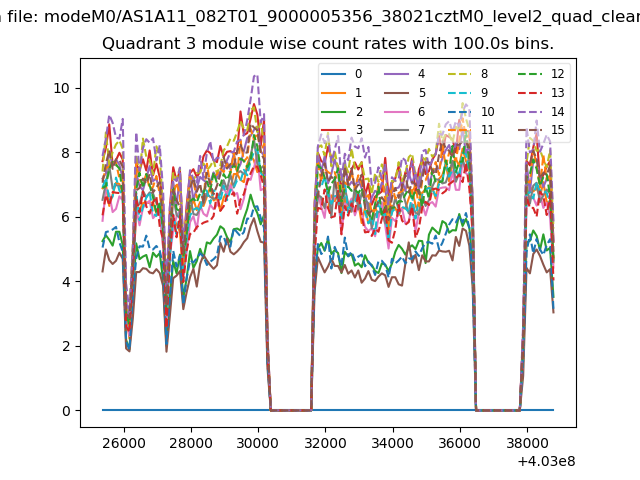
| Module-wise count rates for Quadrant A Data is divided into 100 sec bins |
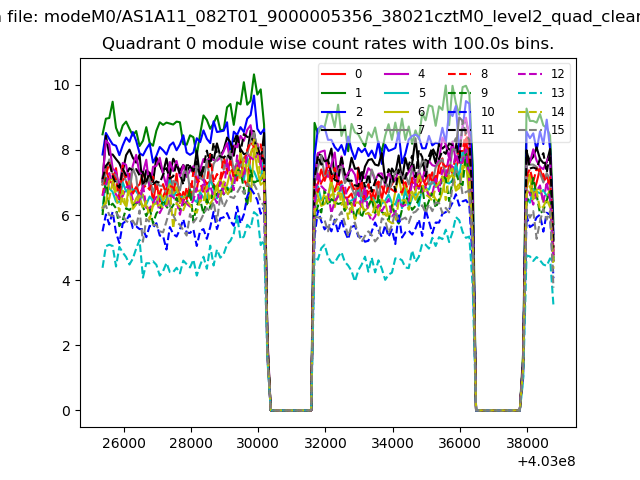 |
 |
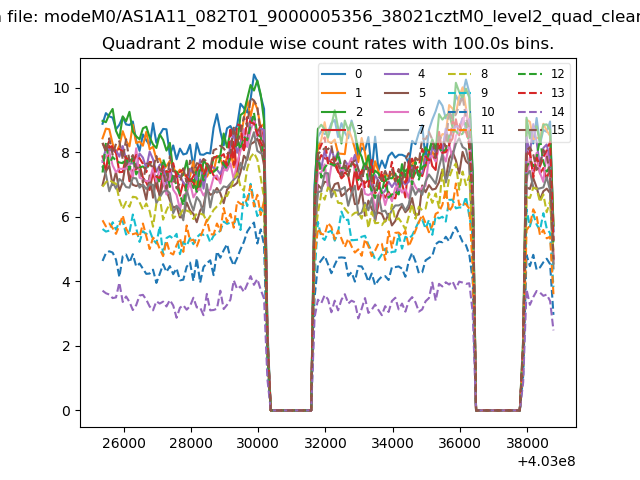
| Module-wise count rates for Quadrant B Data is divided into 100 sec bins |
 |
 |
| Module-wise count rates for Quadrant C Data is divided into 100 sec bins |
 |
 |
| Module-wise count rates for Quadrant D Data is divided into 100 sec bins |
 |
 |
| Parameter | Plot |
|---|---|
| CZT HV Monitor | 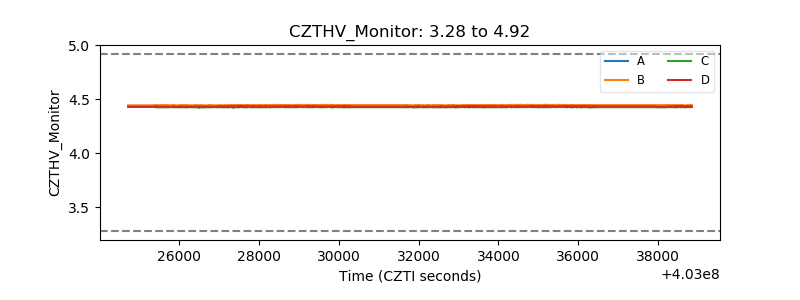 |
| D_VDD | 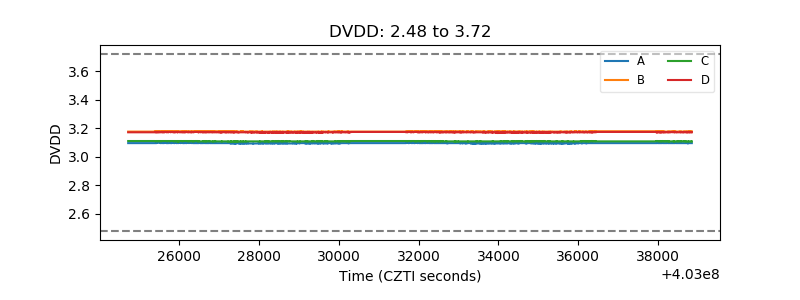 |
| Temperature 1 | 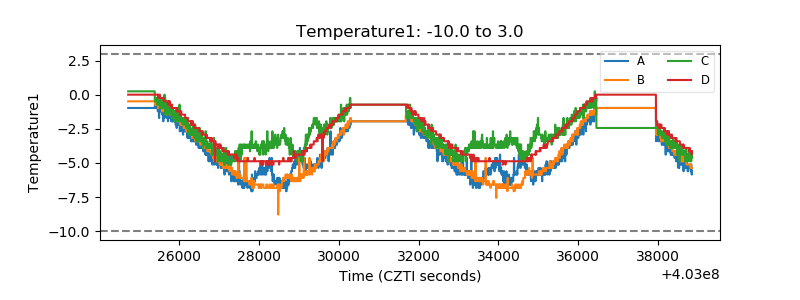 |
| Veto HV Monitor | 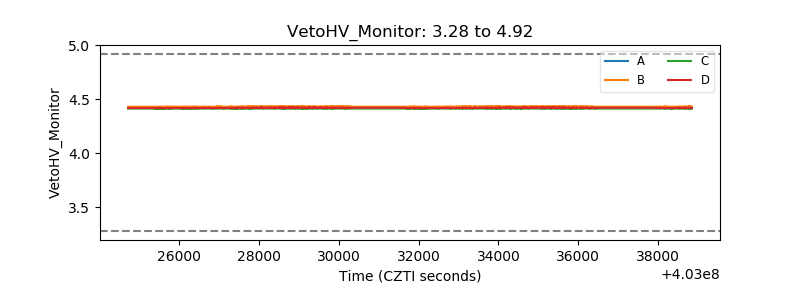 |
| Veto LLD | 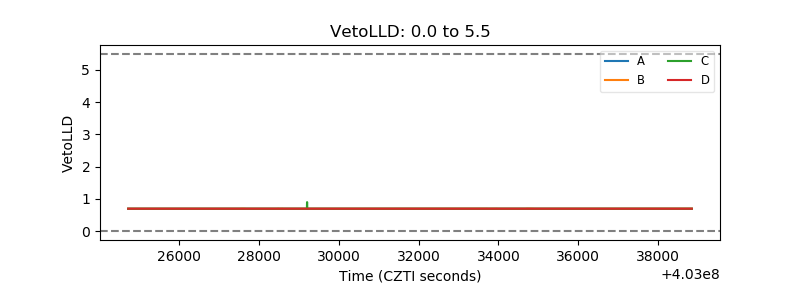 |
| Alpha Counter | 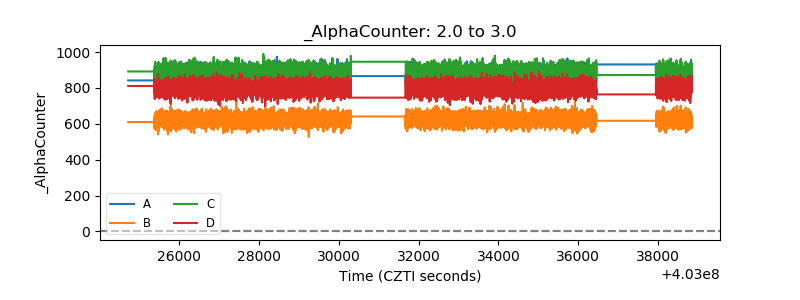 |
| _CPM_Rate | 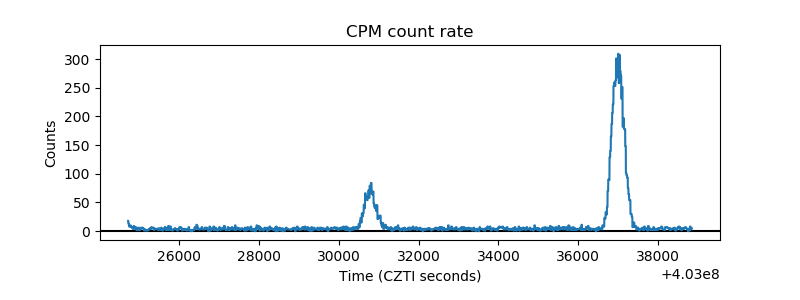 |
| CZT Counter | 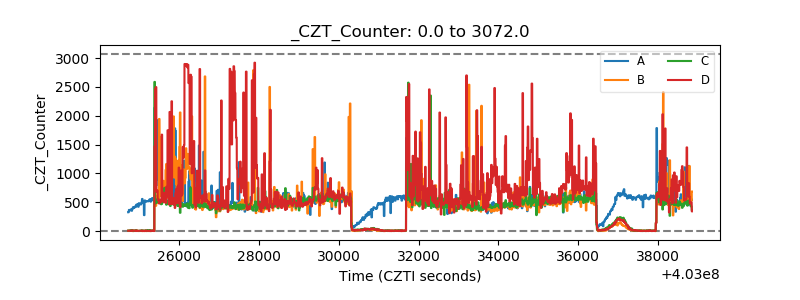 |
| +2.5 Volts monitor | 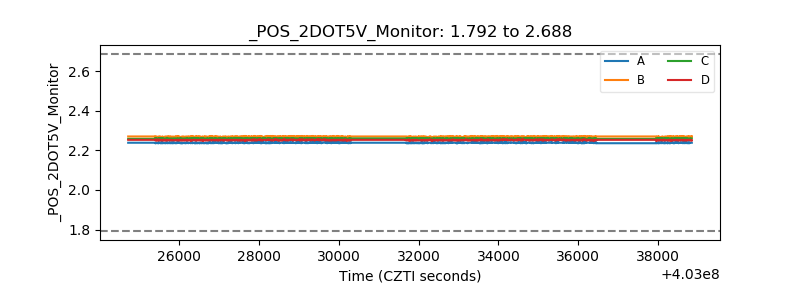 |
| +5 Volts monitor | 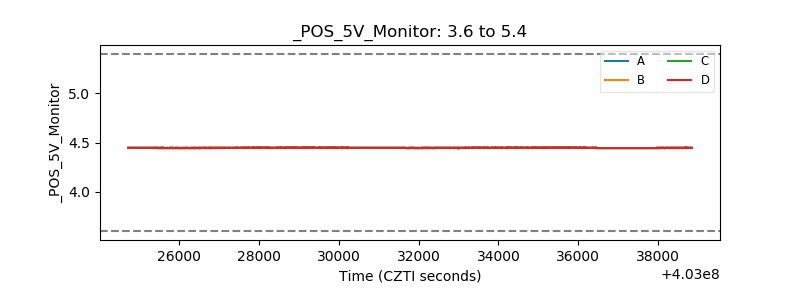 |
| _ROLL_ROT | 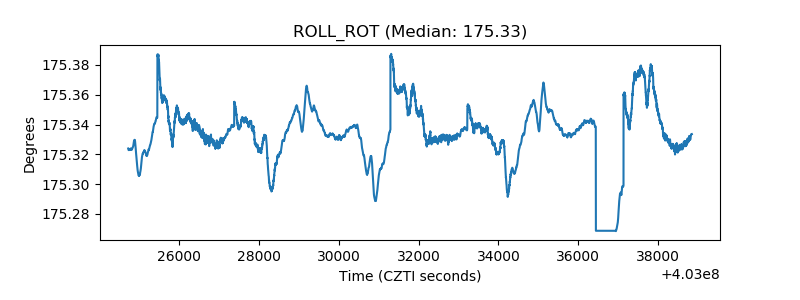 |
| _Roll_DEC | 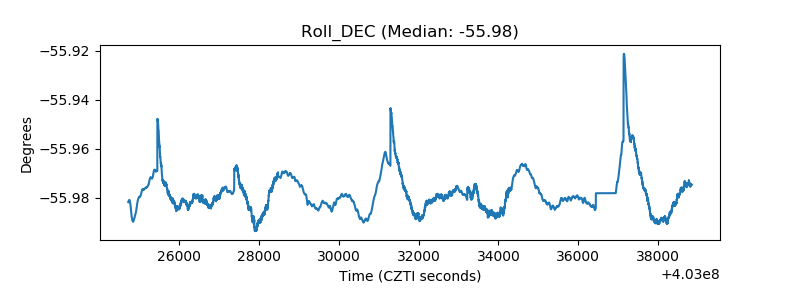 |
| _Roll_RA | 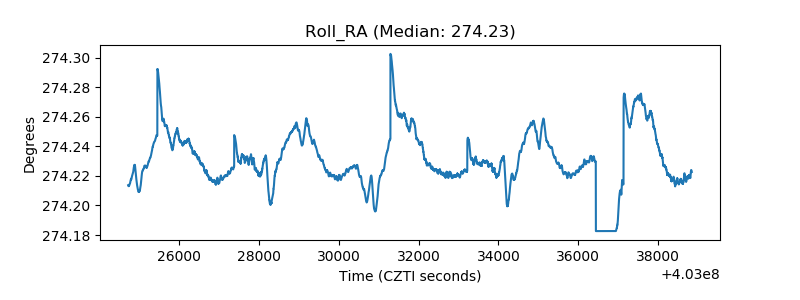 |
| Veto Counter | 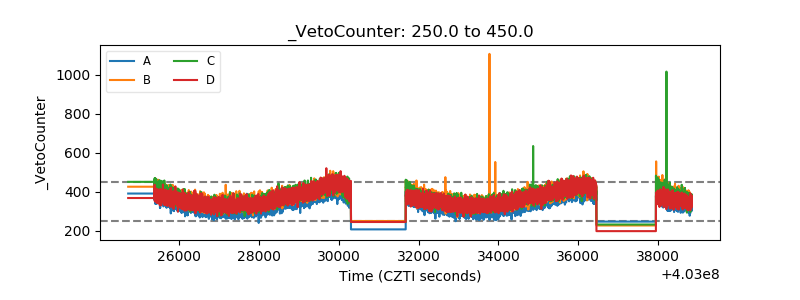 |