| Param | Original file | Final file |
|---|---|---|
| Filename | modeM0/AS1A11_082T01_9000005356_38022cztM0_level2.fits | modeM0/AS1A11_082T01_9000005356_38022cztM0_level2_quad_clean.evt |
| Size (bytes) | 368,130,240 | 95,420,160 |
| Size | 351.1 MB | 91.0 MB |
| Events in quadrant A | 2,999,663 | 643,586 |
| Events in quadrant B | 3,065,449 | 658,441 |
| Events in quadrant C | 2,766,745 | 636,814 |
| Events in quadrant D | 4,356,204 | 556,164 |
| Mode M0 | |||
|---|---|---|---|
| Quadrant | BADHDUFLAG | Total packets | Discarded packets |
| A | 0 | 12468 | 3 |
| B | 0 | 12852 | 2 |
| C | 0 | 11675 | 2 |
| D | 0 | 16745 | 2 |
| Mode SS | |||
|---|---|---|---|
| Quadrant | BADHDUFLAG | Total packets | Discarded packets |
| A | 0 | 114 | 0 |
| B | 0 | 114 | 0 |
| C | 0 | 114 | 0 |
| D | 0 | 114 | 0 |
| Mode M9 | |||
|---|---|---|---|
| Quadrant | BADHDUFLAG | Total packets | Discarded packets |
| A | 0 | 25 | 0 |
| B | 0 | 25 | 0 |
| C | 0 | 25 | 0 |
| D | 0 | 26 | 0 |
| Quadrant | Total seconds | Saturated seconds | Saturation percentage |
|---|---|---|---|
| A | 5640 | 27 | 0.478723% |
| B | 5640 | 82 | 1.453901% |
| C | 5640 | 11 | 0.195035% |
| D | 5640 | 320 | 5.673759% |
Noise dominated data is calculated using 1-second bins in cleaned event files. If a bin has >2000 counts, and if more than 50% of those come from <1% of pixels, then it is considered to be noise-dominated and hence unusable.
| Quadrant | # 1 sec bins | Bins with >0 counts | Bins with >2000 counts | High rate bins dominated by noise | Noise dominated (total time) | Noise dominated (detector-on time) | Marked lightcurve |
|---|---|---|---|---|---|---|---|
| A | 7224 | 5641 | 12 | 12 | 0.17% | 0.21% | 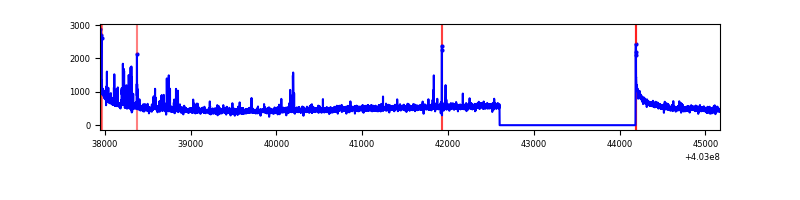 |
| B | 7223 | 5640 | 54 | 54 | 0.75% | 0.96% | 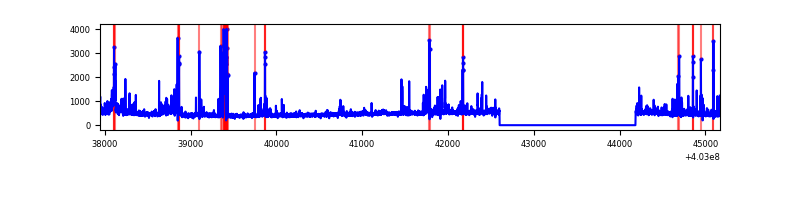 |
| C | 7224 | 5641 | 6 | 6 | 0.08% | 0.11% | 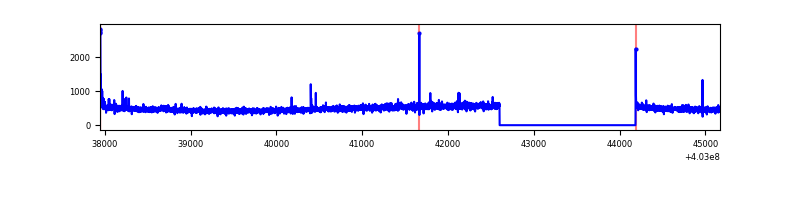 |
| D | 7224 | 5641 | 263 | 263 | 3.64% | 4.66% | 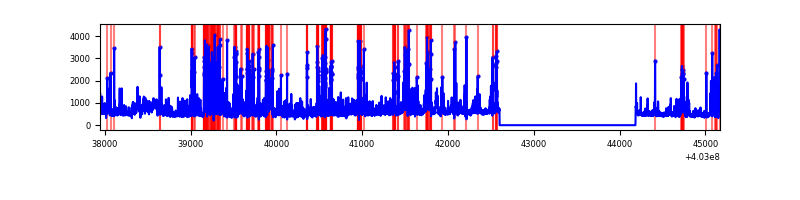 |
Top three noisy pixels from each quadrant. If the there are fewer than three noisy pixels in the level2.evt file, extra rows are filled as -1
| Pixel properties | Quadrant properties | ||||||
|---|---|---|---|---|---|---|---|
| Quadrant | DetID | PixID | Counts | Sigma | Mean | Median | Sigma |
| A | 10 | 83 | 388445 | 2992.17 | 635 | 622 | 129.6 |
| A | 12 | 16 | 85365 | 653.82 | 635 | 622 | 129.6 |
| A | 13 | 6 | 23764 | 178.55 | 635 | 622 | 129.6 |
| B | 5 | 172 | 176222 | 1448.42 | 634 | 616 | 121.2 |
| B | 5 | 255 | 87595 | 717.41 | 634 | 616 | 121.2 |
| B | 5 | 184 | 79538 | 650.96 | 634 | 616 | 121.2 |
| C | 15 | 214 | 239589 | 1637.11 | 624 | 628 | 146.0 |
| C | 3 | 233 | 28595 | 191.6 | 624 | 628 | 146.0 |
| C | 0 | 10 | 26803 | 179.32 | 624 | 628 | 146.0 |
| D | 5 | 222 | 1045083 | 7075.09 | 605 | 588 | 147.6 |
| D | 13 | 171 | 299688 | 2026.01 | 605 | 588 | 147.6 |
| D | 7 | 223 | 165352 | 1116.06 | 605 | 588 | 147.6 |
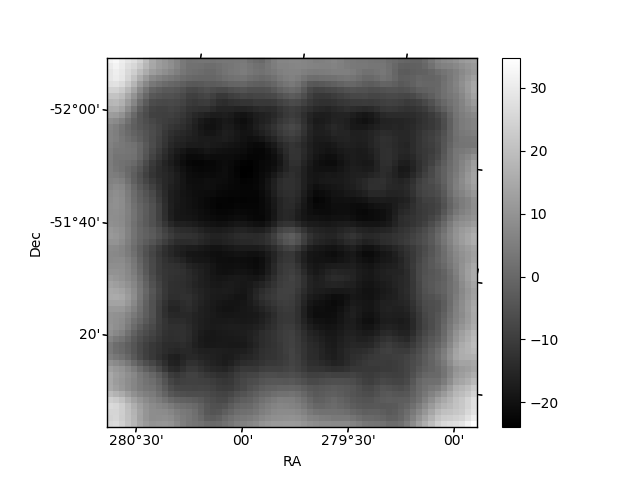
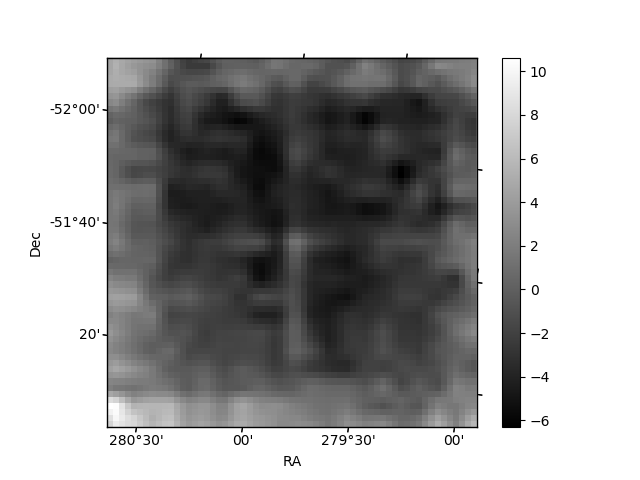
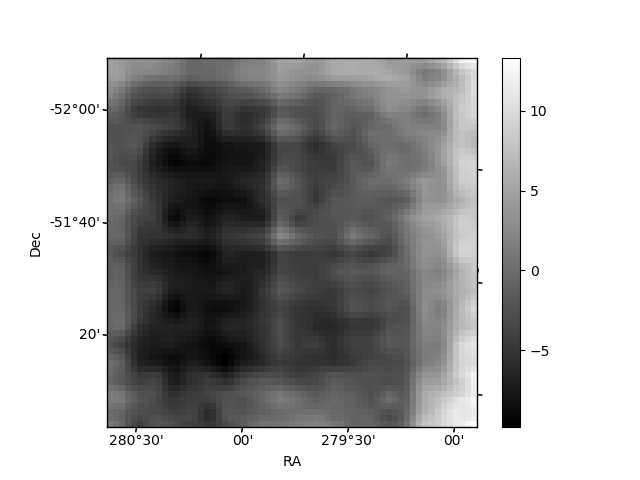
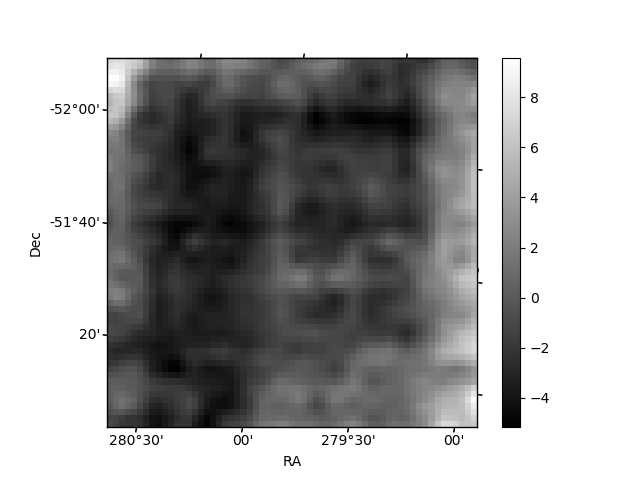
Histogram calculated using DETX and DETY for each event in the final _common_clean file
| Quadrant A | 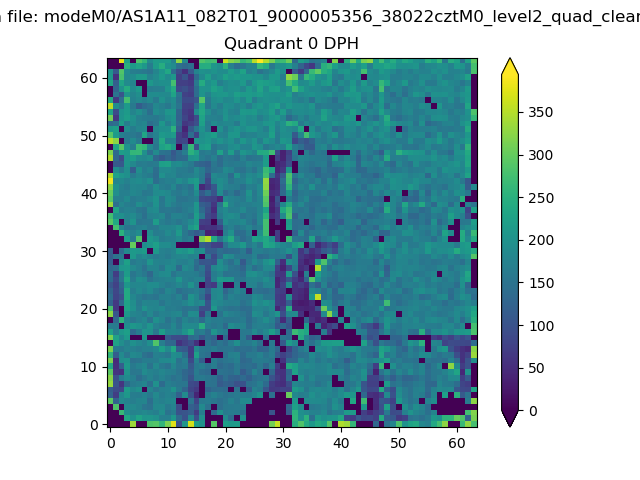 |
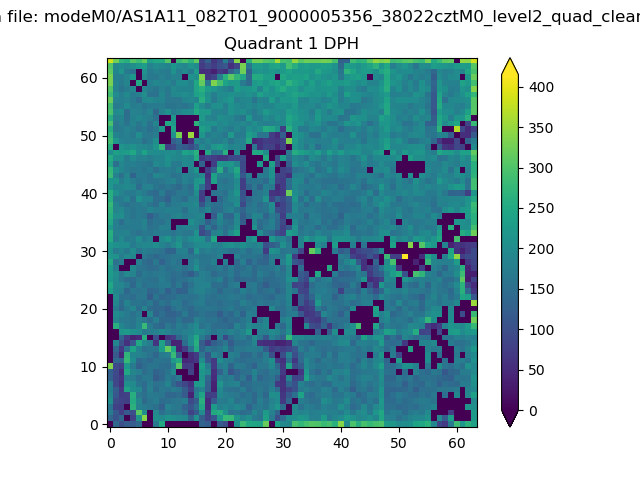 |
Quadrant B |
|---|---|---|---|
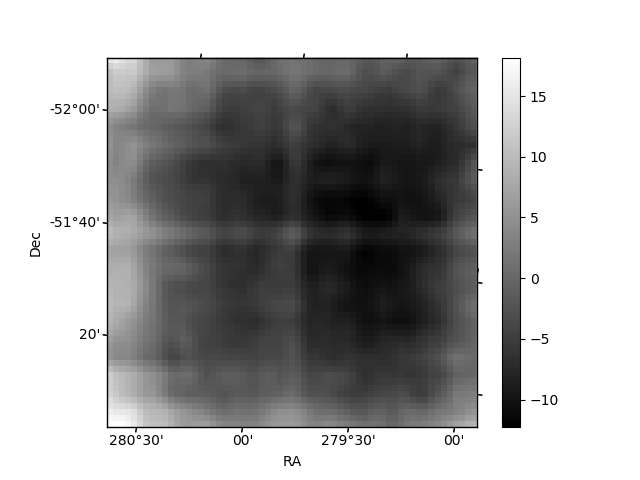
| Quadrant D | 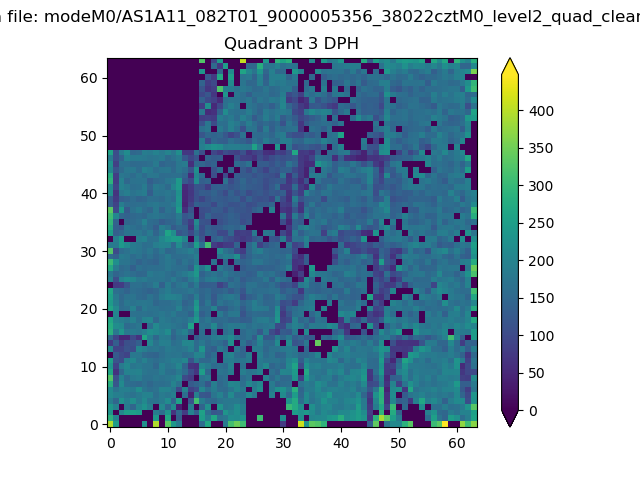 |
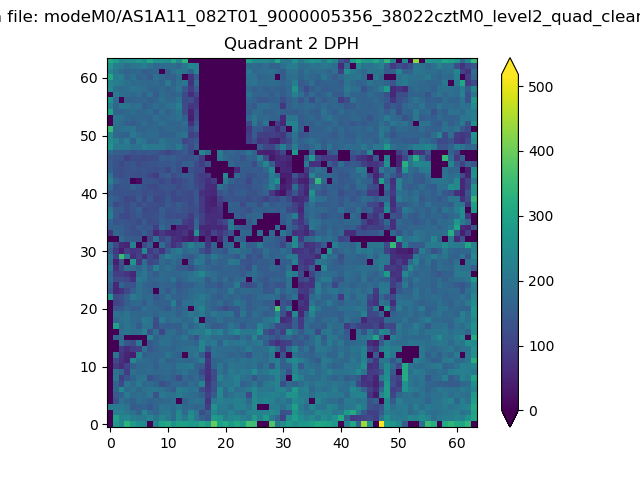 |
Quadrant C |
| Plot type | Count rate plots | Images |
|---|---|---|
| Comparison with Poisson distribution Blue bars denote a histogram of data divided into 1 sec bins. Red curve is a Poisson curve with rate = median count rate of data. |
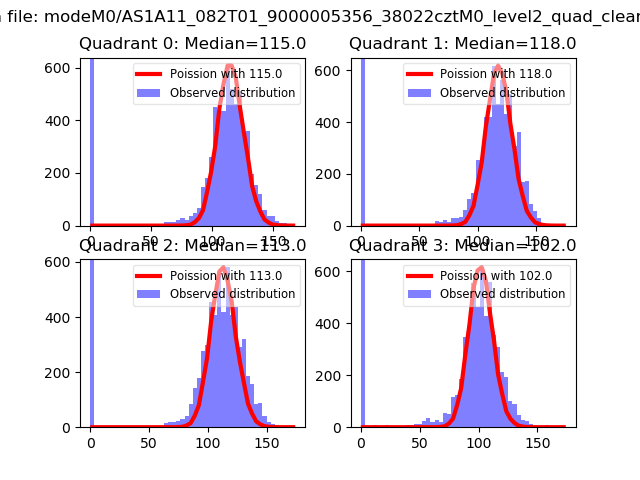 |
 |
| Quadrant-wise count rates Data is divided into 100 sec bins |
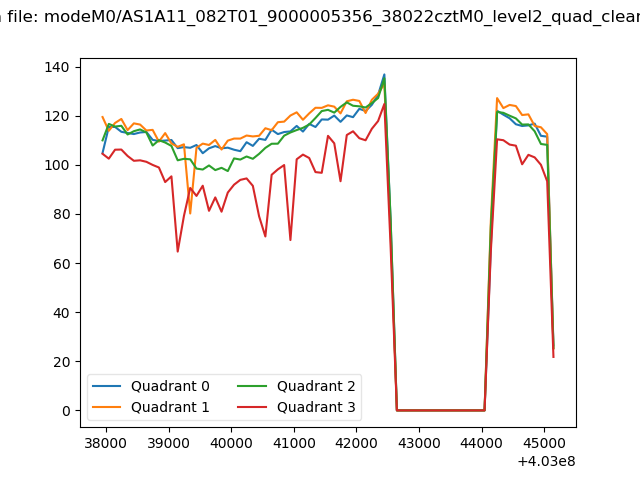 |
|
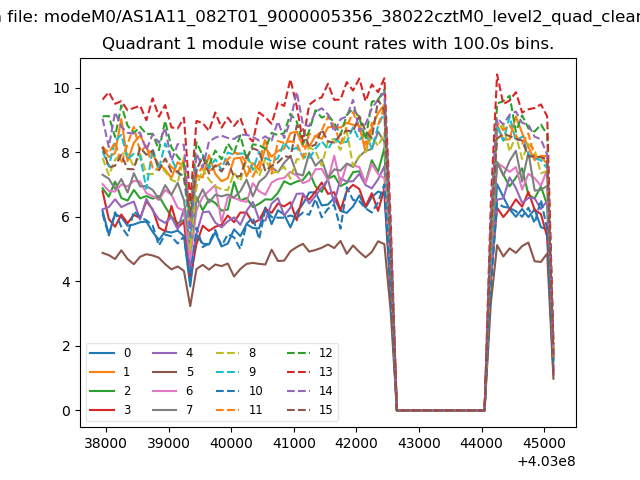
| Module-wise count rates for Quadrant A Data is divided into 100 sec bins |
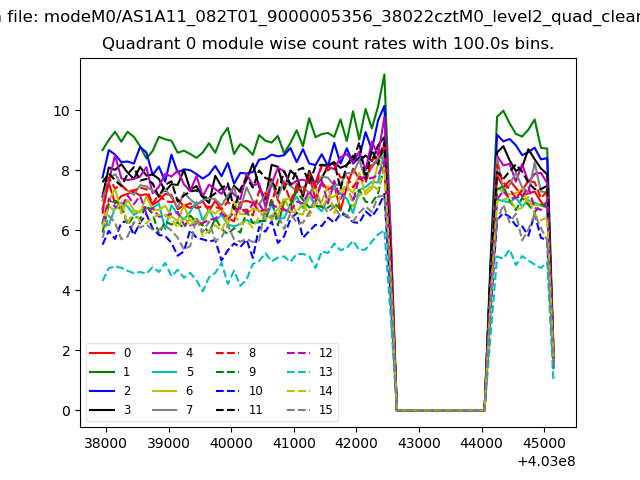 |
 |
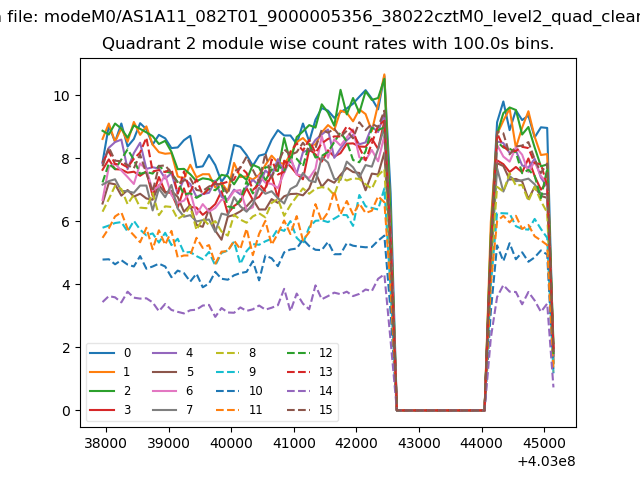
| Module-wise count rates for Quadrant B Data is divided into 100 sec bins |
 |
 |
| Module-wise count rates for Quadrant C Data is divided into 100 sec bins |
 |
 |
| Module-wise count rates for Quadrant D Data is divided into 100 sec bins |
 |
 |
| Parameter | Plot |
|---|---|
| CZT HV Monitor | 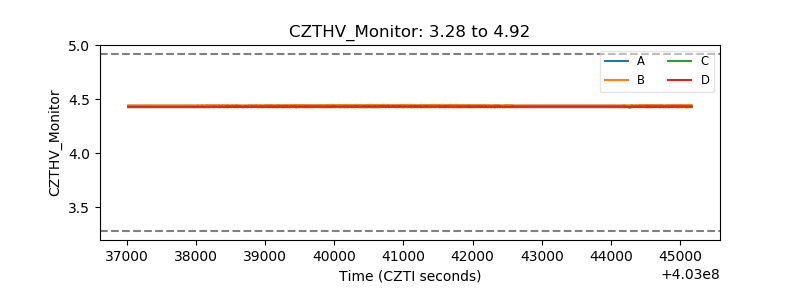 |
| D_VDD | 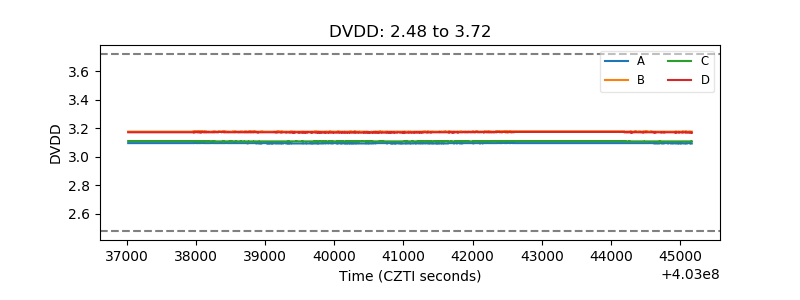 |
| Temperature 1 | 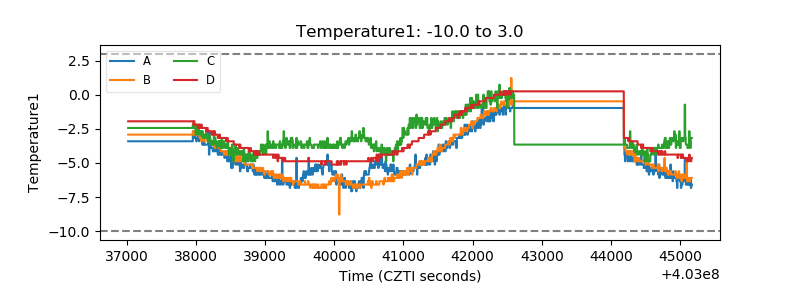 |
| Veto HV Monitor | 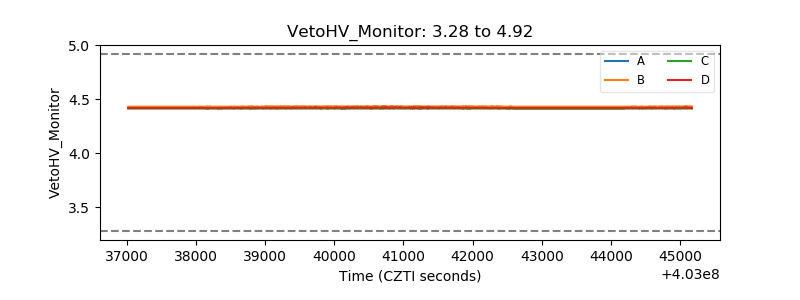 |
| Veto LLD | 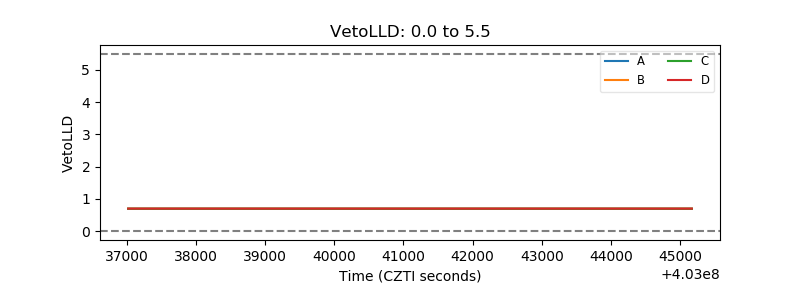 |
| Alpha Counter | 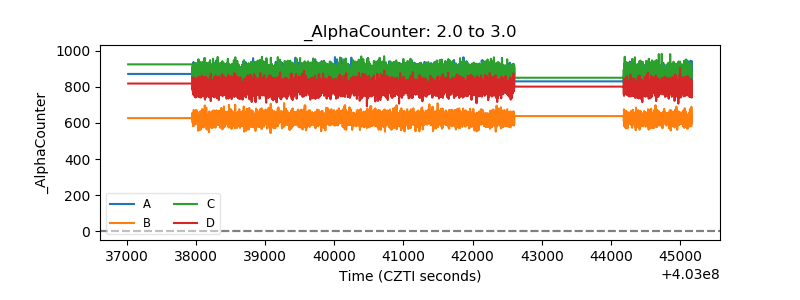 |
| _CPM_Rate | 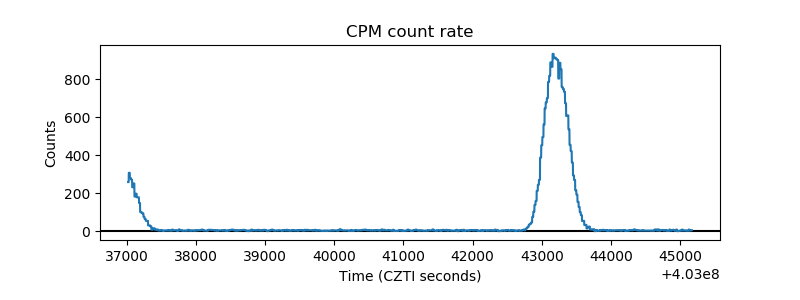 |
| CZT Counter | 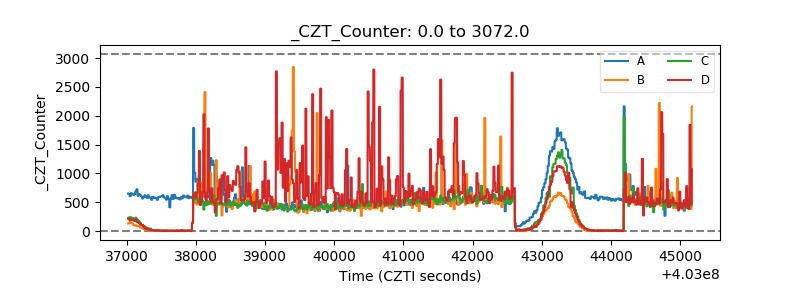 |
| +2.5 Volts monitor | 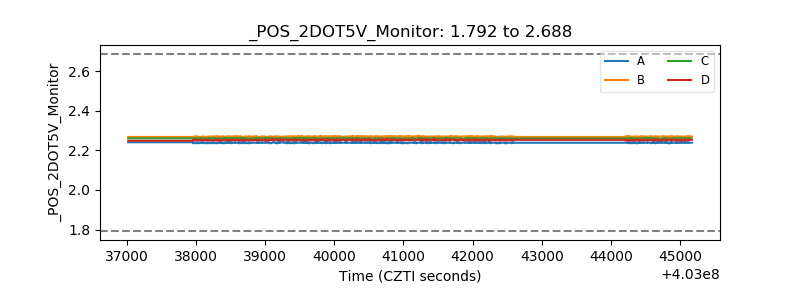 |
| +5 Volts monitor |  |
| _ROLL_ROT | 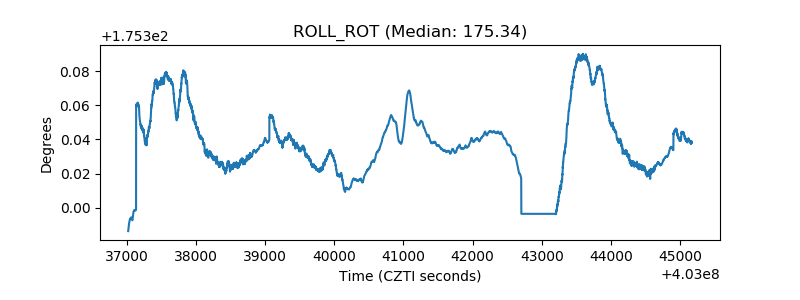 |
| _Roll_DEC | 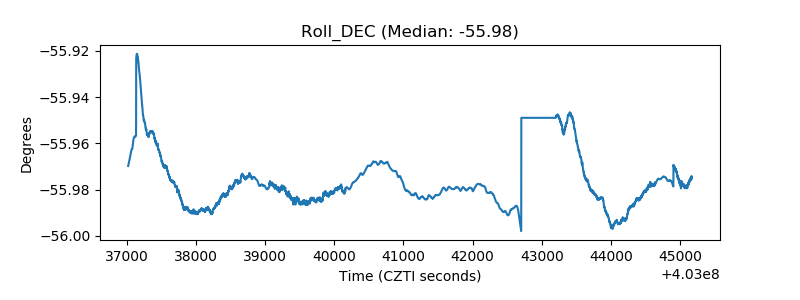 |
| _Roll_RA | 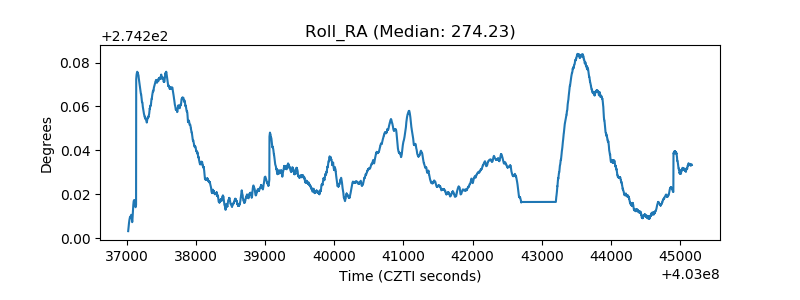 |
| Veto Counter | 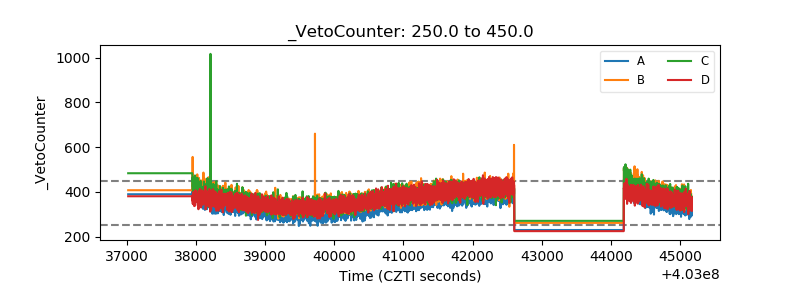 |