| Param | Original file | Final file |
|---|---|---|
| Filename | modeM0/AS1A11_082T01_9000005356_38023cztM0_level2.fits | modeM0/AS1A11_082T01_9000005356_38023cztM0_level2_quad_clean.evt |
| Size (bytes) | 343,592,640 | 94,222,080 |
| Size | 327.7 MB | 89.9 MB |
| Events in quadrant A | 2,835,821 | 637,573 |
| Events in quadrant B | 2,916,080 | 655,639 |
| Events in quadrant C | 2,665,750 | 629,487 |
| Events in quadrant D | 3,875,049 | 547,507 |
| Mode M0 | |||
|---|---|---|---|
| Quadrant | BADHDUFLAG | Total packets | Discarded packets |
| A | 0 | 11800 | 3 |
| B | 0 | 12221 | 2 |
| C | 0 | 11081 | 2 |
| D | 0 | 15132 | 2 |
| Mode SS | |||
|---|---|---|---|
| Quadrant | BADHDUFLAG | Total packets | Discarded packets |
| A | 0 | 112 | 0 |
| B | 0 | 112 | 0 |
| C | 0 | 112 | 0 |
| D | 0 | 112 | 0 |
| Mode M9 | |||
|---|---|---|---|
| Quadrant | BADHDUFLAG | Total packets | Discarded packets |
| A | 0 | 26 | 0 |
| B | 0 | 26 | 0 |
| C | 0 | 26 | 0 |
| D | 0 | 27 | 0 |
| Quadrant | Total seconds | Saturated seconds | Saturation percentage |
|---|---|---|---|
| A | 5468 | 14 | 0.256035% |
| B | 5468 | 61 | 1.115582% |
| C | 5468 | 4 | 0.073153% |
| D | 5468 | 320 | 5.852231% |
Noise dominated data is calculated using 1-second bins in cleaned event files. If a bin has >2000 counts, and if more than 50% of those come from <1% of pixels, then it is considered to be noise-dominated and hence unusable.
| Quadrant | # 1 sec bins | Bins with >0 counts | Bins with >2000 counts | High rate bins dominated by noise | Noise dominated (total time) | Noise dominated (detector-on time) | Marked lightcurve |
|---|---|---|---|---|---|---|---|
| A | 7170 | 5469 | 6 | 6 | 0.08% | 0.11% | 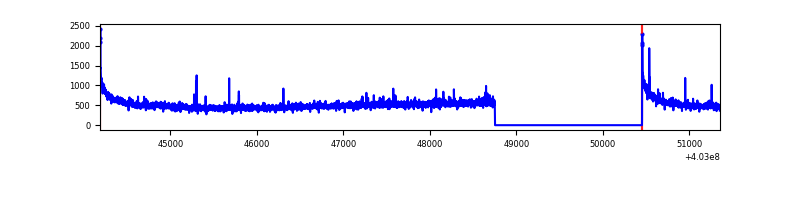 |
| B | 7170 | 5469 | 35 | 35 | 0.49% | 0.64% | 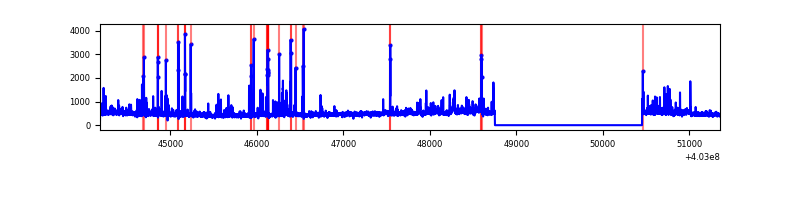 |
| C | 7170 | 5469 | 2 | 2 | 0.03% | 0.04% | 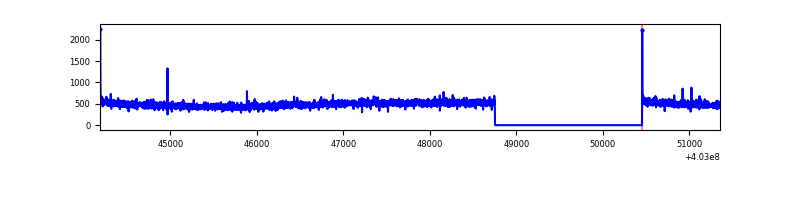 |
| D | 7170 | 5469 | 239 | 239 | 3.33% | 4.37% | 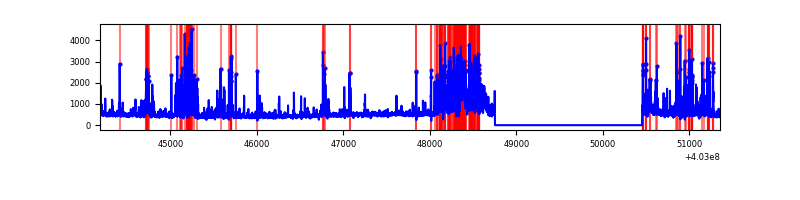 |
Top three noisy pixels from each quadrant. If the there are fewer than three noisy pixels in the level2.evt file, extra rows are filled as -1
| Pixel properties | Quadrant properties | ||||||
|---|---|---|---|---|---|---|---|
| Quadrant | DetID | PixID | Counts | Sigma | Mean | Median | Sigma |
| A | 10 | 83 | 367464 | 2932.14 | 621 | 609 | 125.1 |
| A | 9 | 143 | 18623 | 143.98 | 621 | 609 | 125.1 |
| A | 12 | 189 | 17848 | 137.78 | 621 | 609 | 125.1 |
| B | 5 | 255 | 206676 | 1738.67 | 623 | 606 | 118.5 |
| B | 0 | 213 | 73760 | 617.22 | 623 | 606 | 118.5 |
| B | 5 | 172 | 47772 | 397.95 | 623 | 606 | 118.5 |
| C | 15 | 214 | 231111 | 1611.19 | 614 | 619 | 143.1 |
| C | 3 | 233 | 20790 | 141.0 | 614 | 619 | 143.1 |
| C | 0 | 10 | 9433 | 61.61 | 614 | 619 | 143.1 |
| D | 13 | 171 | 471205 | 3227.62 | 594 | 577 | 145.8 |
| D | 2 | 250 | 298582 | 2043.75 | 594 | 577 | 145.8 |
| D | 13 | 249 | 270208 | 1849.16 | 594 | 577 | 145.8 |
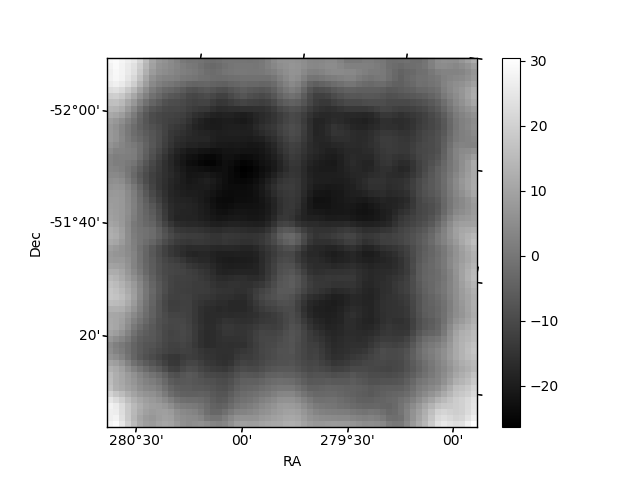
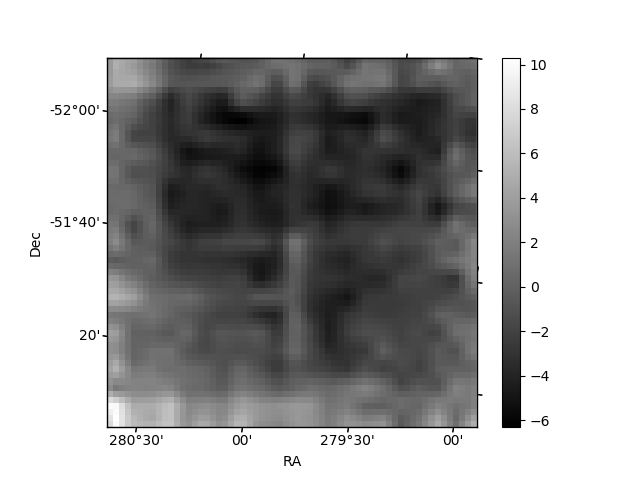
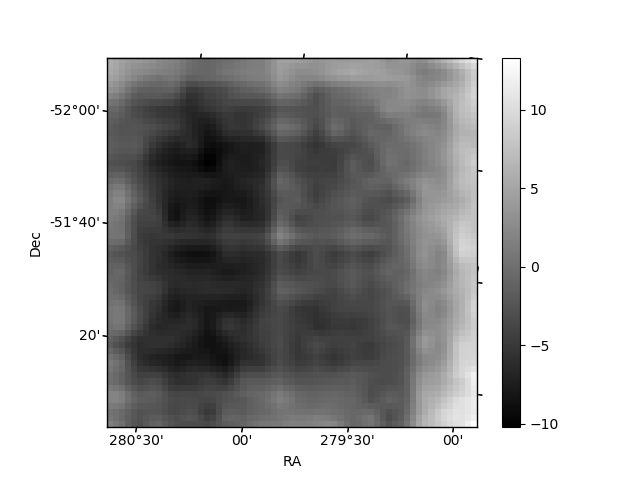
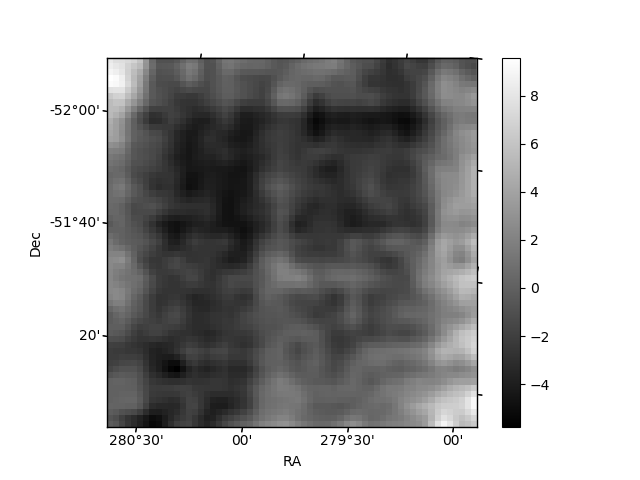
Histogram calculated using DETX and DETY for each event in the final _common_clean file
| Quadrant A | 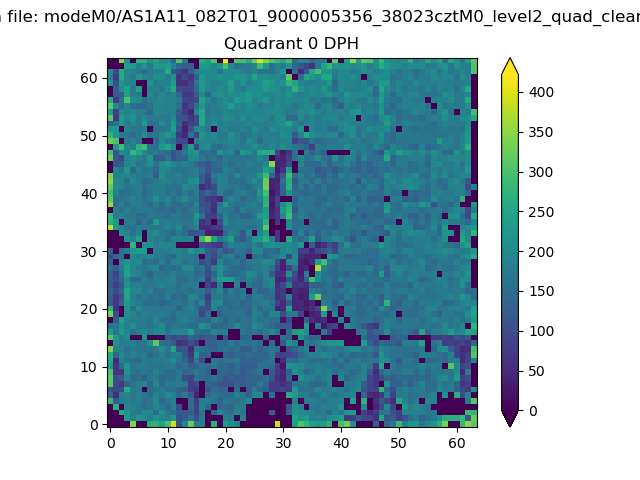 |
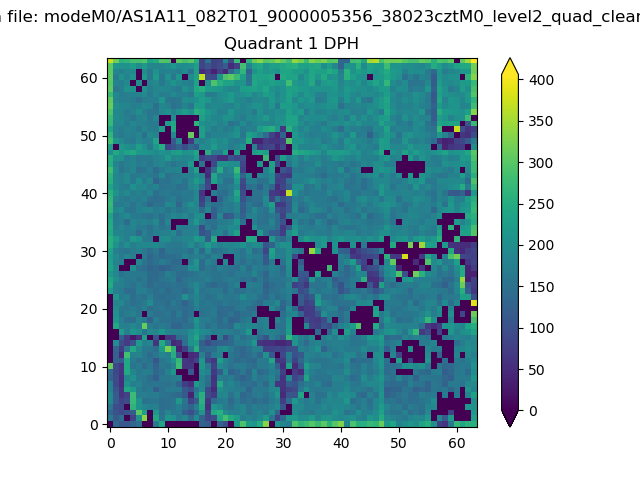 |
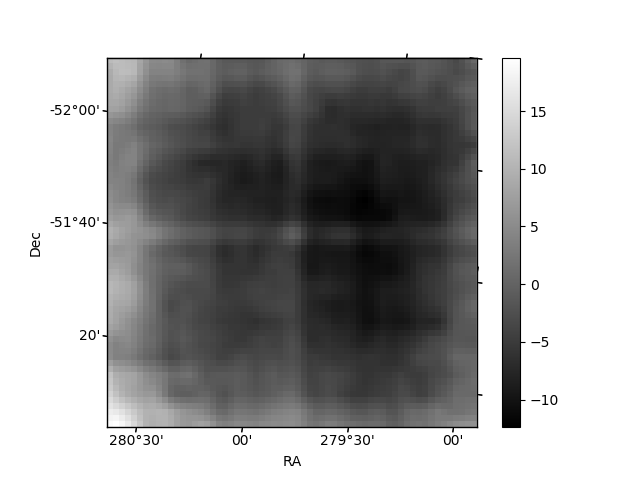
Quadrant B |
|---|---|---|---|
| Quadrant D | 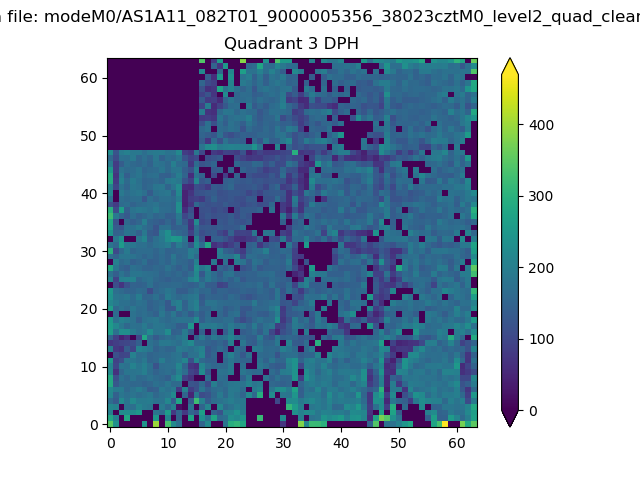 |
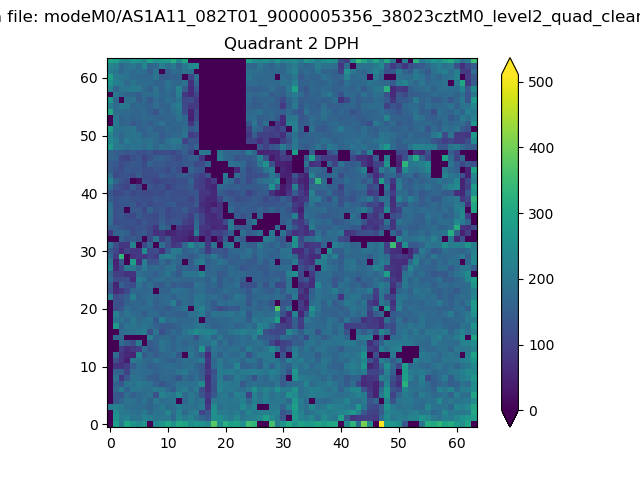 |
Quadrant C |
| Plot type | Count rate plots | Images |
|---|---|---|
| Comparison with Poisson distribution Blue bars denote a histogram of data divided into 1 sec bins. Red curve is a Poisson curve with rate = median count rate of data. |
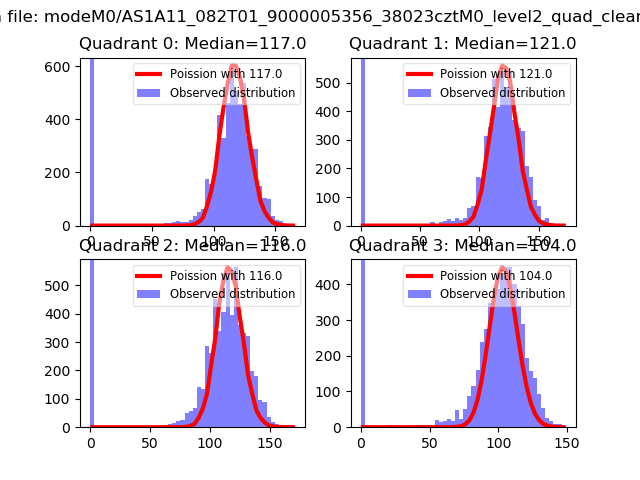 |
 |
| Quadrant-wise count rates Data is divided into 100 sec bins |
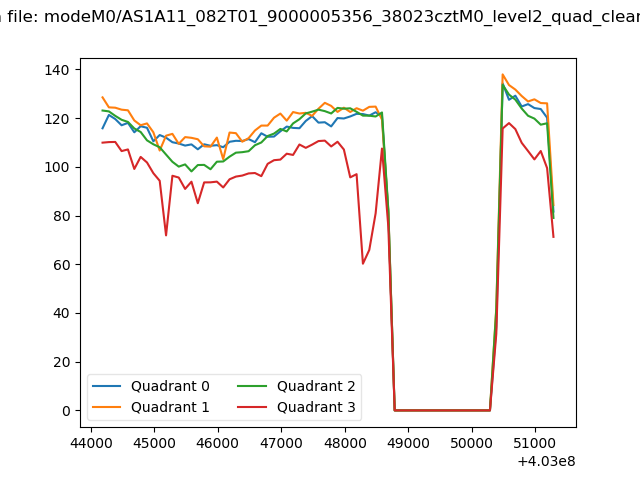 |
|
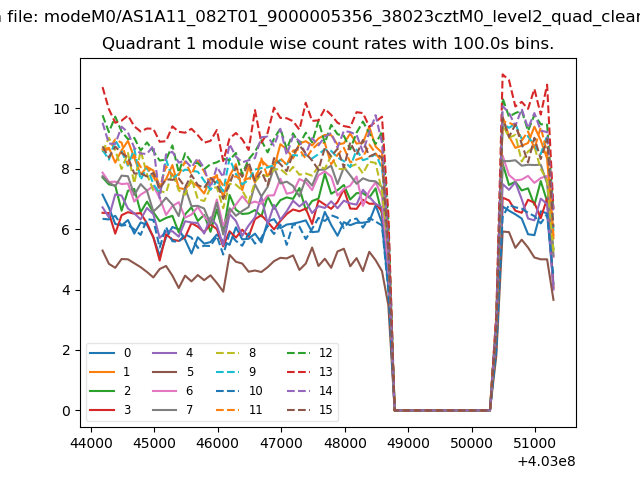
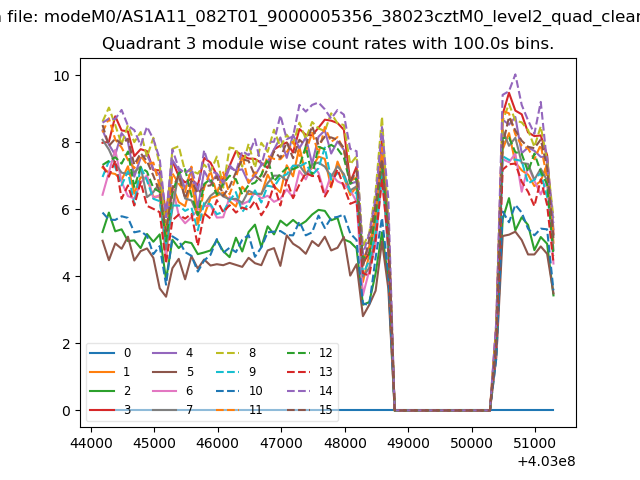
| Module-wise count rates for Quadrant A Data is divided into 100 sec bins |
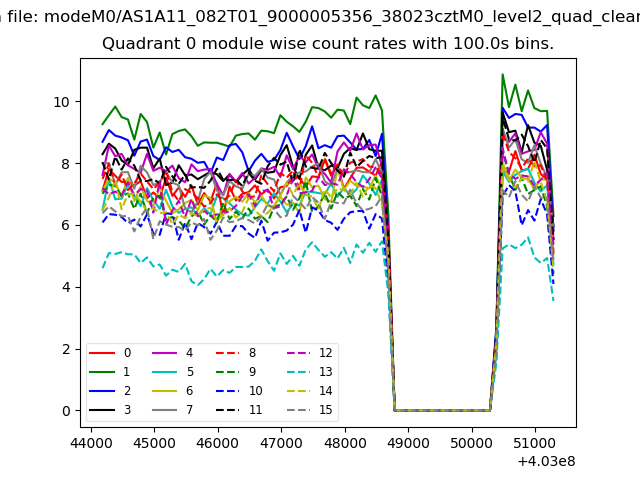 |
 |
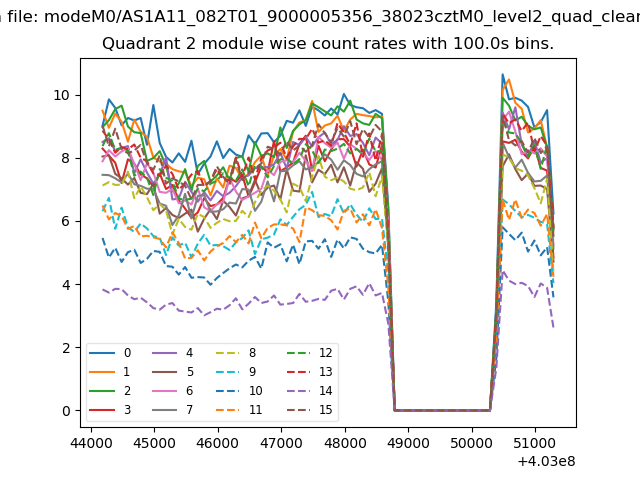
| Module-wise count rates for Quadrant B Data is divided into 100 sec bins |
 |
 |
| Module-wise count rates for Quadrant C Data is divided into 100 sec bins |
 |
 |
| Module-wise count rates for Quadrant D Data is divided into 100 sec bins |
 |
 |
| Parameter | Plot |
|---|---|
| CZT HV Monitor | 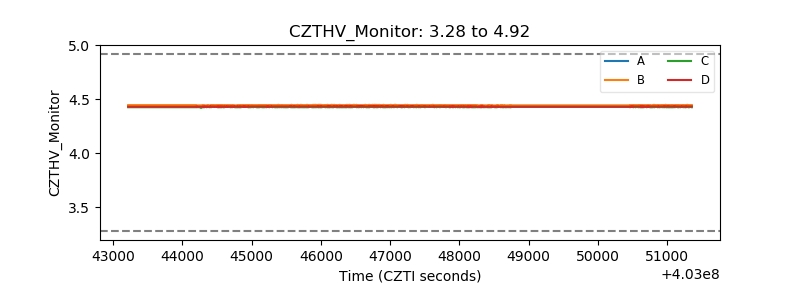 |
| D_VDD | 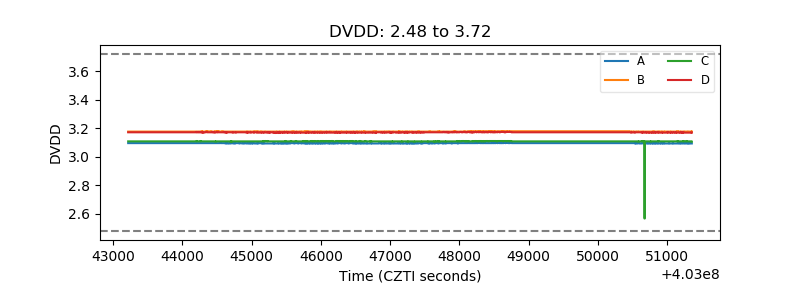 |
| Temperature 1 | 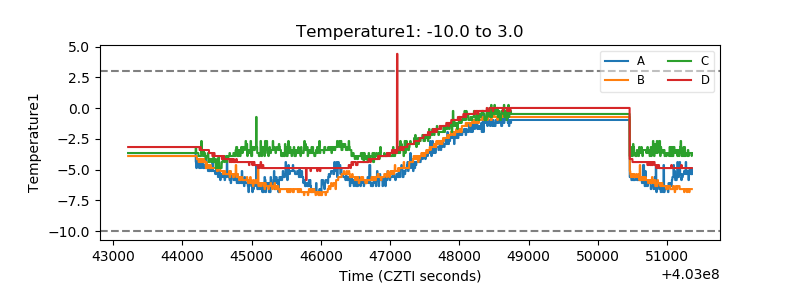 |
| Veto HV Monitor | 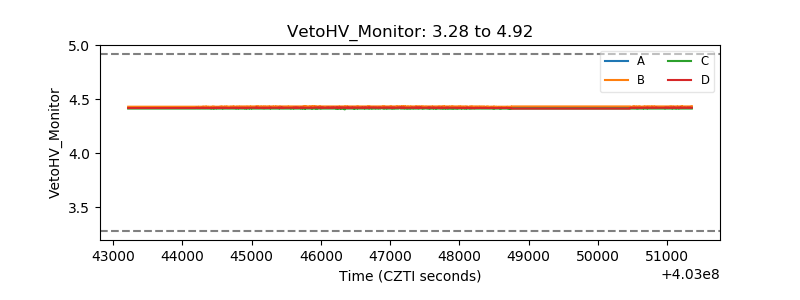 |
| Veto LLD | 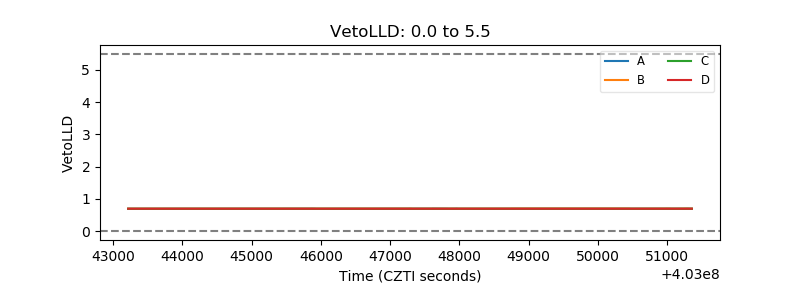 |
| Alpha Counter | 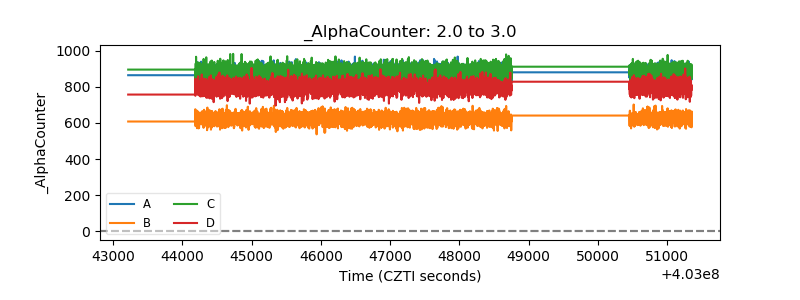 |
| _CPM_Rate | 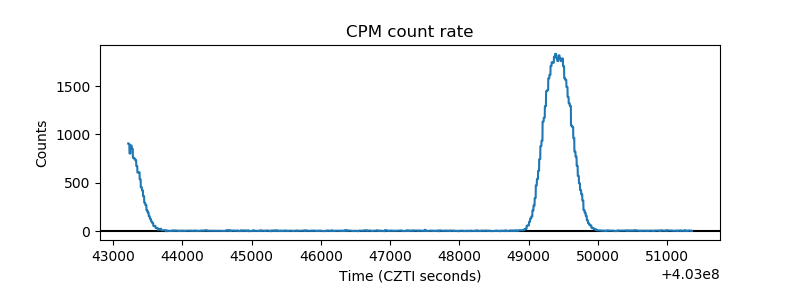 |
| CZT Counter | 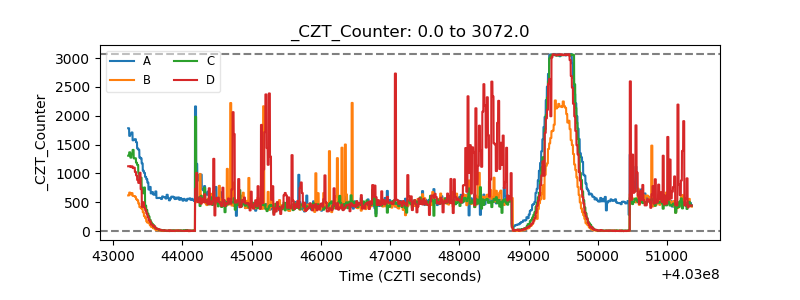 |
| +2.5 Volts monitor | 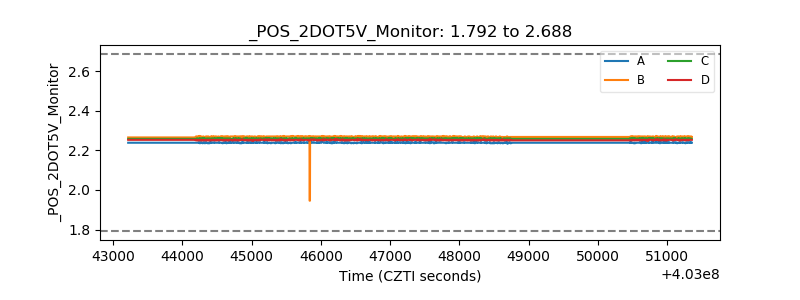 |
| +5 Volts monitor | 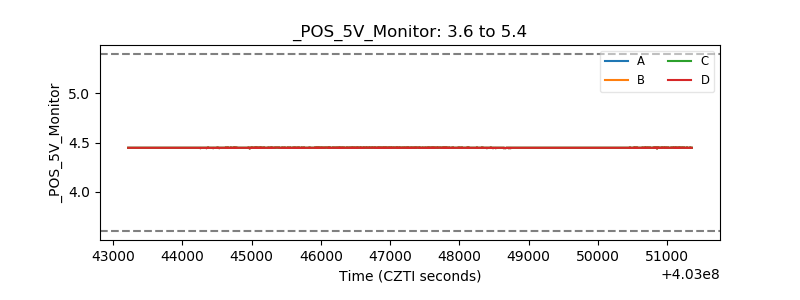 |
| _ROLL_ROT | 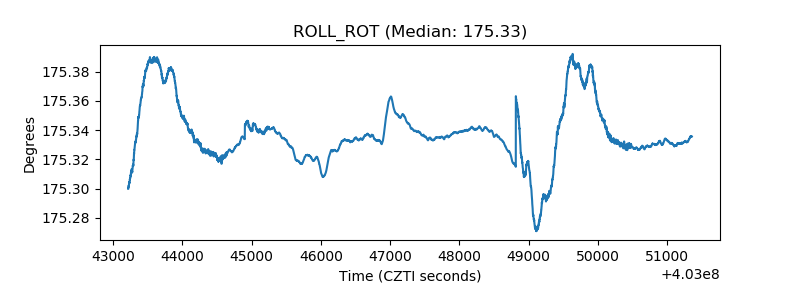 |
| _Roll_DEC | 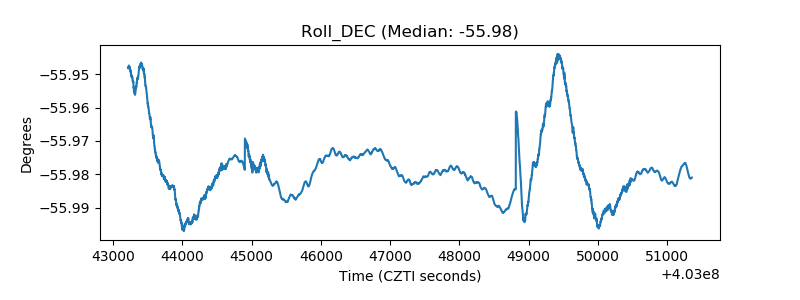 |
| _Roll_RA | 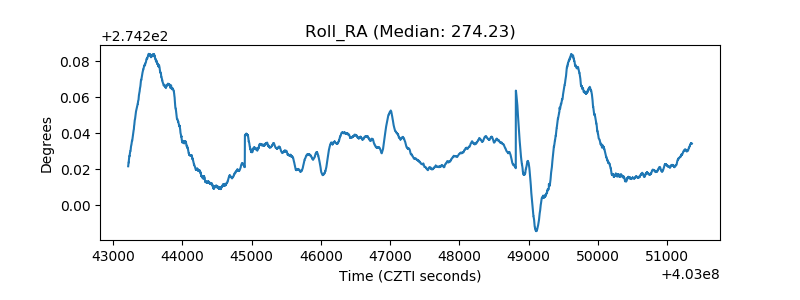 |
| Veto Counter | 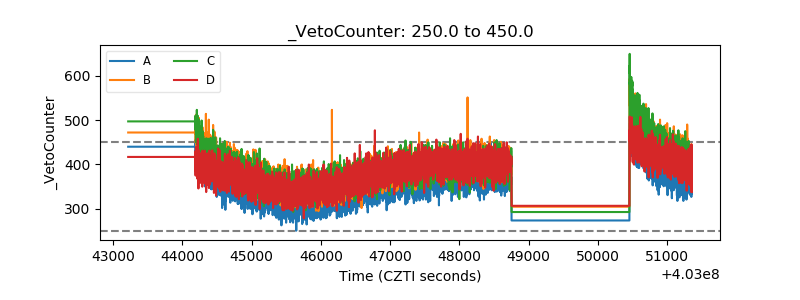 |