| Param | Original file | Final file |
|---|---|---|
| Filename | modeM0/AS1A11_082T01_9000005356_38025cztM0_level2.fits | modeM0/AS1A11_082T01_9000005356_38025cztM0_level2_quad_clean.evt |
| Size (bytes) | 349,755,840 | 98,991,360 |
| Size | 333.6 MB | 94.4 MB |
| Events in quadrant A | 3,041,846 | 670,279 |
| Events in quadrant B | 3,173,921 | 690,516 |
| Events in quadrant C | 2,785,300 | 663,648 |
| Events in quadrant D | 3,520,115 | 590,687 |
| Mode M0 | |||
|---|---|---|---|
| Quadrant | BADHDUFLAG | Total packets | Discarded packets |
| A | 0 | 12373 | 3 |
| B | 0 | 12912 | 2 |
| C | 0 | 11310 | 2 |
| D | 0 | 13976 | 2 |
| Mode SS | |||
|---|---|---|---|
| Quadrant | BADHDUFLAG | Total packets | Discarded packets |
| A | 0 | 110 | 0 |
| B | 0 | 110 | 0 |
| C | 0 | 110 | 0 |
| D | 0 | 110 | 0 |
| Mode M9 | |||
|---|---|---|---|
| Quadrant | BADHDUFLAG | Total packets | Discarded packets |
| A | 0 | 27 | 0 |
| B | 0 | 27 | 0 |
| C | 0 | 27 | 0 |
| D | 0 | 27 | 0 |
| Quadrant | Total seconds | Saturated seconds | Saturation percentage |
|---|---|---|---|
| A | 5467 | 30 | 0.548747% |
| B | 5467 | 100 | 1.829157% |
| C | 5467 | 10 | 0.182916% |
| D | 5467 | 178 | 3.255899% |
Noise dominated data is calculated using 1-second bins in cleaned event files. If a bin has >2000 counts, and if more than 50% of those come from <1% of pixels, then it is considered to be noise-dominated and hence unusable.
| Quadrant | # 1 sec bins | Bins with >0 counts | Bins with >2000 counts | High rate bins dominated by noise | Noise dominated (total time) | Noise dominated (detector-on time) | Marked lightcurve |
|---|---|---|---|---|---|---|---|
| A | 7319 | 5468 | 17 | 17 | 0.23% | 0.31% | 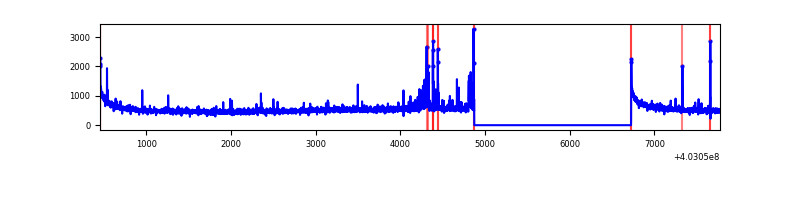 |
| B | 7319 | 5468 | 68 | 68 | 0.93% | 1.24% | 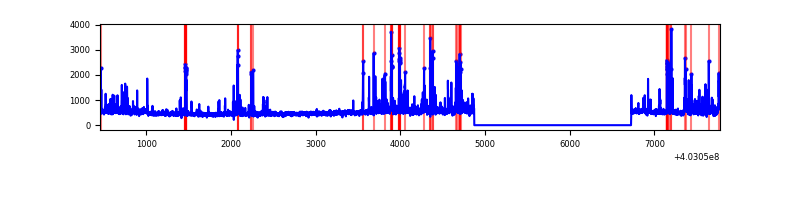 |
| C | 7319 | 5468 | 7 | 7 | 0.10% | 0.13% | 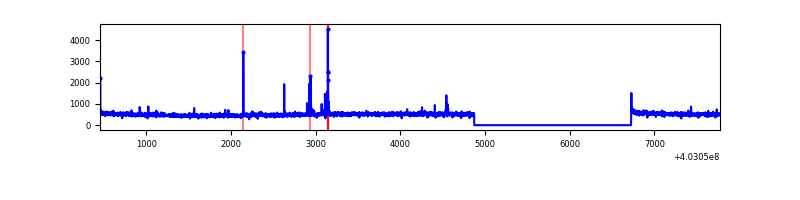 |
| D | 7319 | 5468 | 143 | 143 | 1.95% | 2.62% | 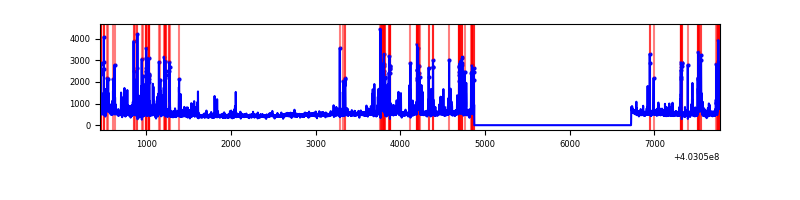 |
Top three noisy pixels from each quadrant. If the there are fewer than three noisy pixels in the level2.evt file, extra rows are filled as -1
| Pixel properties | Quadrant properties | ||||||
|---|---|---|---|---|---|---|---|
| Quadrant | DetID | PixID | Counts | Sigma | Mean | Median | Sigma |
| A | 10 | 83 | 376591 | 2914.53 | 640 | 629 | 129.0 |
| A | 12 | 16 | 121197 | 934.67 | 640 | 629 | 129.0 |
| A | 12 | 194 | 22261 | 167.7 | 640 | 629 | 129.0 |
| B | 5 | 255 | 211266 | 1727.17 | 641 | 624 | 122.0 |
| B | 5 | 172 | 152906 | 1248.64 | 641 | 624 | 122.0 |
| B | 4 | 171 | 103747 | 845.56 | 641 | 624 | 122.0 |
| C | 15 | 214 | 232939 | 1595.67 | 633 | 638 | 145.6 |
| C | 14 | 254 | 50437 | 342.07 | 633 | 638 | 145.6 |
| C | 0 | 10 | 9268 | 59.28 | 633 | 638 | 145.6 |
| D | 13 | 249 | 320345 | 2123.98 | 620 | 603 | 150.5 |
| D | 2 | 250 | 256456 | 1699.58 | 620 | 603 | 150.5 |
| D | 7 | 223 | 151973 | 1005.52 | 620 | 603 | 150.5 |
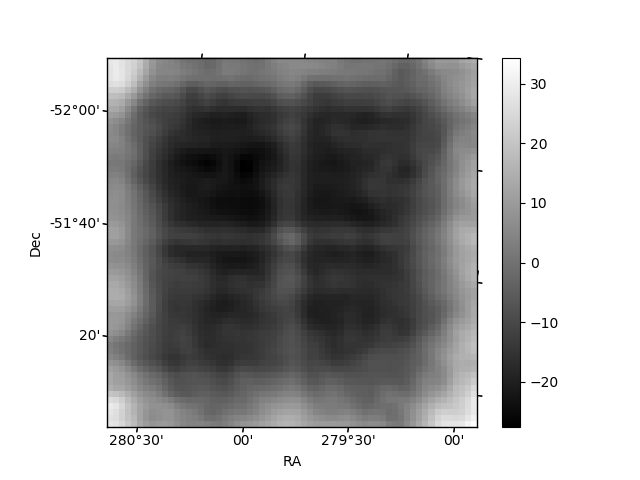
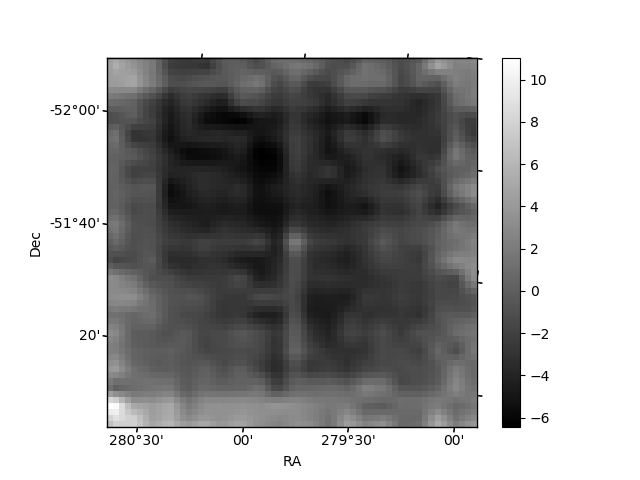
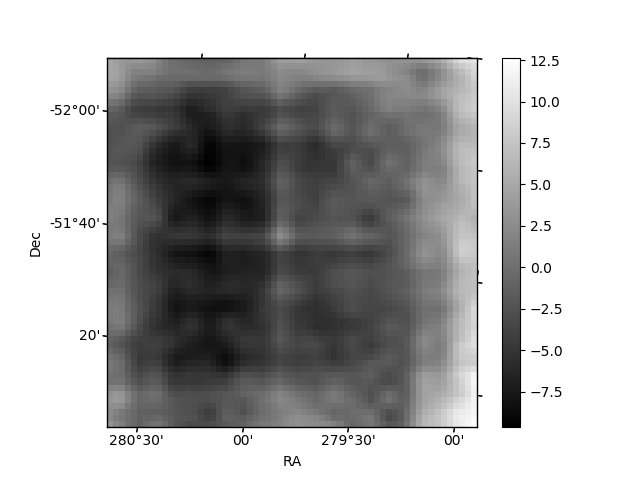
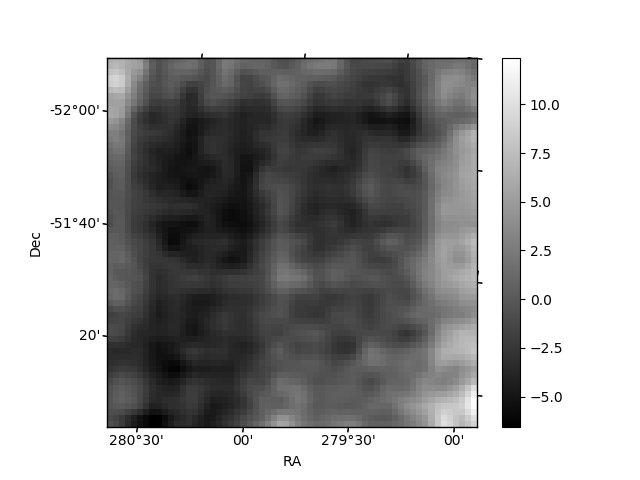
Histogram calculated using DETX and DETY for each event in the final _common_clean file
| Quadrant A | 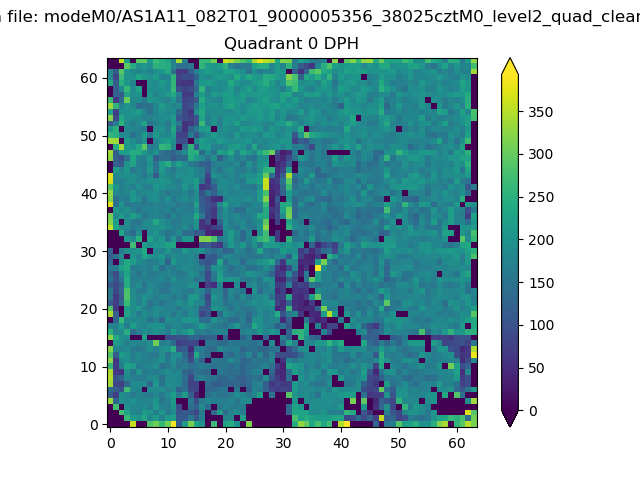 |
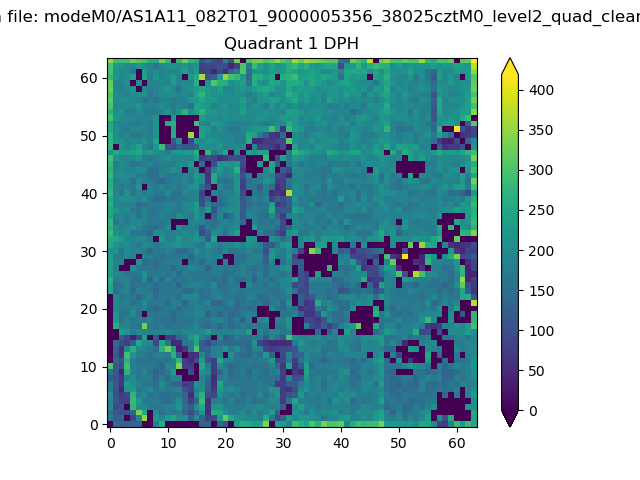 |
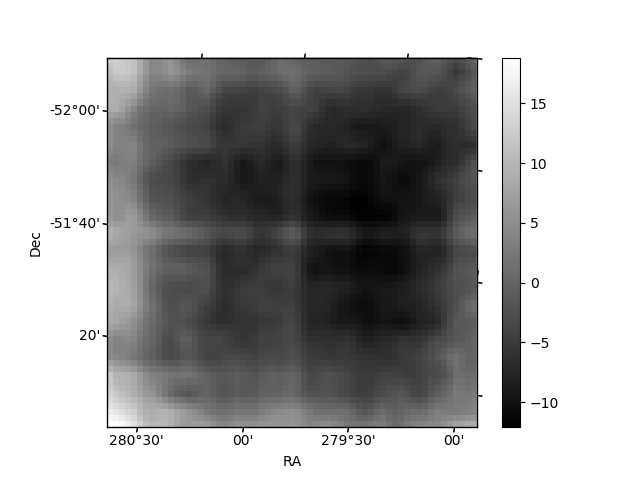
Quadrant B |
|---|---|---|---|
| Quadrant D | 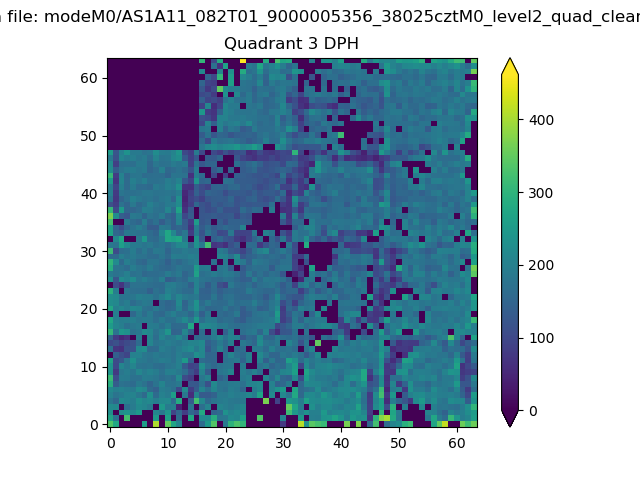 |
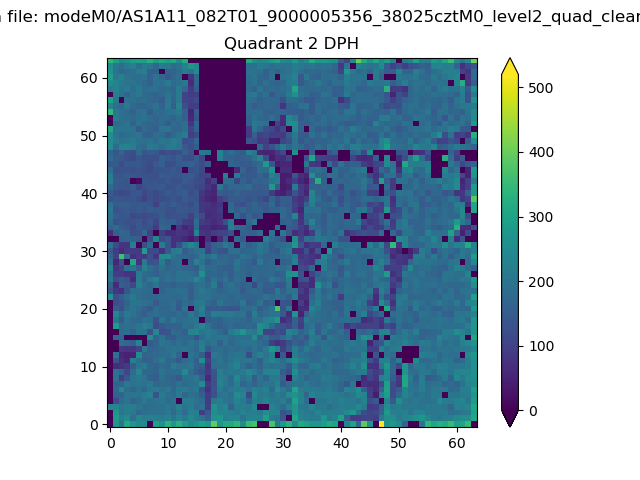 |
Quadrant C |
| Plot type | Count rate plots | Images |
|---|---|---|
| Comparison with Poisson distribution Blue bars denote a histogram of data divided into 1 sec bins. Red curve is a Poisson curve with rate = median count rate of data. |
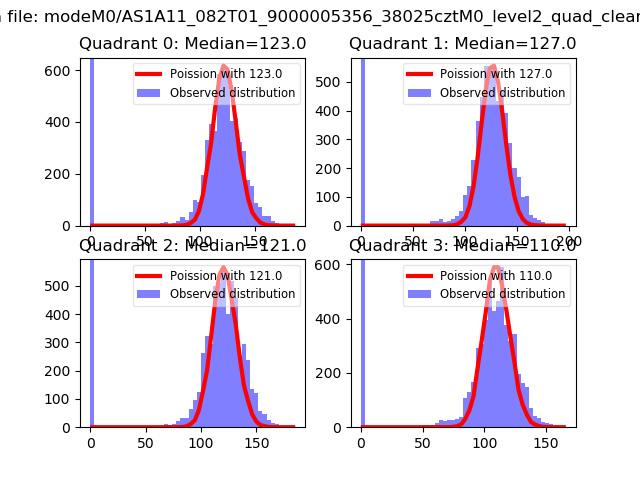 |
 |
| Quadrant-wise count rates Data is divided into 100 sec bins |
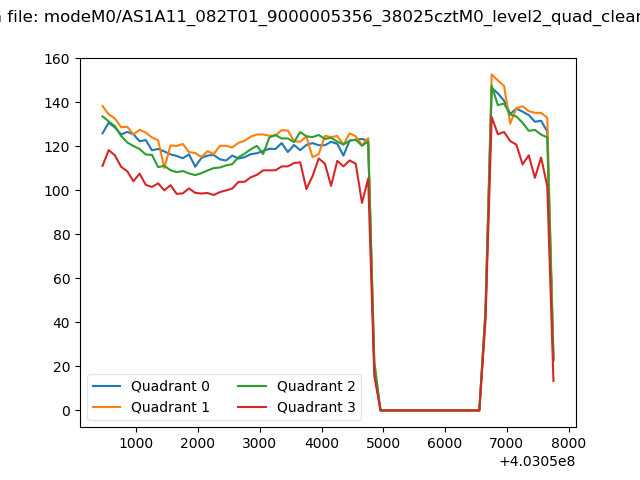 |
|
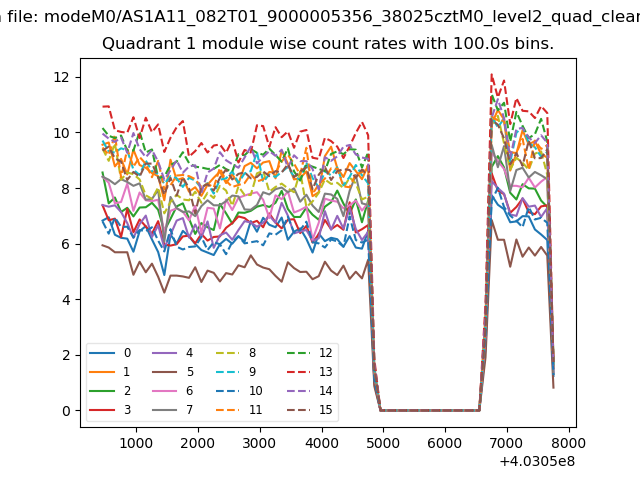
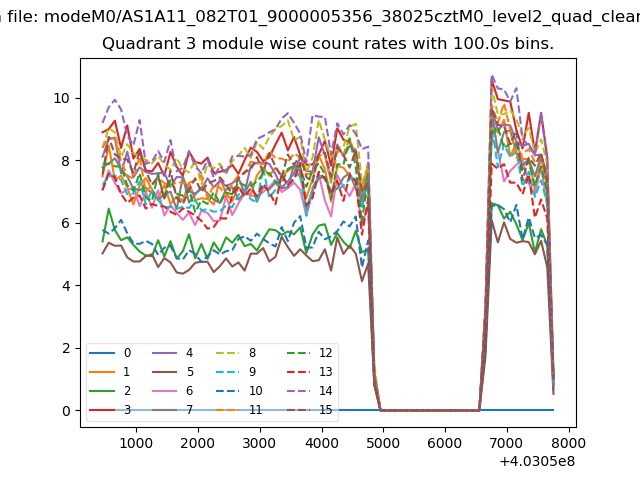
| Module-wise count rates for Quadrant A Data is divided into 100 sec bins |
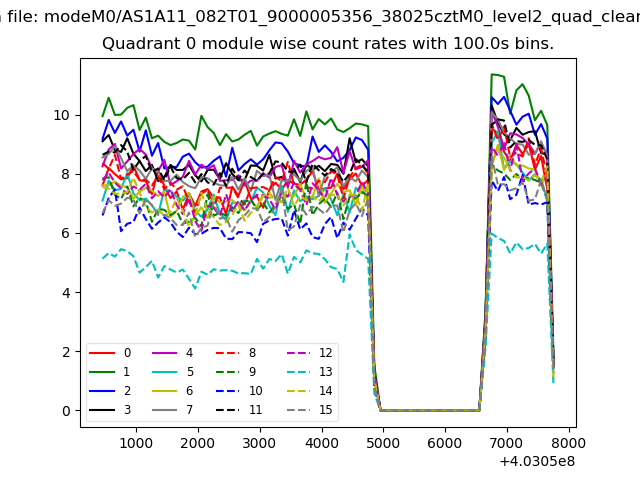 |
 |
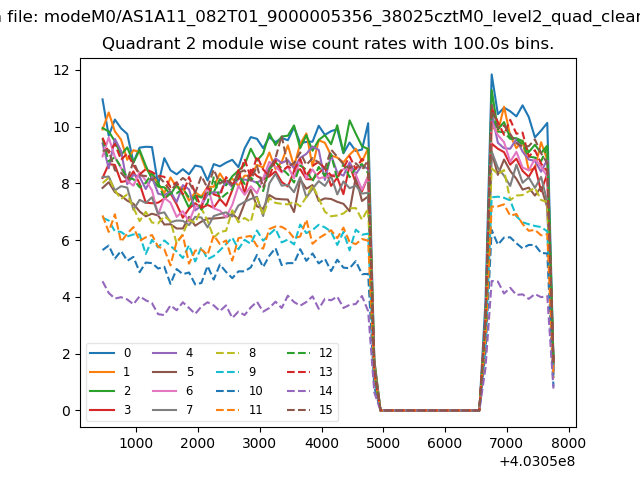
| Module-wise count rates for Quadrant B Data is divided into 100 sec bins |
 |
 |
| Module-wise count rates for Quadrant C Data is divided into 100 sec bins |
 |
 |
| Module-wise count rates for Quadrant D Data is divided into 100 sec bins |
 |
 |
| Parameter | Plot |
|---|---|
| CZT HV Monitor | 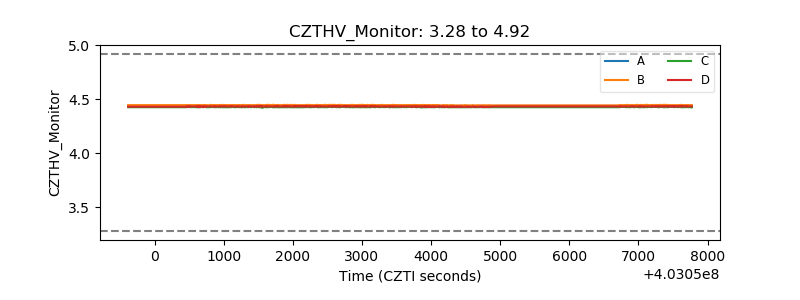 |
| D_VDD | 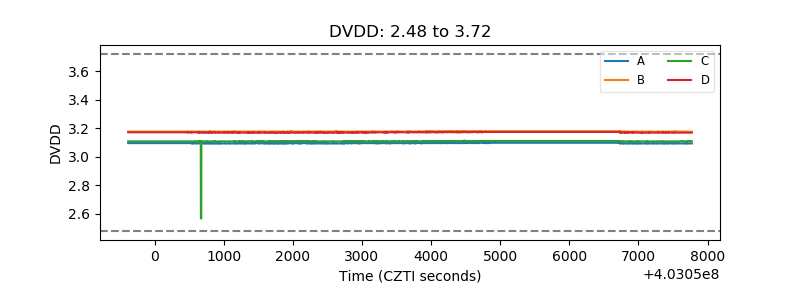 |
| Temperature 1 | 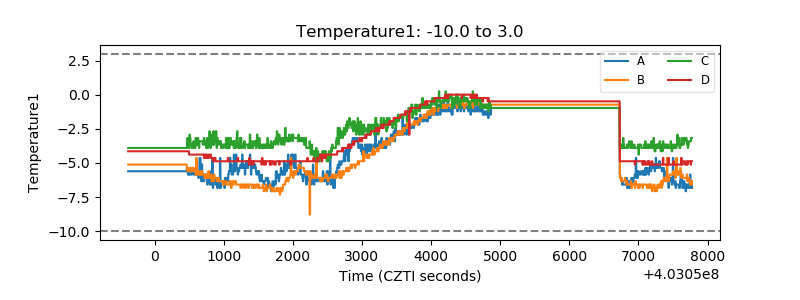 |
| Veto HV Monitor | 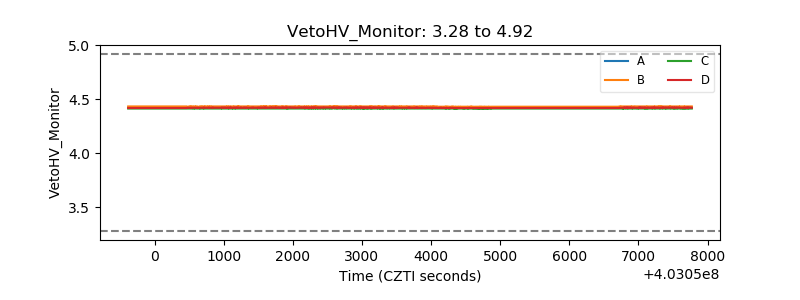 |
| Veto LLD | 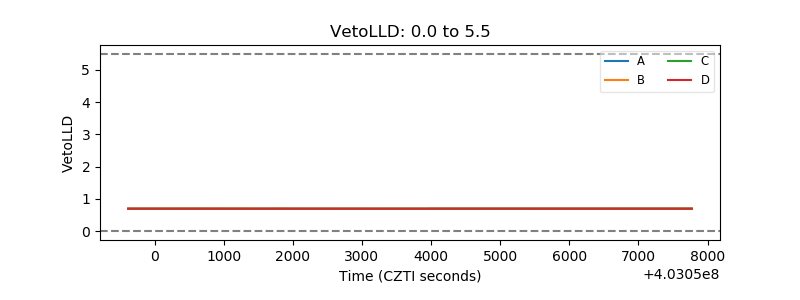 |
| Alpha Counter | 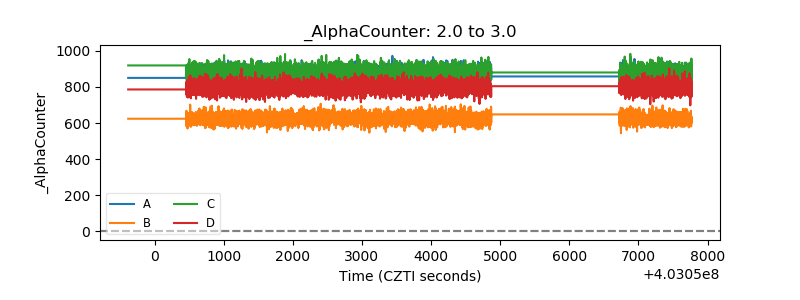 |
| _CPM_Rate | 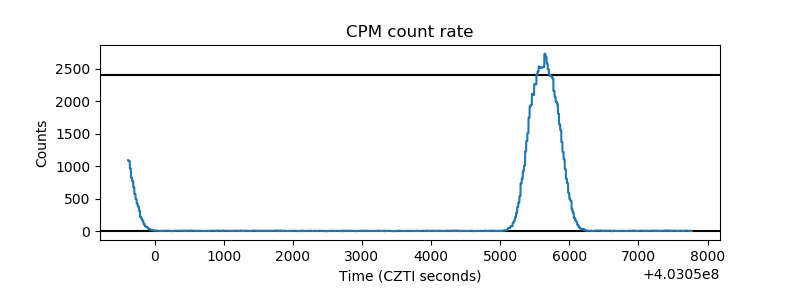 |
| CZT Counter | 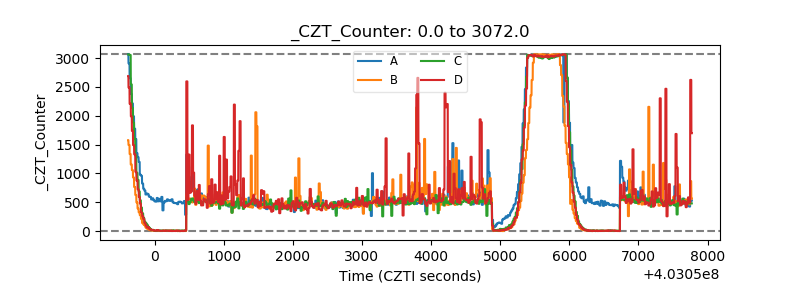 |
| +2.5 Volts monitor | 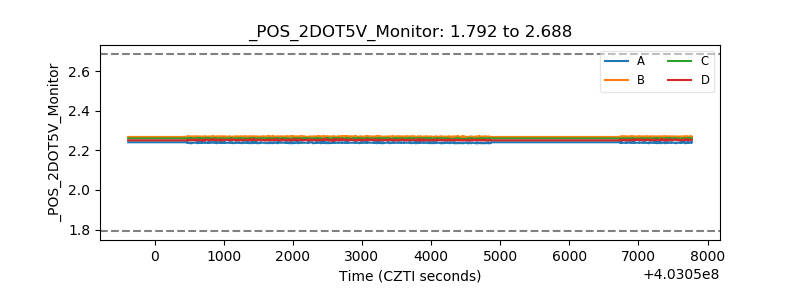 |
| +5 Volts monitor | 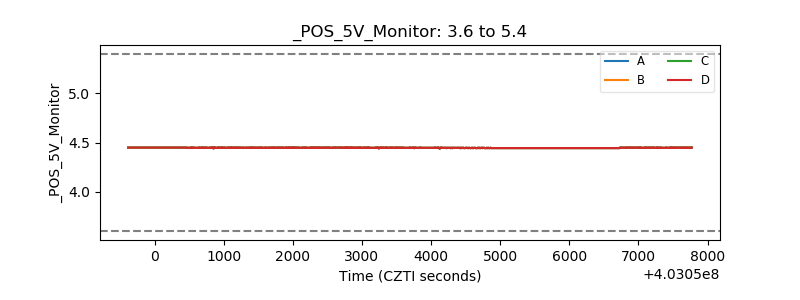 |
| _ROLL_ROT | 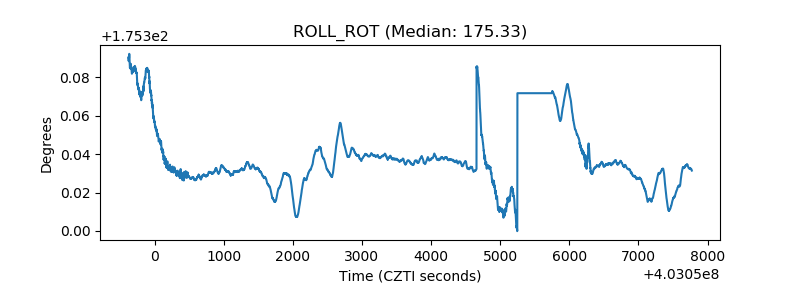 |
| _Roll_DEC | 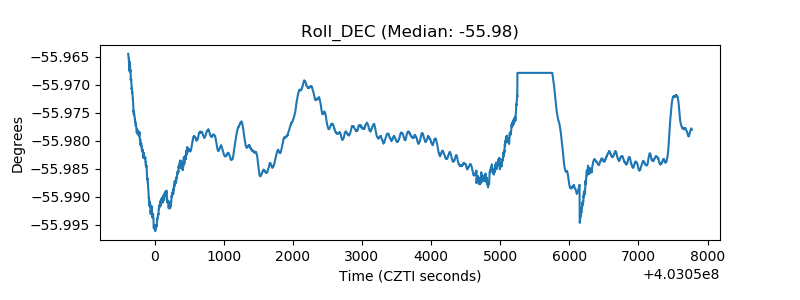 |
| _Roll_RA |  |
| Veto Counter | 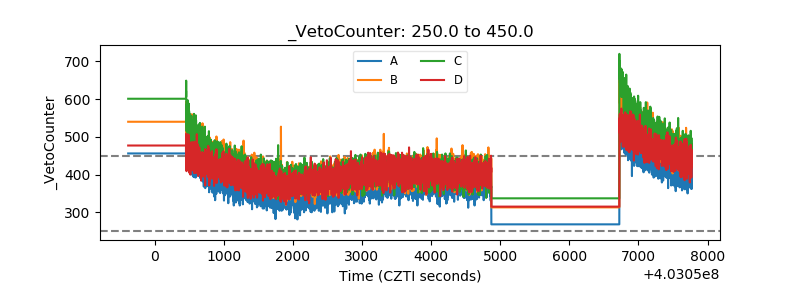 |