| Param | Original file | Final file |
|---|---|---|
| Filename | modeM0/AS1A11_082T01_9000005356_38026cztM0_level2.fits | modeM0/AS1A11_082T01_9000005356_38026cztM0_level2_quad_clean.evt |
| Size (bytes) | 342,175,680 | 101,952,000 |
| Size | 326.3 MB | 97.2 MB |
| Events in quadrant A | 3,158,665 | 688,947 |
| Events in quadrant B | 2,988,879 | 716,811 |
| Events in quadrant C | 2,840,338 | 691,124 |
| Events in quadrant D | 3,265,503 | 619,250 |
| Mode M0 | |||
|---|---|---|---|
| Quadrant | BADHDUFLAG | Total packets | Discarded packets |
| A | 0 | 12496 | 3 |
| B | 0 | 12110 | 2 |
| C | 0 | 11262 | 2 |
| D | 0 | 12932 | 2 |
| Mode SS | |||
|---|---|---|---|
| Quadrant | BADHDUFLAG | Total packets | Discarded packets |
| A | 0 | 108 | 0 |
| B | 0 | 108 | 0 |
| C | 0 | 108 | 0 |
| D | 0 | 108 | 0 |
| Mode M9 | |||
|---|---|---|---|
| Quadrant | BADHDUFLAG | Total packets | Discarded packets |
| A | 0 | 28 | 0 |
| B | 0 | 28 | 0 |
| C | 0 | 28 | 0 |
| D | 0 | 29 | 0 |
| Quadrant | Total seconds | Saturated seconds | Saturation percentage |
|---|---|---|---|
| A | 5304 | 50 | 0.942685% |
| B | 5304 | 61 | 1.150075% |
| C | 5304 | 13 | 0.245098% |
| D | 5304 | 105 | 1.979638% |
Noise dominated data is calculated using 1-second bins in cleaned event files. If a bin has >2000 counts, and if more than 50% of those come from <1% of pixels, then it is considered to be noise-dominated and hence unusable.
| Quadrant | # 1 sec bins | Bins with >0 counts | Bins with >2000 counts | High rate bins dominated by noise | Noise dominated (total time) | Noise dominated (detector-on time) | Marked lightcurve |
|---|---|---|---|---|---|---|---|
| A | 7277 | 5305 | 32 | 32 | 0.44% | 0.60% | 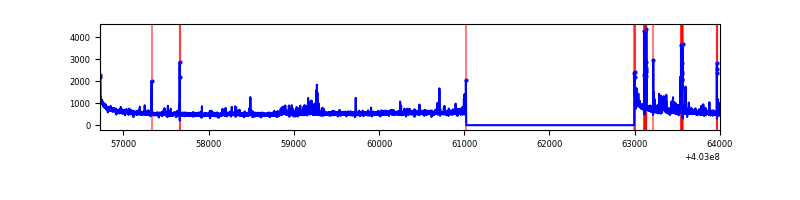 |
| B | 7277 | 5305 | 38 | 38 | 0.52% | 0.72% | 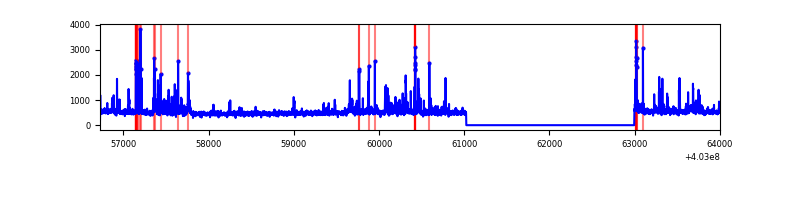 |
| C | 7277 | 5305 | 5 | 5 | 0.07% | 0.09% | 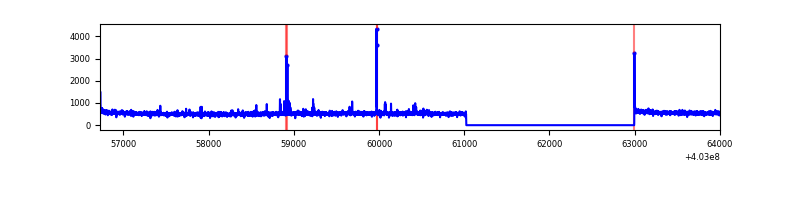 |
| D | 7277 | 5305 | 75 | 75 | 1.03% | 1.41% | 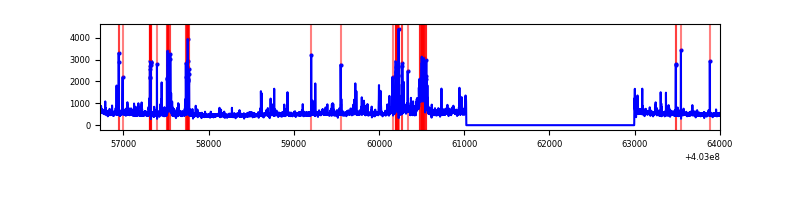 |
Top three noisy pixels from each quadrant. If the there are fewer than three noisy pixels in the level2.evt file, extra rows are filled as -1
| Pixel properties | Quadrant properties | ||||||
|---|---|---|---|---|---|---|---|
| Quadrant | DetID | PixID | Counts | Sigma | Mean | Median | Sigma |
| A | 10 | 83 | 361984 | 2789.9 | 646 | 634 | 129.5 |
| A | 12 | 16 | 138274 | 1062.69 | 646 | 634 | 129.5 |
| A | 9 | 143 | 109898 | 843.6 | 646 | 634 | 129.5 |
| B | 5 | 172 | 160357 | 1319.98 | 648 | 631 | 121.0 |
| B | 5 | 255 | 101163 | 830.8 | 648 | 631 | 121.0 |
| B | 5 | 200 | 45444 | 370.34 | 648 | 631 | 121.0 |
| C | 15 | 214 | 227183 | 1540.47 | 645 | 650 | 147.1 |
| C | 14 | 254 | 56740 | 381.42 | 645 | 650 | 147.1 |
| C | 3 | 233 | 14521 | 94.33 | 645 | 650 | 147.1 |
| D | 2 | 250 | 234918 | 1538.04 | 632 | 616 | 152.3 |
| D | 13 | 249 | 183569 | 1200.97 | 632 | 616 | 152.3 |
| D | 7 | 223 | 152327 | 995.89 | 632 | 616 | 152.3 |
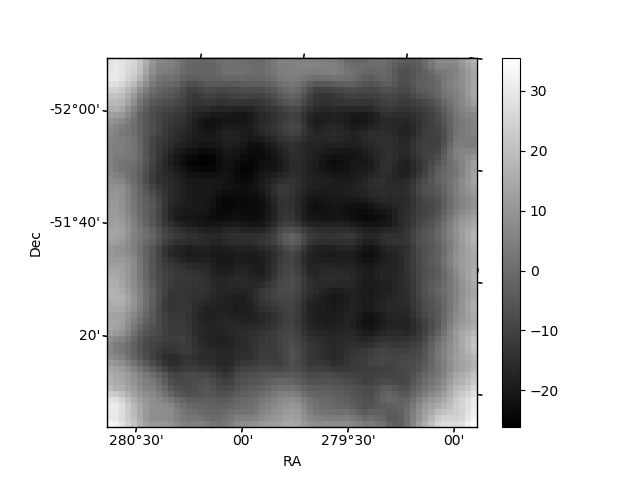
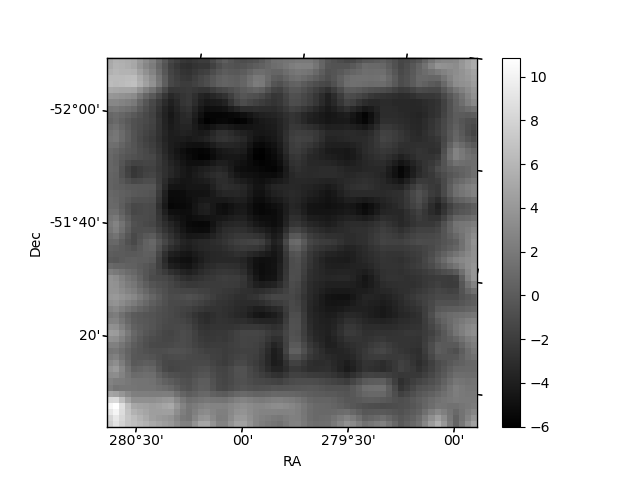
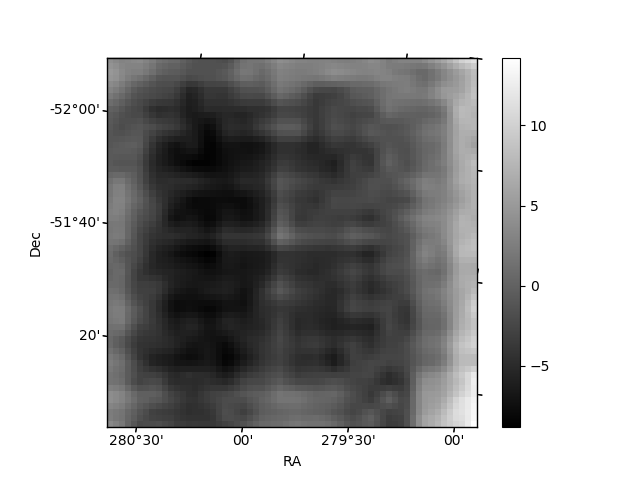
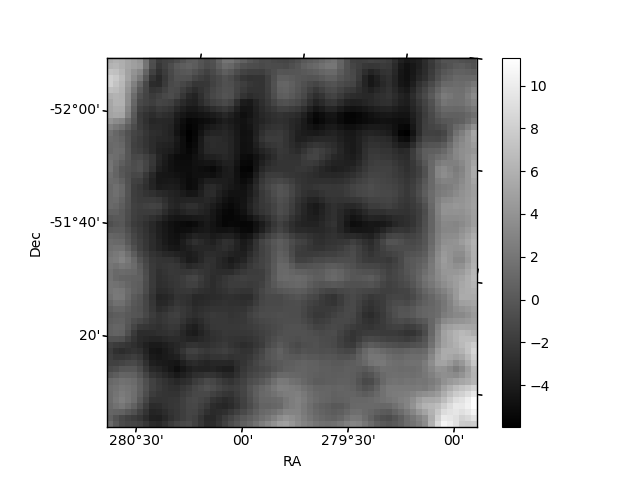
Histogram calculated using DETX and DETY for each event in the final _common_clean file
| Quadrant A | 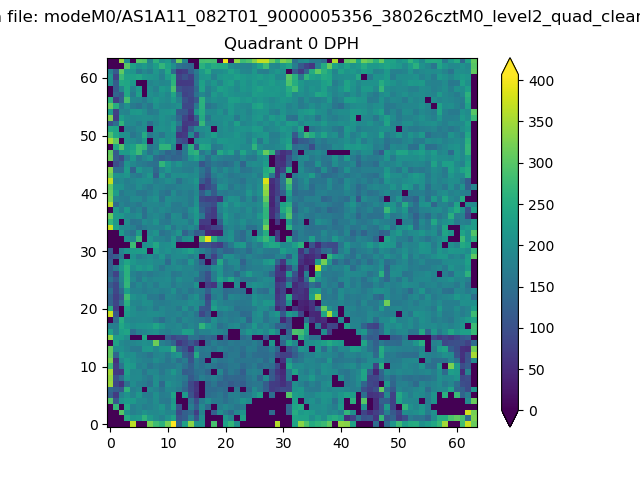 |
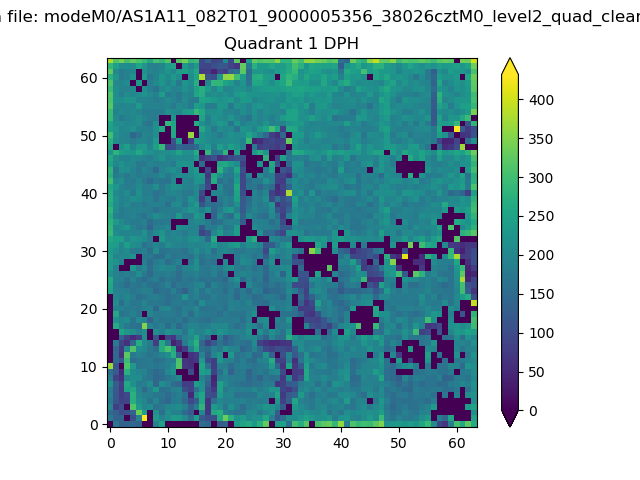 |
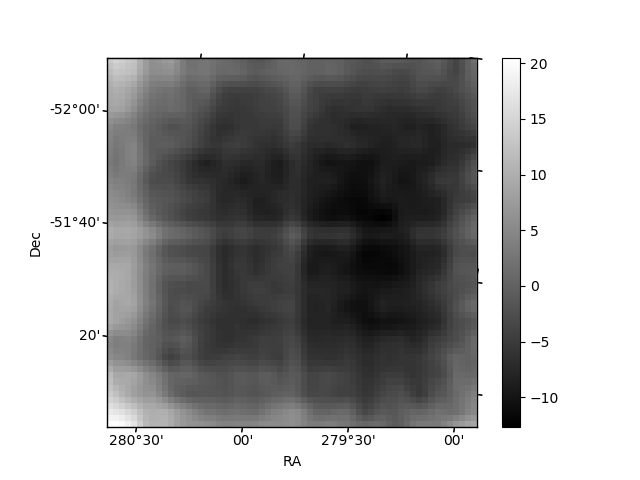
Quadrant B |
|---|---|---|---|
| Quadrant D | 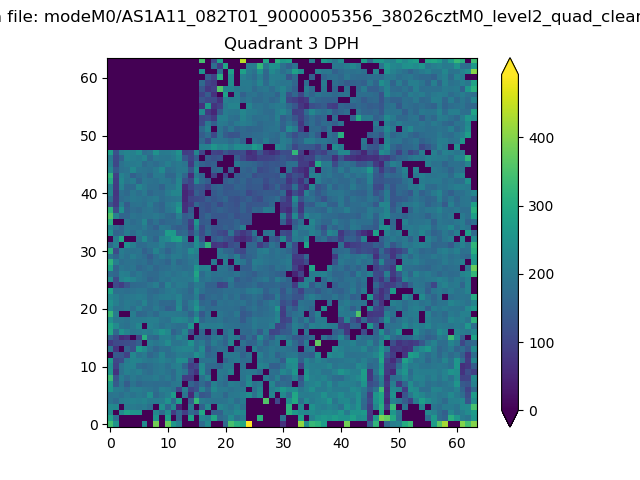 |
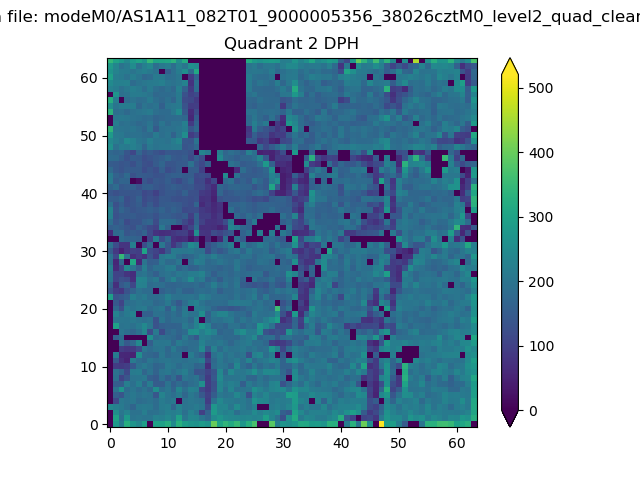 |
Quadrant C |
| Plot type | Count rate plots | Images |
|---|---|---|
| Comparison with Poisson distribution Blue bars denote a histogram of data divided into 1 sec bins. Red curve is a Poisson curve with rate = median count rate of data. |
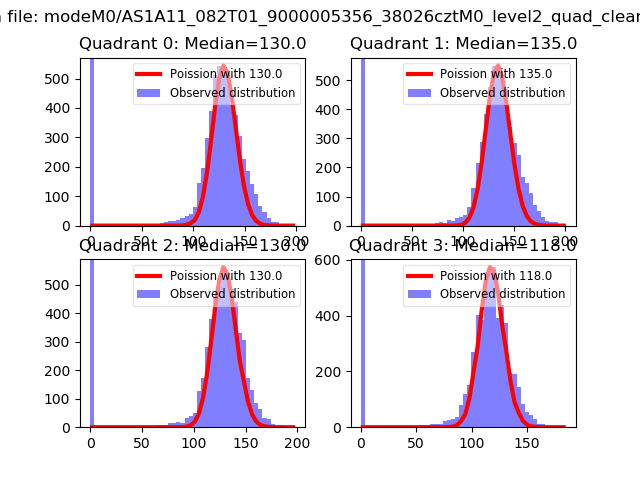 |
 |
| Quadrant-wise count rates Data is divided into 100 sec bins |
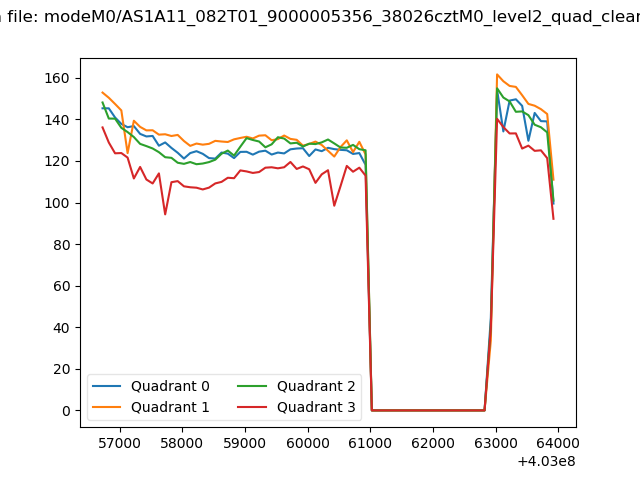 |
|
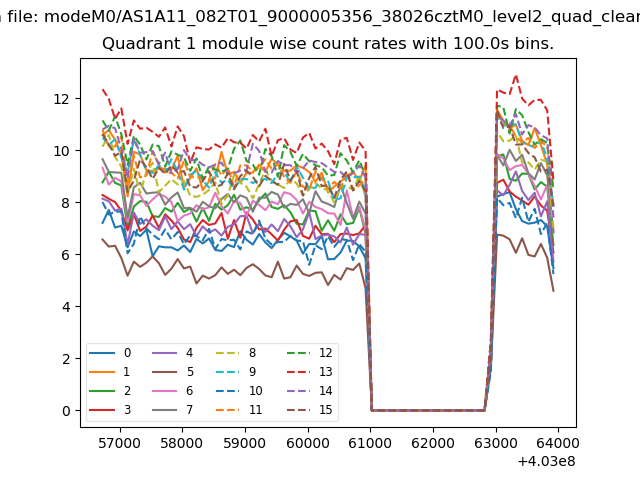
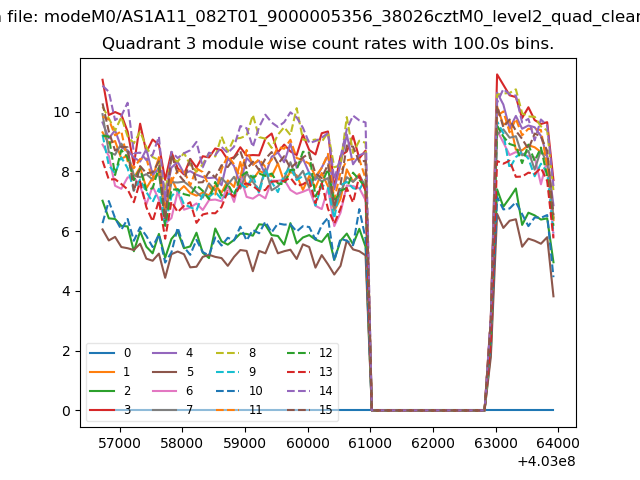
| Module-wise count rates for Quadrant A Data is divided into 100 sec bins |
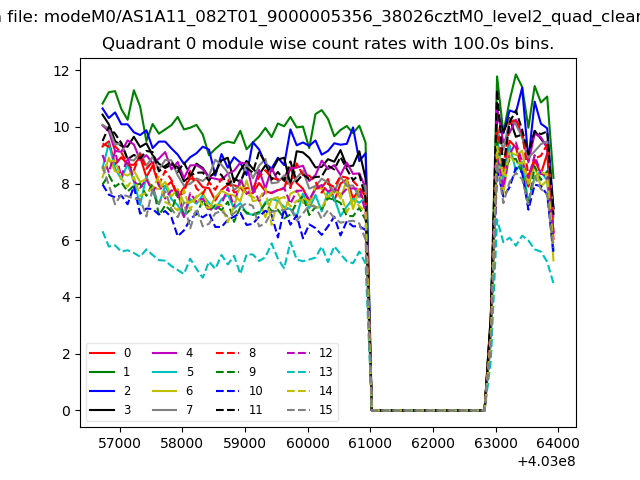 |
 |
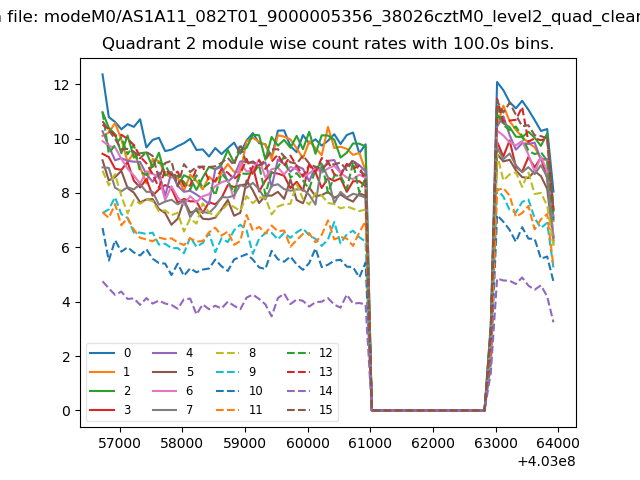
| Module-wise count rates for Quadrant B Data is divided into 100 sec bins |
 |
 |
| Module-wise count rates for Quadrant C Data is divided into 100 sec bins |
 |
 |
| Module-wise count rates for Quadrant D Data is divided into 100 sec bins |
 |
 |
| Parameter | Plot |
|---|---|
| CZT HV Monitor |  |
| D_VDD | 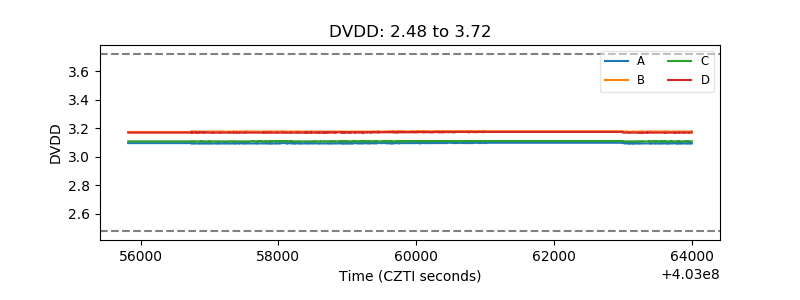 |
| Temperature 1 | 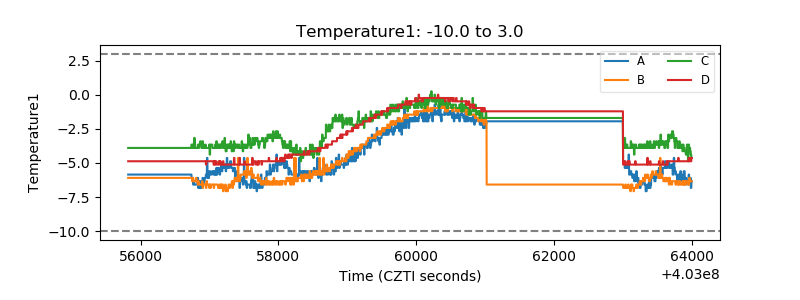 |
| Veto HV Monitor |  |
| Veto LLD | 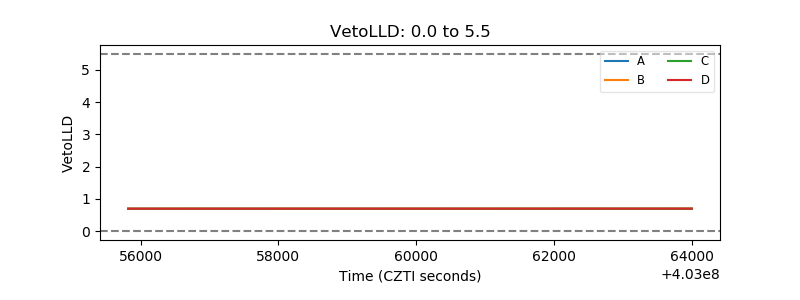 |
| Alpha Counter | 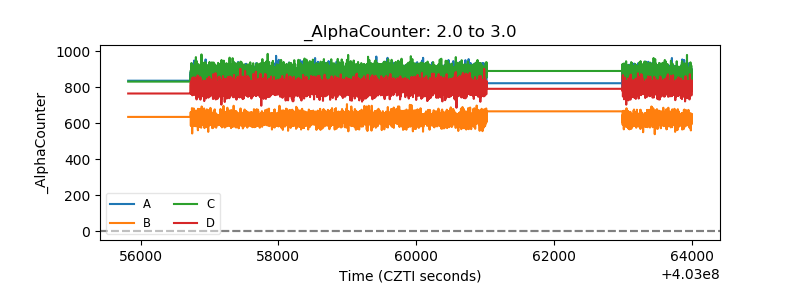 |
| _CPM_Rate |  |
| CZT Counter | 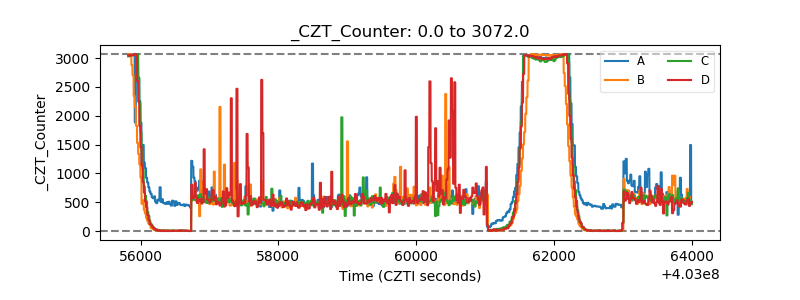 |
| +2.5 Volts monitor | 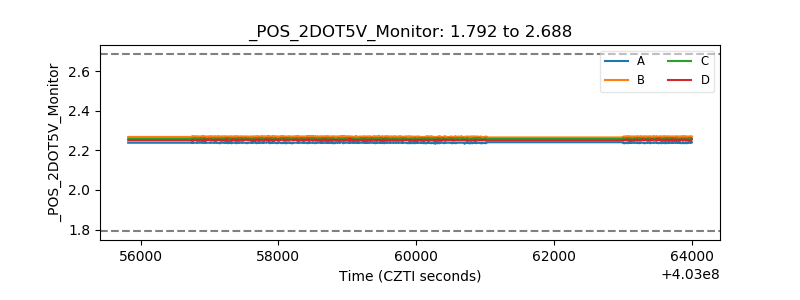 |
| +5 Volts monitor | 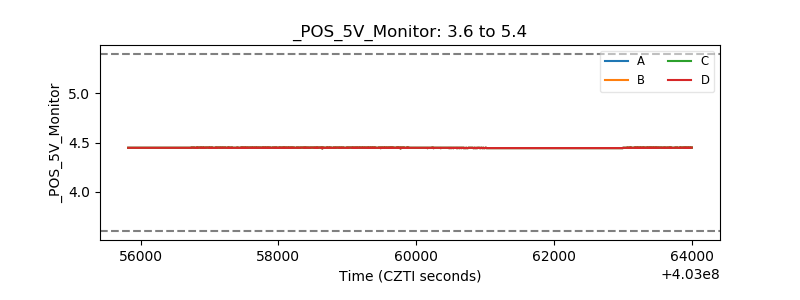 |
| _ROLL_ROT | 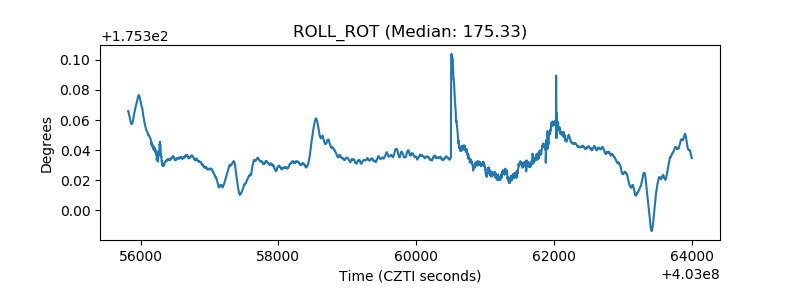 |
| _Roll_DEC | 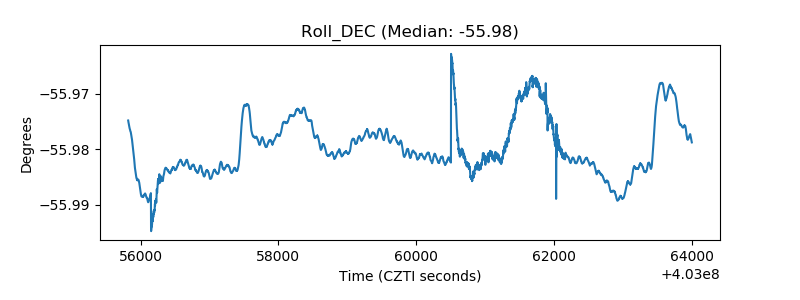 |
| _Roll_RA | 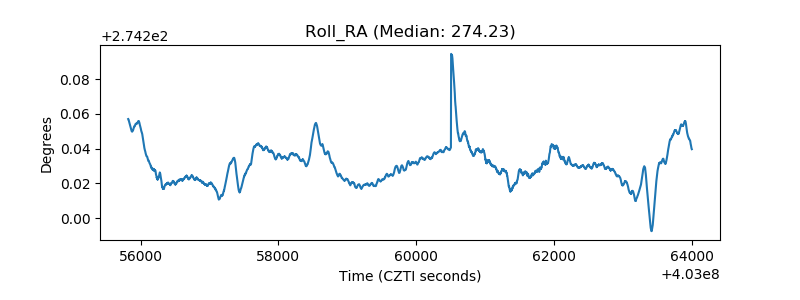 |
| Veto Counter | 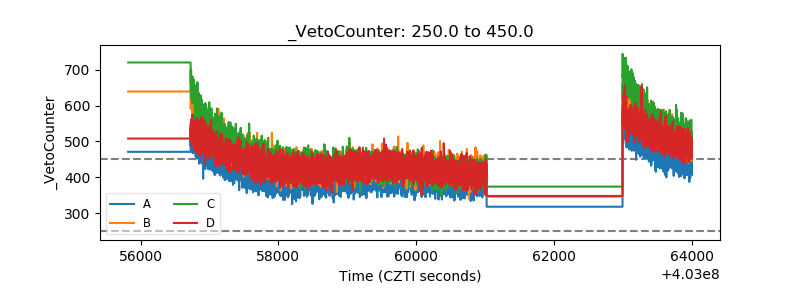 |