| Param | Original file | Final file |
|---|---|---|
| Filename | modeM0/AS1A11_082T01_9000005356_38027cztM0_level2.fits | modeM0/AS1A11_082T01_9000005356_38027cztM0_level2_quad_clean.evt |
| Size (bytes) | 391,147,200 | 100,013,760 |
| Size | 373.0 MB | 95.4 MB |
| Events in quadrant A | 3,378,526 | 687,409 |
| Events in quadrant B | 3,036,368 | 718,242 |
| Events in quadrant C | 2,798,984 | 697,441 |
| Events in quadrant D | 4,866,785 | 567,008 |
| Mode M0 | |||
|---|---|---|---|
| Quadrant | BADHDUFLAG | Total packets | Discarded packets |
| A | 0 | 13164 | 3 |
| B | 0 | 12028 | 2 |
| C | 0 | 11025 | 2 |
| D | 0 | 17731 | 2 |
| Mode SS | |||
|---|---|---|---|
| Quadrant | BADHDUFLAG | Total packets | Discarded packets |
| A | 0 | 104 | 0 |
| B | 0 | 104 | 0 |
| C | 0 | 104 | 0 |
| D | 0 | 104 | 0 |
| Mode M9 | |||
|---|---|---|---|
| Quadrant | BADHDUFLAG | Total packets | Discarded packets |
| A | 0 | 30 | 0 |
| B | 0 | 30 | 0 |
| C | 0 | 30 | 0 |
| D | 0 | 31 | 0 |
| Quadrant | Total seconds | Saturated seconds | Saturation percentage |
|---|---|---|---|
| A | 5122 | 81 | 1.581414% |
| B | 5122 | 82 | 1.600937% |
| C | 5122 | 10 | 0.195236% |
| D | 5122 | 671 | 13.100351% |
Noise dominated data is calculated using 1-second bins in cleaned event files. If a bin has >2000 counts, and if more than 50% of those come from <1% of pixels, then it is considered to be noise-dominated and hence unusable.
| Quadrant | # 1 sec bins | Bins with >0 counts | Bins with >2000 counts | High rate bins dominated by noise | Noise dominated (total time) | Noise dominated (detector-on time) | Marked lightcurve |
|---|---|---|---|---|---|---|---|
| A | 7185 | 5123 | 50 | 50 | 0.70% | 0.98% | 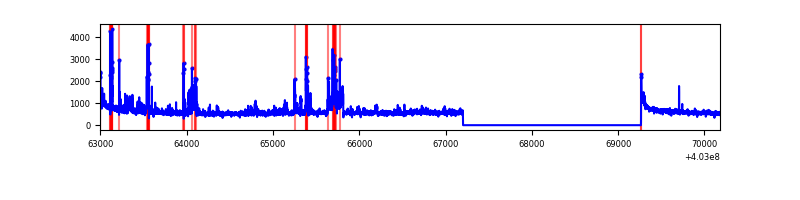 |
| B | 7185 | 5123 | 54 | 54 | 0.75% | 1.05% | 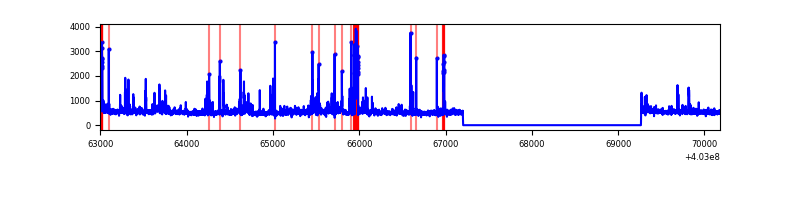 |
| C | 7185 | 5123 | 4 | 4 | 0.06% | 0.08% | 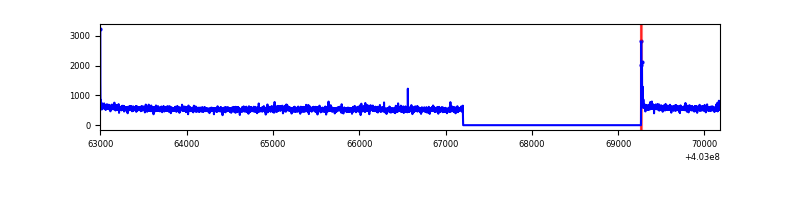 |
| D | 7185 | 5123 | 595 | 595 | 8.28% | 11.61% | 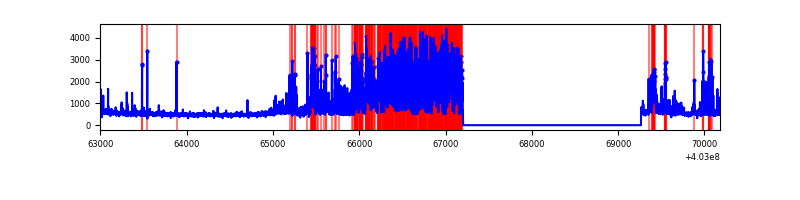 |
Top three noisy pixels from each quadrant. If the there are fewer than three noisy pixels in the level2.evt file, extra rows are filled as -1
| Pixel properties | Quadrant properties | ||||||
|---|---|---|---|---|---|---|---|
| Quadrant | DetID | PixID | Counts | Sigma | Mean | Median | Sigma |
| A | 10 | 83 | 370249 | 2920.6 | 640 | 629 | 126.6 |
| A | 15 | 254 | 191534 | 1508.46 | 640 | 629 | 126.6 |
| A | 12 | 16 | 166726 | 1312.44 | 640 | 629 | 126.6 |
| B | 5 | 255 | 192343 | 1600.12 | 641 | 625 | 119.8 |
| B | 5 | 200 | 113503 | 942.1 | 641 | 625 | 119.8 |
| B | 0 | 213 | 58924 | 486.58 | 641 | 625 | 119.8 |
| C | 15 | 214 | 221811 | 1528.34 | 642 | 647 | 144.7 |
| C | 0 | 10 | 26416 | 178.08 | 642 | 647 | 144.7 |
| C | 3 | 233 | 24456 | 164.53 | 642 | 647 | 144.7 |
| D | 12 | 227 | 1529025 | 10548.11 | 603 | 588 | 144.9 |
| D | 12 | 233 | 529930 | 3653.11 | 603 | 588 | 144.9 |
| D | 2 | 250 | 207981 | 1431.27 | 603 | 588 | 144.9 |
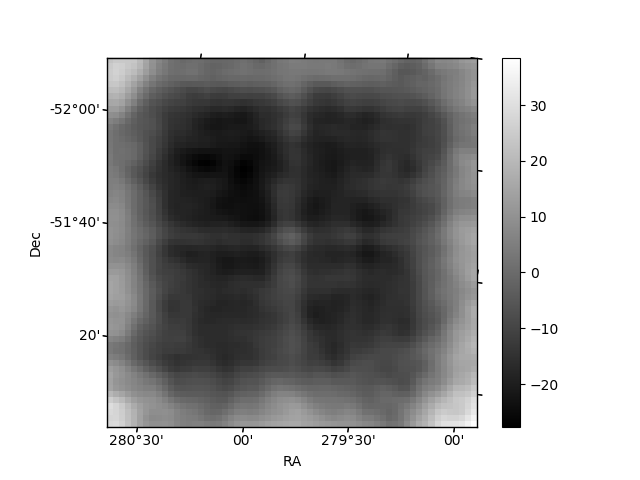
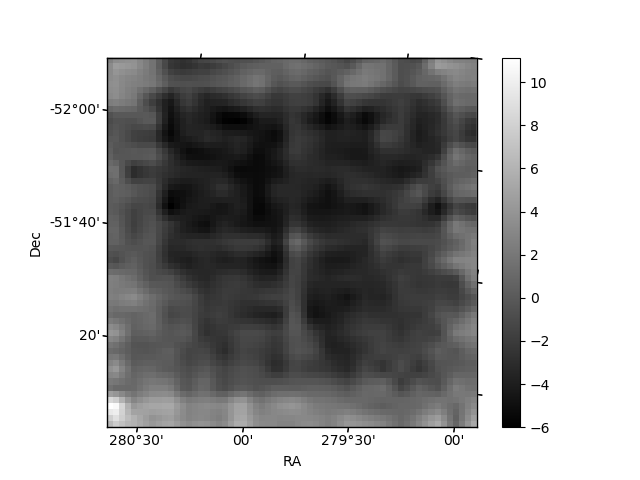
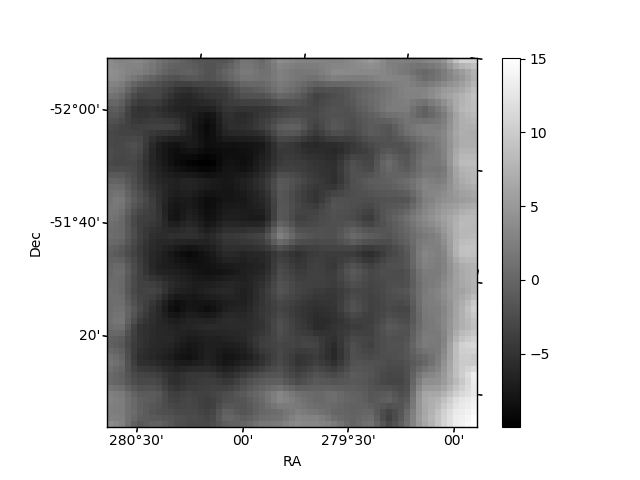
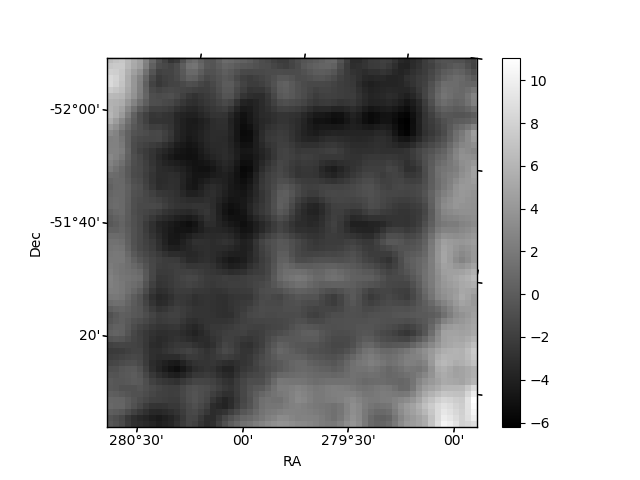
Histogram calculated using DETX and DETY for each event in the final _common_clean file
| Quadrant A | 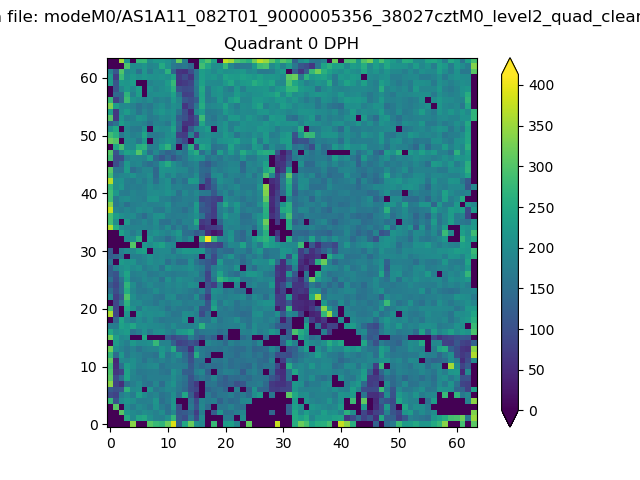 |
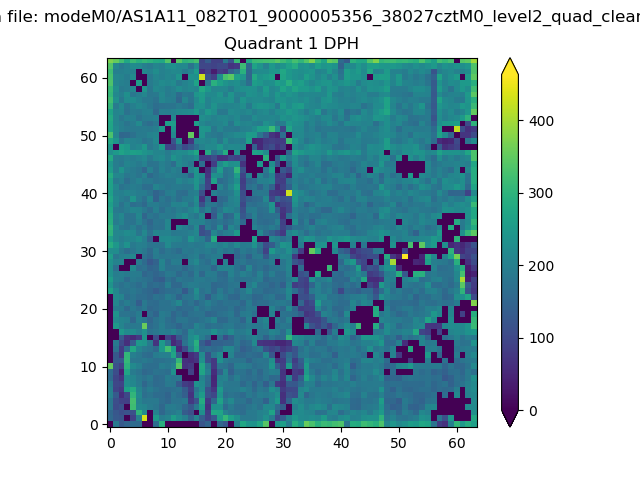 |
Quadrant B |
|---|---|---|---|
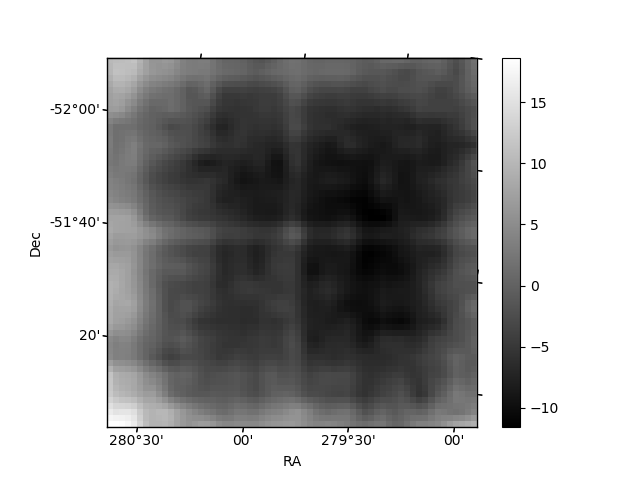
| Quadrant D | 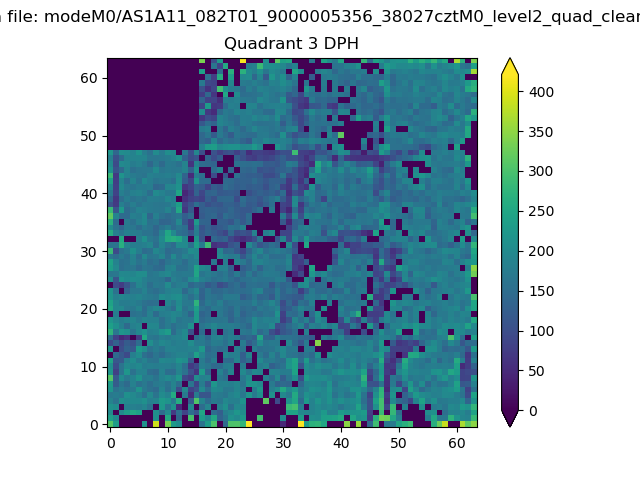 |
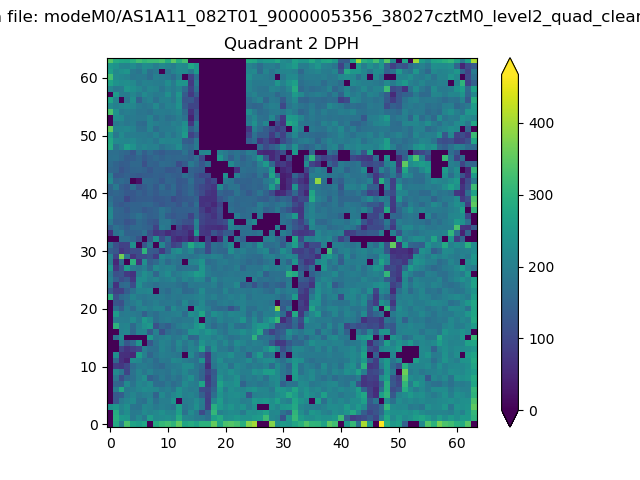 |
Quadrant C |
| Plot type | Count rate plots | Images |
|---|---|---|
| Comparison with Poisson distribution Blue bars denote a histogram of data divided into 1 sec bins. Red curve is a Poisson curve with rate = median count rate of data. |
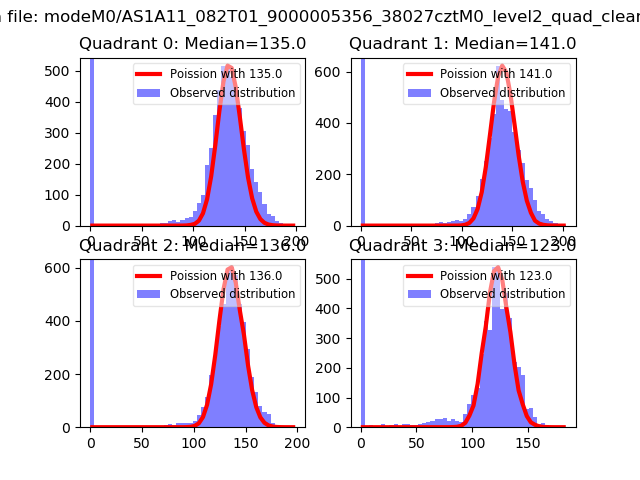 |
 |
| Quadrant-wise count rates Data is divided into 100 sec bins |
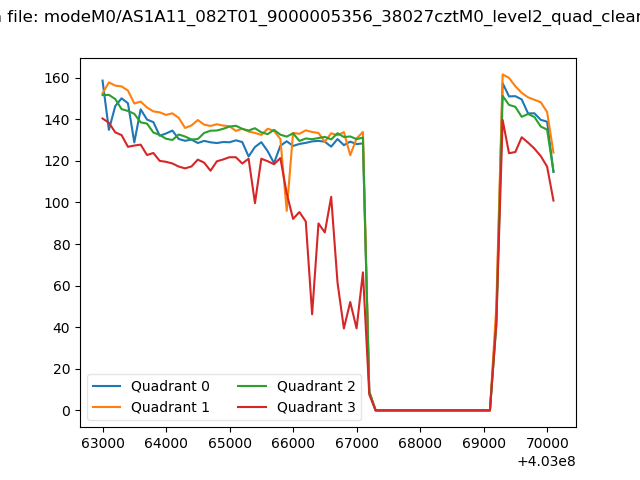 |
|
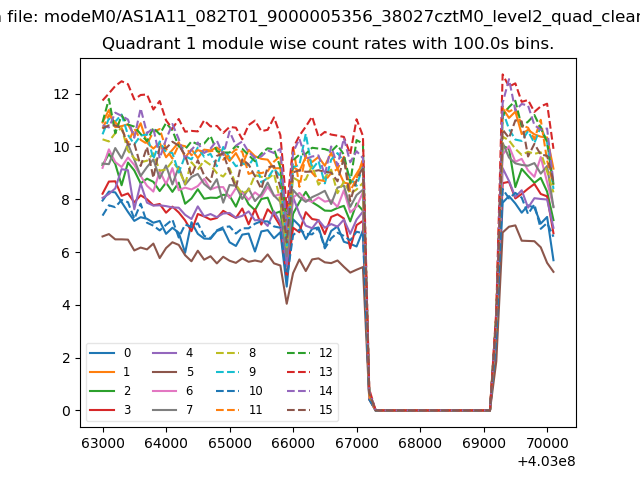
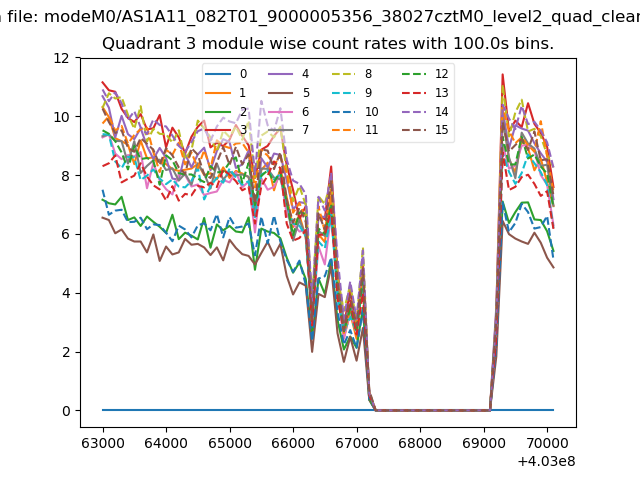
| Module-wise count rates for Quadrant A Data is divided into 100 sec bins |
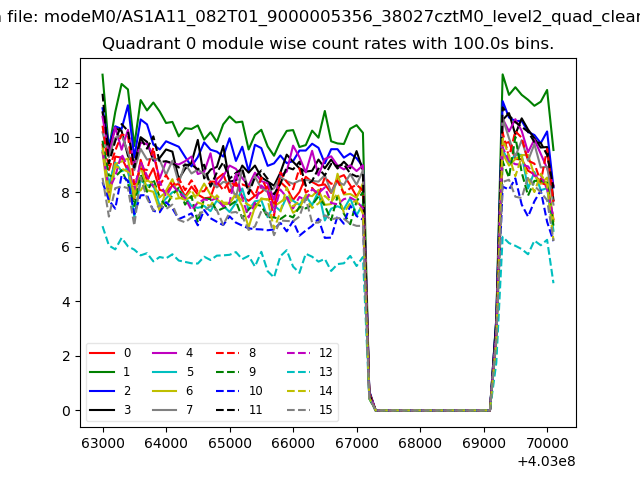 |
 |
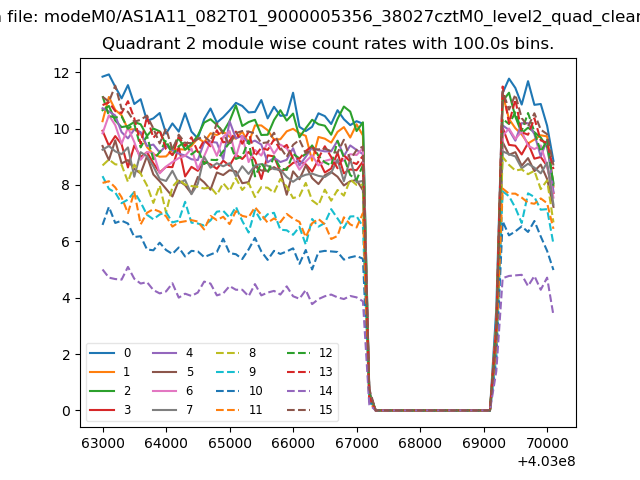
| Module-wise count rates for Quadrant B Data is divided into 100 sec bins |
 |
 |
| Module-wise count rates for Quadrant C Data is divided into 100 sec bins |
 |
 |
| Module-wise count rates for Quadrant D Data is divided into 100 sec bins |
 |
 |
| Parameter | Plot |
|---|---|
| CZT HV Monitor | 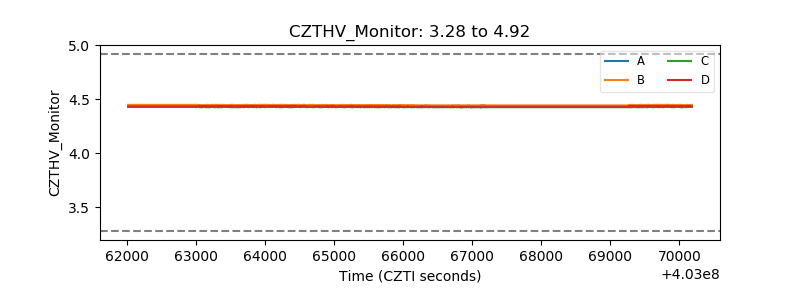 |
| D_VDD | 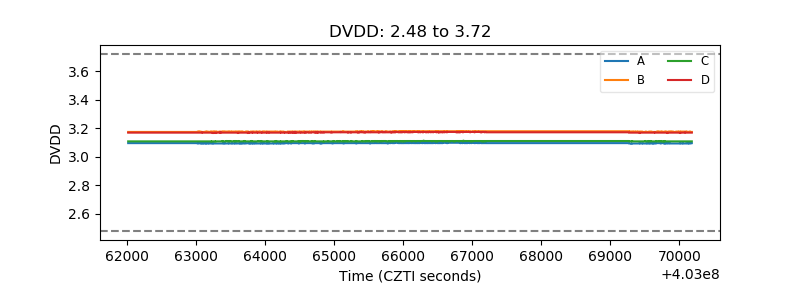 |
| Temperature 1 | 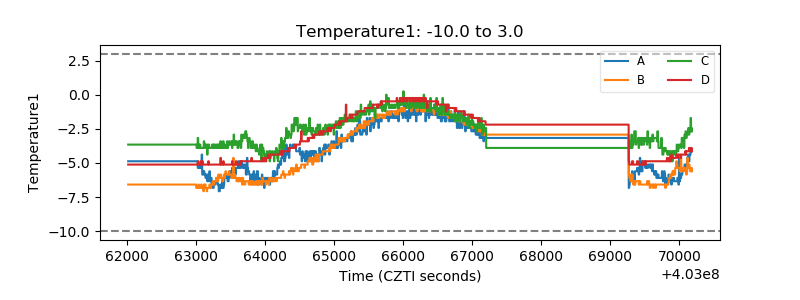 |
| Veto HV Monitor | 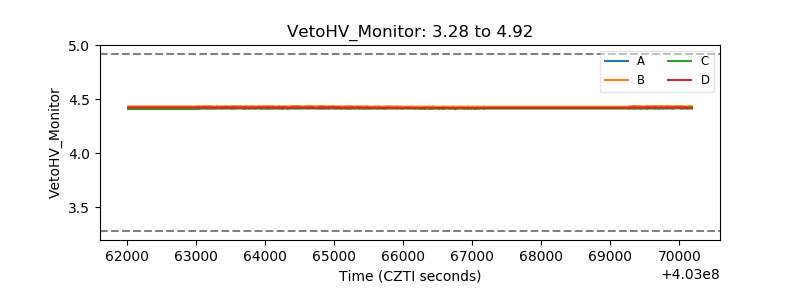 |
| Veto LLD | 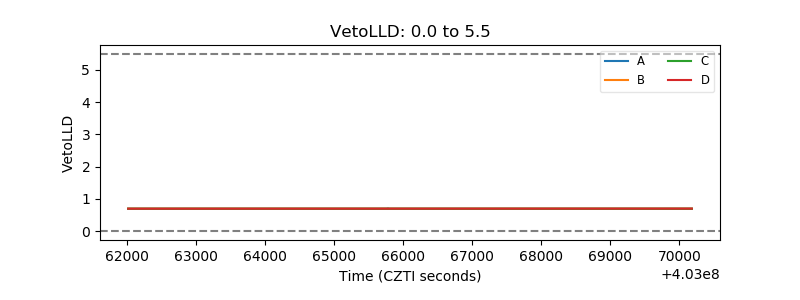 |
| Alpha Counter | 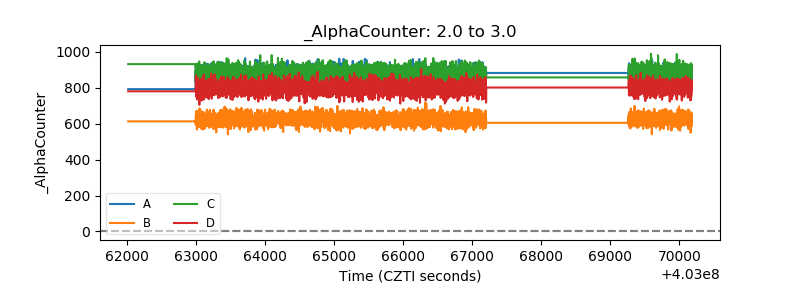 |
| _CPM_Rate | 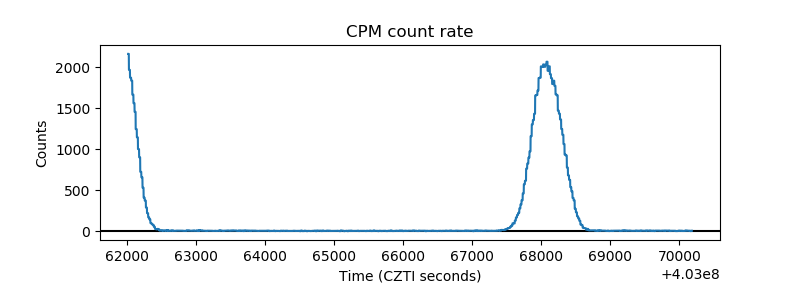 |
| CZT Counter | 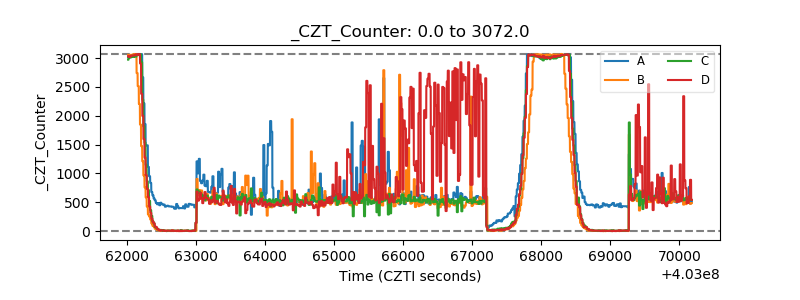 |
| +2.5 Volts monitor | 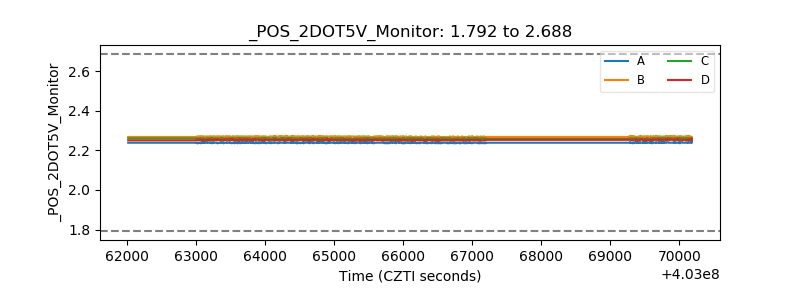 |
| +5 Volts monitor | 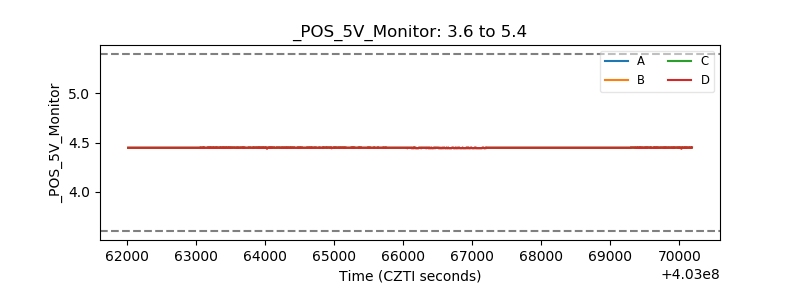 |
| _ROLL_ROT | 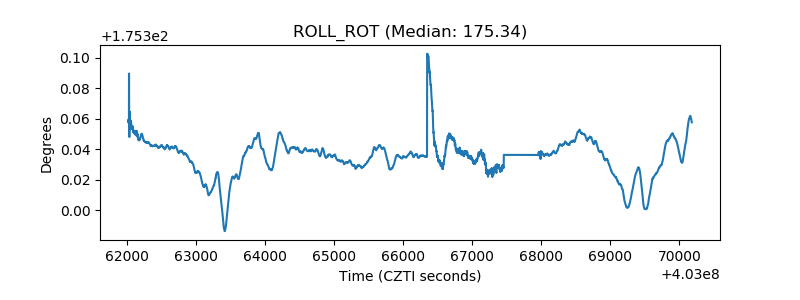 |
| _Roll_DEC | 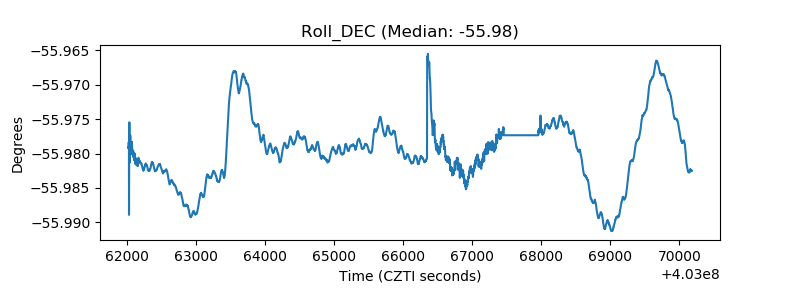 |
| _Roll_RA | 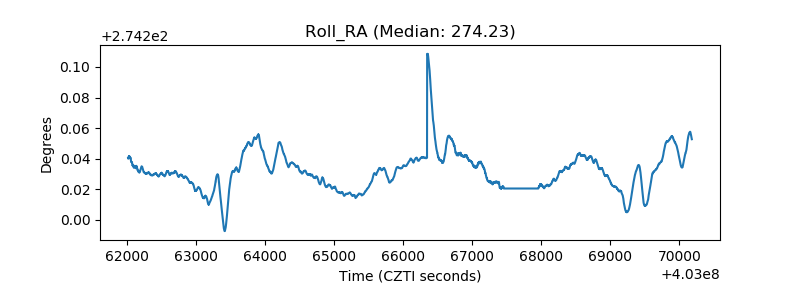 |
| Veto Counter | 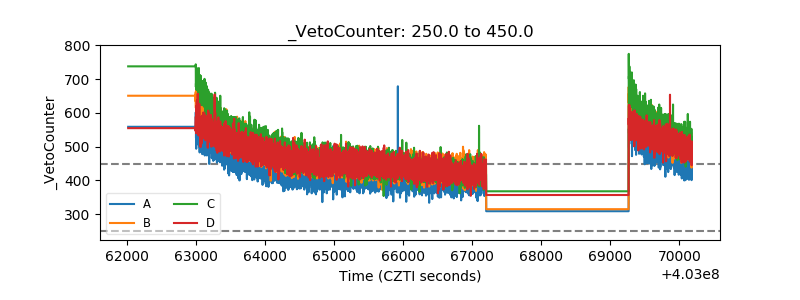 |