| Param | Original file | Final file |
|---|---|---|
| Filename | modeM0/AS1A11_082T01_9000005356_38028cztM0_level2.fits | modeM0/AS1A11_082T01_9000005356_38028cztM0_level2_quad_clean.evt |
| Size (bytes) | 430,430,400 | 90,394,560 |
| Size | 410.5 MB | 86.2 MB |
| Events in quadrant A | 2,830,751 | 652,950 |
| Events in quadrant B | 3,027,171 | 669,755 |
| Events in quadrant C | 2,716,458 | 659,124 |
| Events in quadrant D | 6,977,681 | 412,417 |
| Mode M0 | |||
|---|---|---|---|
| Quadrant | BADHDUFLAG | Total packets | Discarded packets |
| A | 0 | 11225 | 3 |
| B | 0 | 11859 | 2 |
| C | 0 | 10721 | 2 |
| D | 0 | 23868 | 2 |
| Mode SS | |||
|---|---|---|---|
| Quadrant | BADHDUFLAG | Total packets | Discarded packets |
| A | 0 | 98 | 0 |
| B | 0 | 98 | 0 |
| C | 0 | 98 | 0 |
| D | 0 | 98 | 0 |
| Mode M9 | |||
|---|---|---|---|
| Quadrant | BADHDUFLAG | Total packets | Discarded packets |
| A | 0 | 34 | 0 |
| B | 0 | 34 | 0 |
| C | 0 | 34 | 0 |
| D | 0 | 35 | 0 |
| Quadrant | Total seconds | Saturated seconds | Saturation percentage |
|---|---|---|---|
| A | 4898 | 15 | 0.306247% |
| B | 4898 | 132 | 2.694978% |
| C | 4898 | 20 | 0.408330% |
| D | 4898 | 1728 | 35.279706% |
Noise dominated data is calculated using 1-second bins in cleaned event files. If a bin has >2000 counts, and if more than 50% of those come from <1% of pixels, then it is considered to be noise-dominated and hence unusable.
| Quadrant | # 1 sec bins | Bins with >0 counts | Bins with >2000 counts | High rate bins dominated by noise | Noise dominated (total time) | Noise dominated (detector-on time) | Marked lightcurve |
|---|---|---|---|---|---|---|---|
| A | 7020 | 4899 | 6 | 6 | 0.09% | 0.12% | 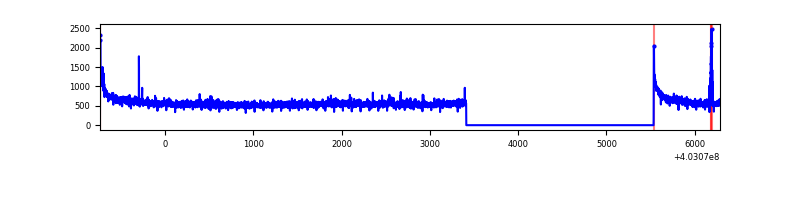 |
| B | 7020 | 4899 | 97 | 97 | 1.38% | 1.98% | 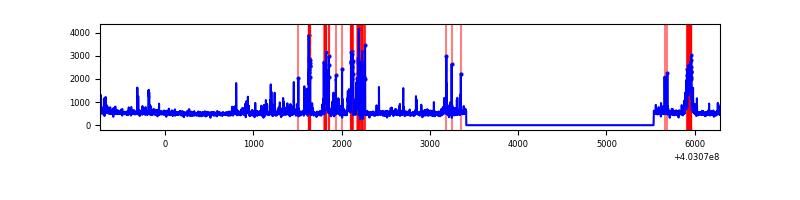 |
| C | 7020 | 4899 | 10 | 10 | 0.14% | 0.20% | 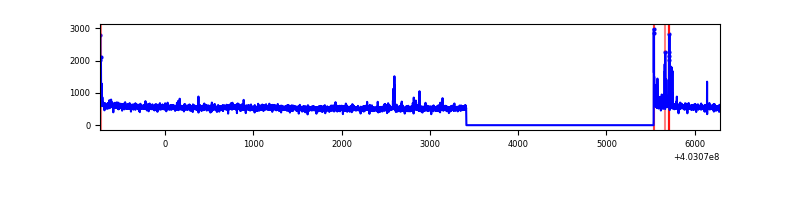 |
| D | 7020 | 4898 | 1596 | 1596 | 22.74% | 32.58% | 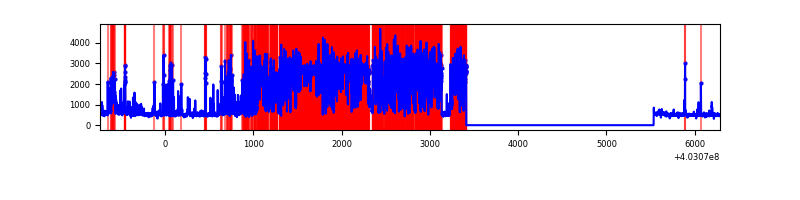 |
Top three noisy pixels from each quadrant. If the there are fewer than three noisy pixels in the level2.evt file, extra rows are filled as -1
| Pixel properties | Quadrant properties | ||||||
|---|---|---|---|---|---|---|---|
| Quadrant | DetID | PixID | Counts | Sigma | Mean | Median | Sigma |
| A | 10 | 83 | 369191 | 3014.67 | 612 | 601 | 122.3 |
| A | 12 | 16 | 31033 | 248.9 | 612 | 601 | 122.3 |
| A | 15 | 174 | 23339 | 185.97 | 612 | 601 | 122.3 |
| B | 4 | 171 | 155643 | 1373.75 | 606 | 592 | 112.9 |
| B | 5 | 172 | 115333 | 1016.6 | 606 | 592 | 112.9 |
| B | 5 | 255 | 112715 | 993.41 | 606 | 592 | 112.9 |
| C | 15 | 214 | 215946 | 1564.47 | 607 | 614 | 137.6 |
| C | 1 | 23 | 39343 | 281.38 | 607 | 614 | 137.6 |
| C | 0 | 10 | 31145 | 221.82 | 607 | 614 | 137.6 |
| D | 12 | 227 | 3986768 | 32506.6 | 506 | 493 | 122.6 |
| D | 2 | 250 | 396761 | 3231.42 | 506 | 493 | 122.6 |
| D | 12 | 233 | 190645 | 1550.62 | 506 | 493 | 122.6 |
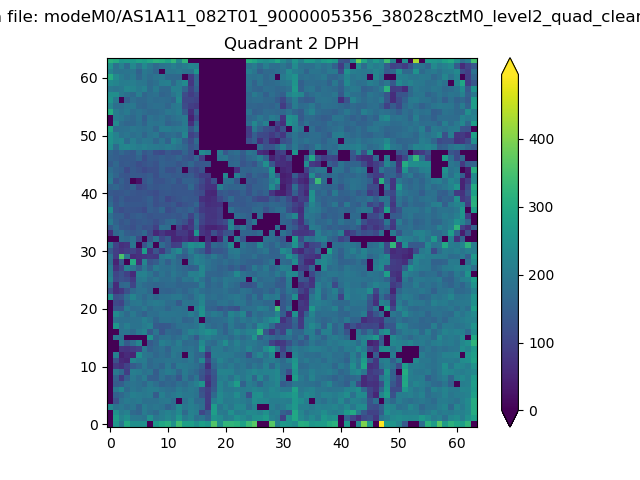
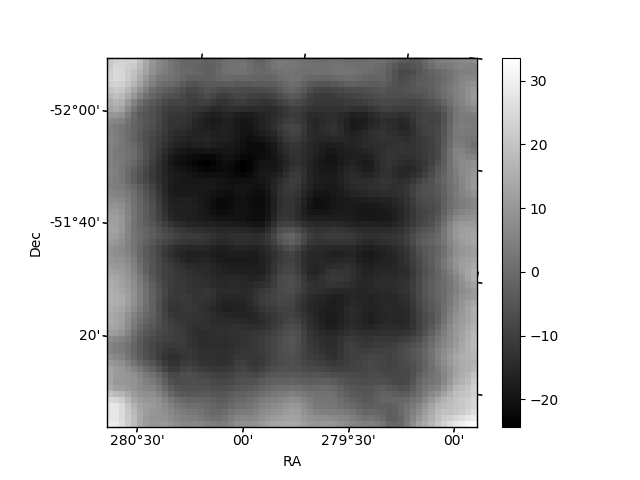
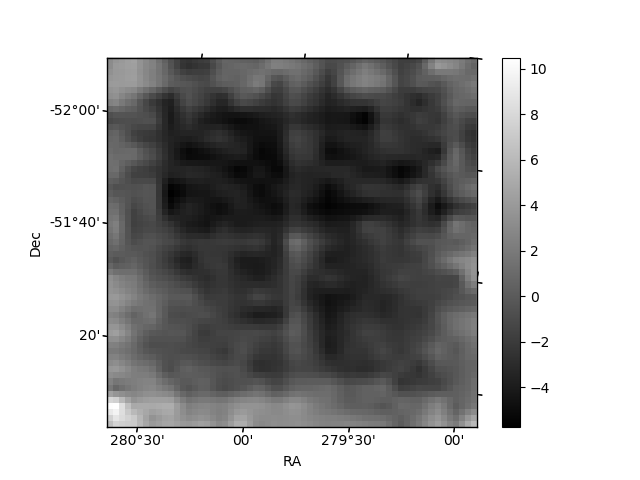
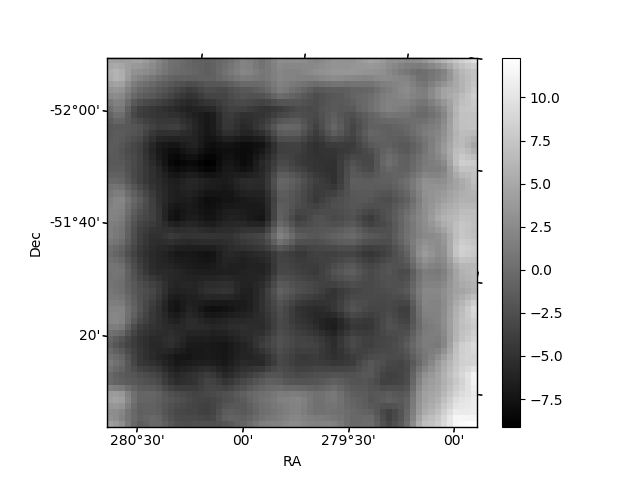
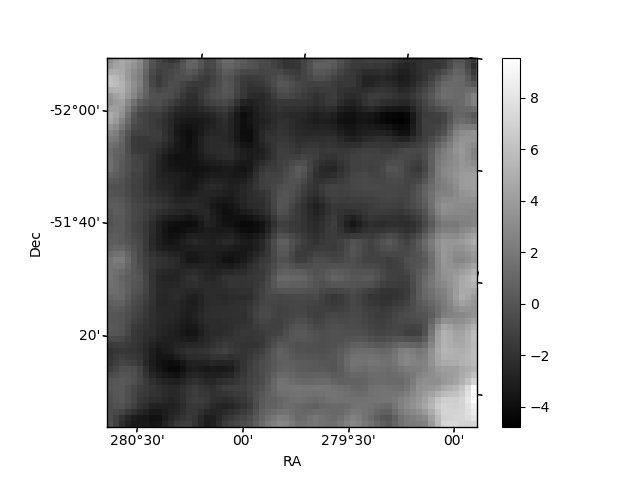
Histogram calculated using DETX and DETY for each event in the final _common_clean file
| Quadrant A | 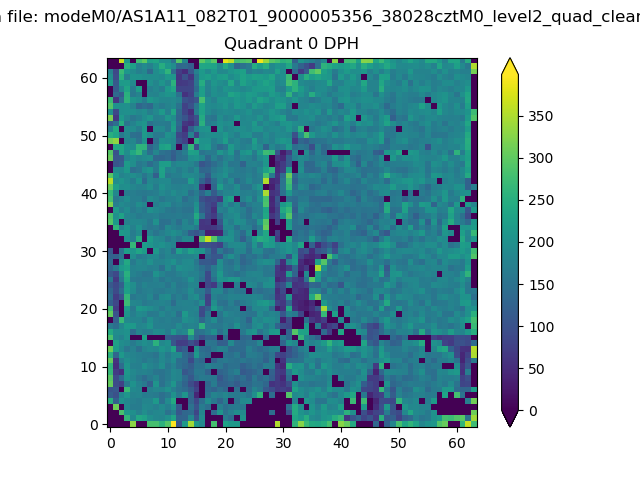 |
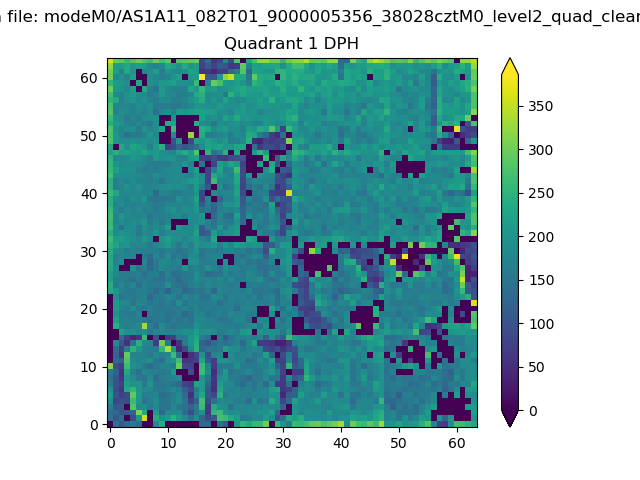 |
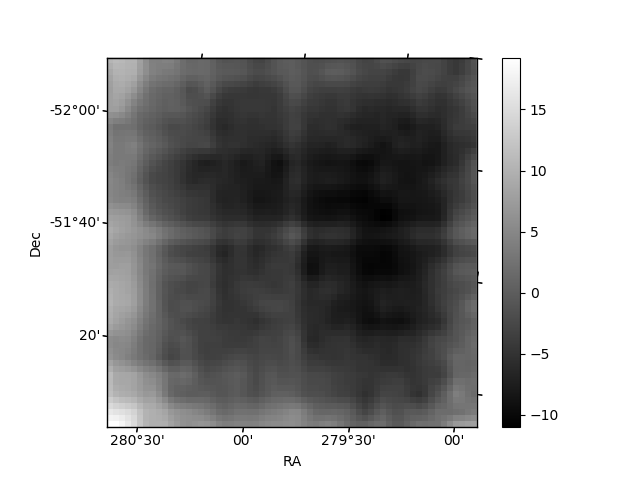
Quadrant B |
|---|---|---|---|
| Quadrant D | 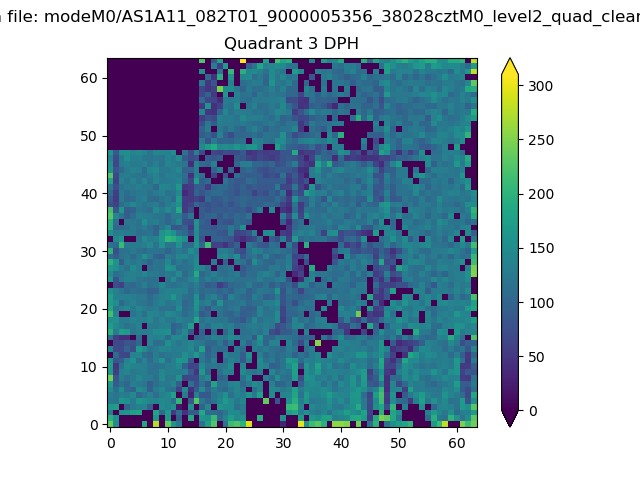 |
 |
Quadrant C |
| Plot type | Count rate plots | Images |
|---|---|---|
| Comparison with Poisson distribution Blue bars denote a histogram of data divided into 1 sec bins. Red curve is a Poisson curve with rate = median count rate of data. |
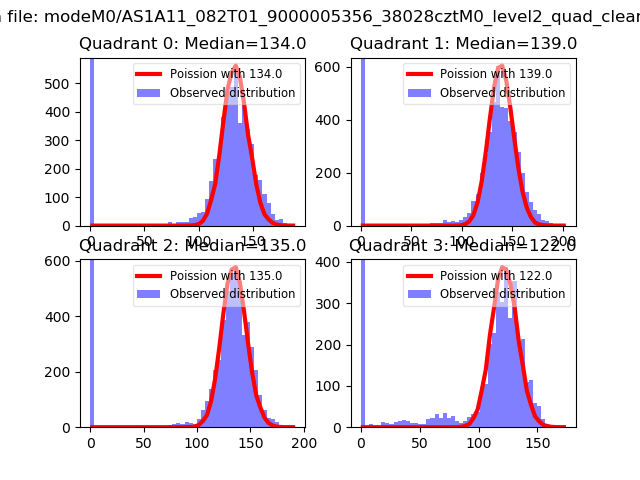 |
 |
| Quadrant-wise count rates Data is divided into 100 sec bins |
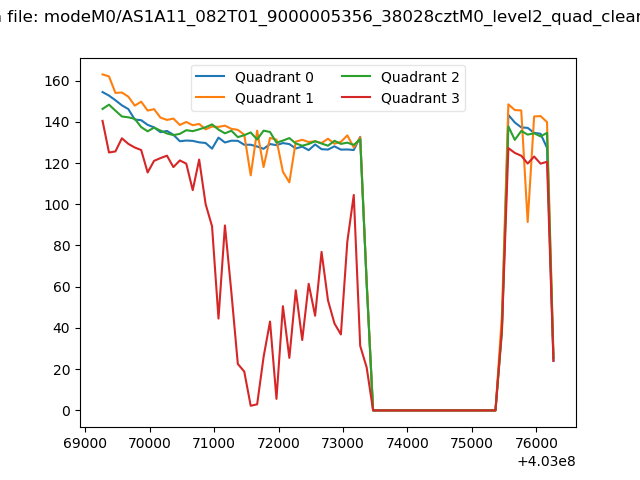 |
|
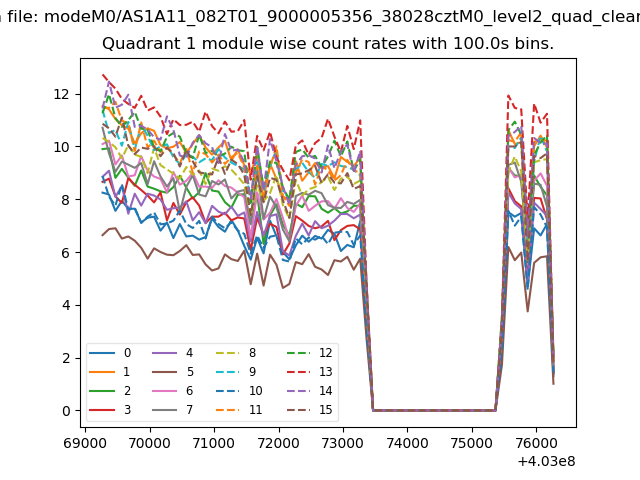
| Module-wise count rates for Quadrant A Data is divided into 100 sec bins |
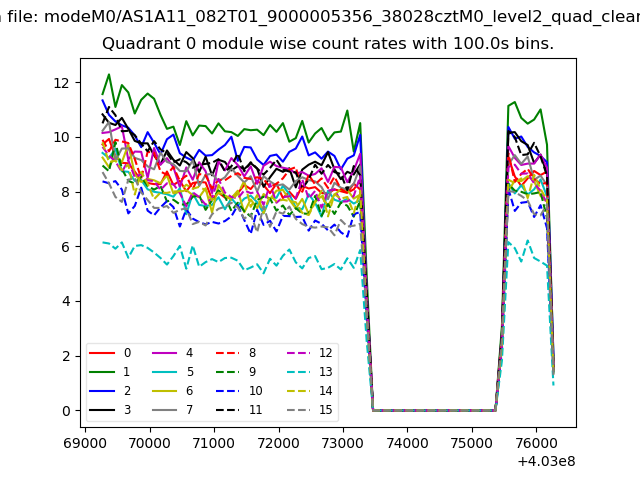 |
 |
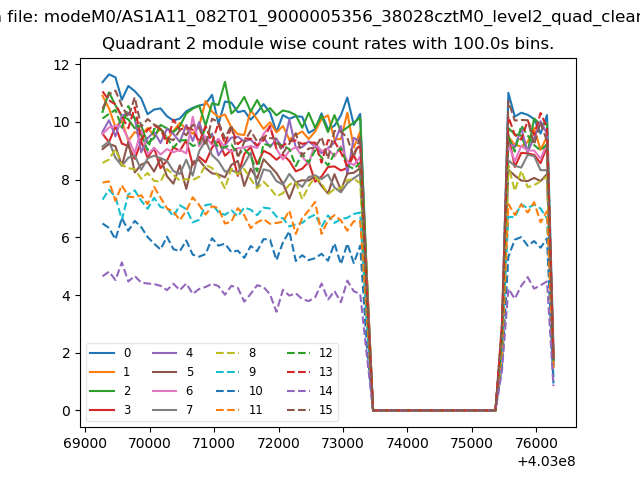
| Module-wise count rates for Quadrant B Data is divided into 100 sec bins |
 |
 |
| Module-wise count rates for Quadrant C Data is divided into 100 sec bins |
 |
 |
| Module-wise count rates for Quadrant D Data is divided into 100 sec bins |
 |
 |
| Parameter | Plot |
|---|---|
| CZT HV Monitor | 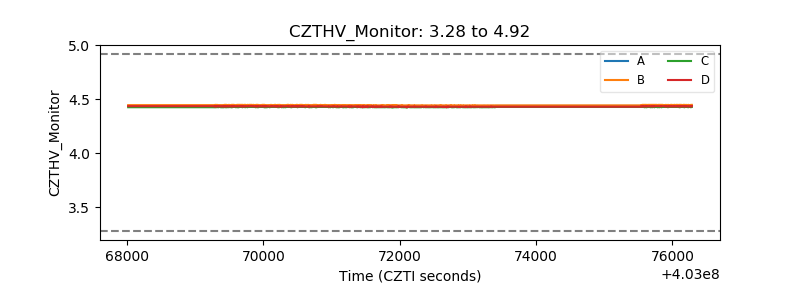 |
| D_VDD | 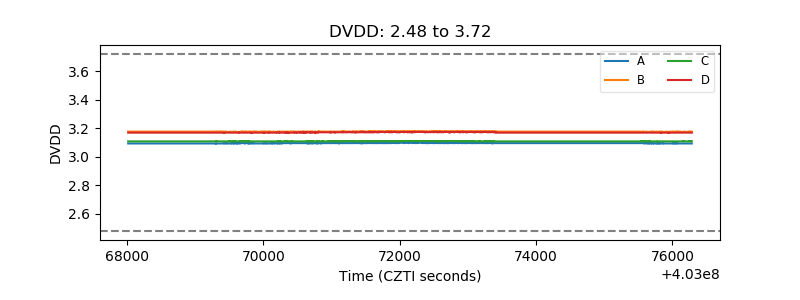 |
| Temperature 1 | 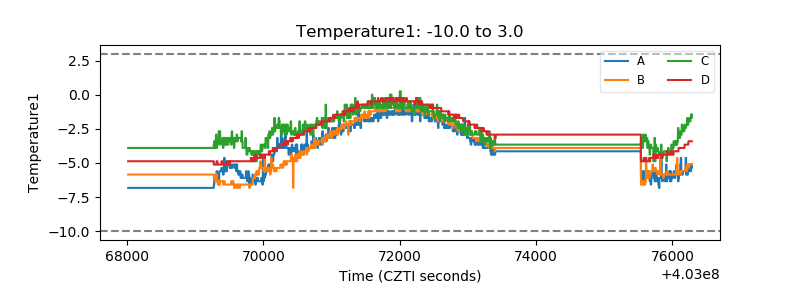 |
| Veto HV Monitor | 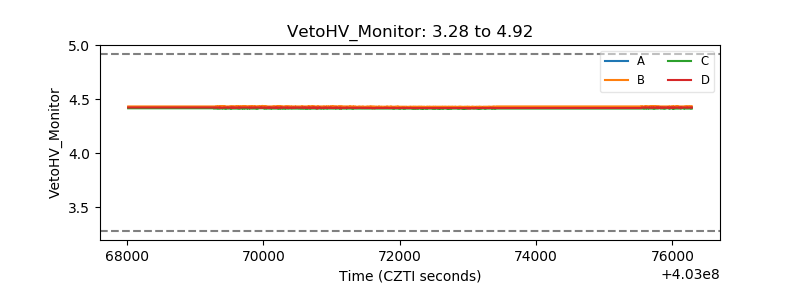 |
| Veto LLD | 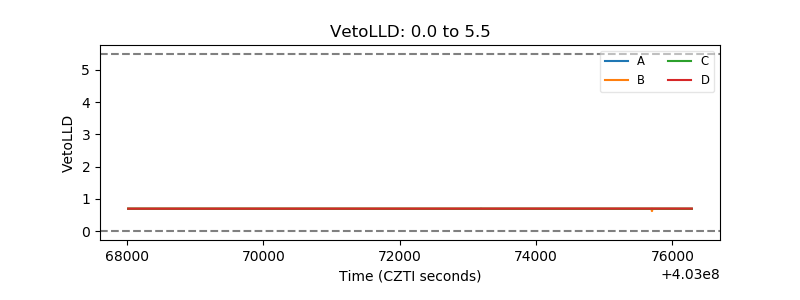 |
| Alpha Counter | 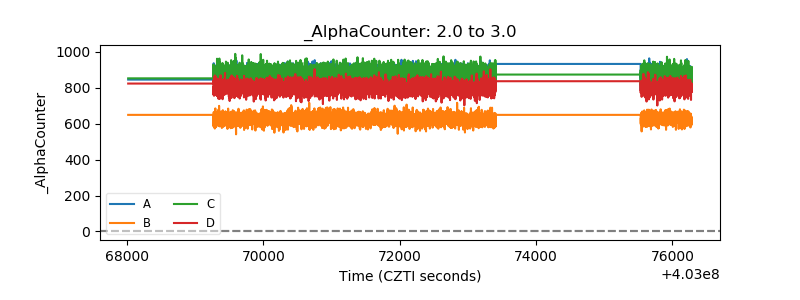 |
| _CPM_Rate | 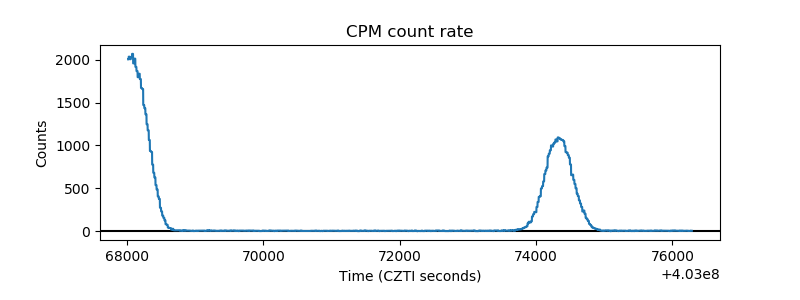 |
| CZT Counter | 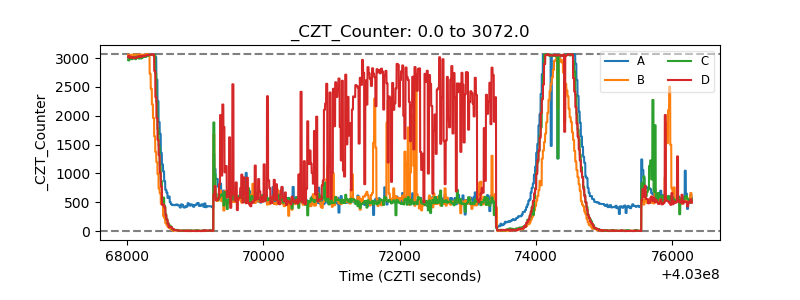 |
| +2.5 Volts monitor | 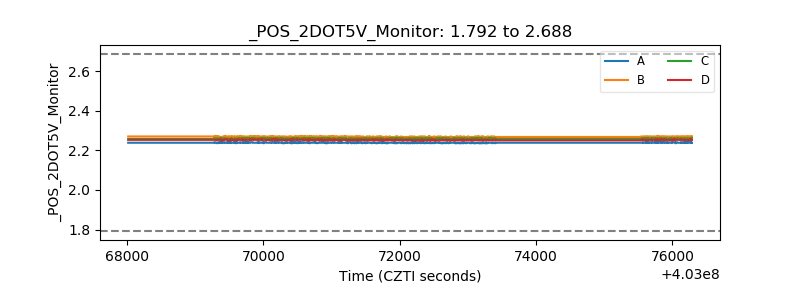 |
| +5 Volts monitor | 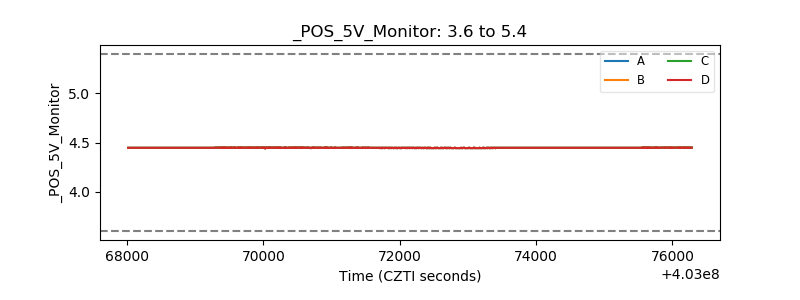 |
| _ROLL_ROT | 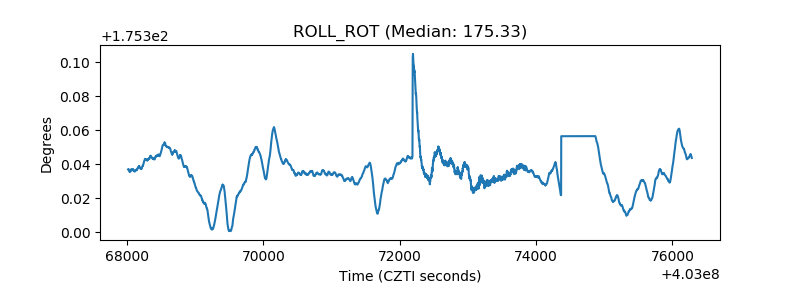 |
| _Roll_DEC | 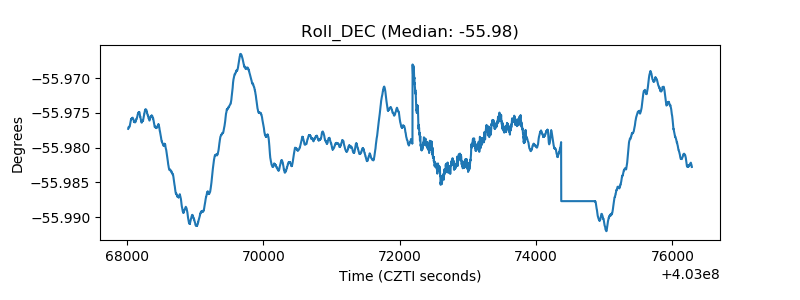 |
| _Roll_RA | 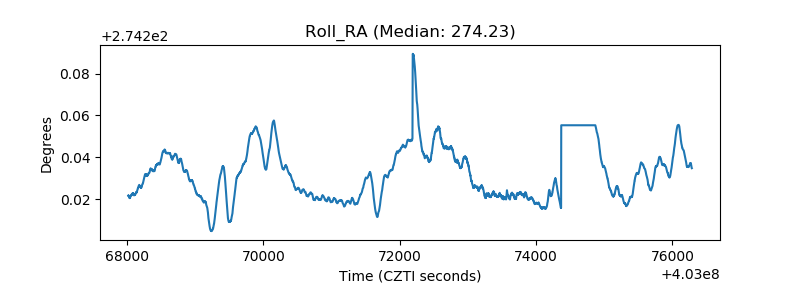 |
| Veto Counter | 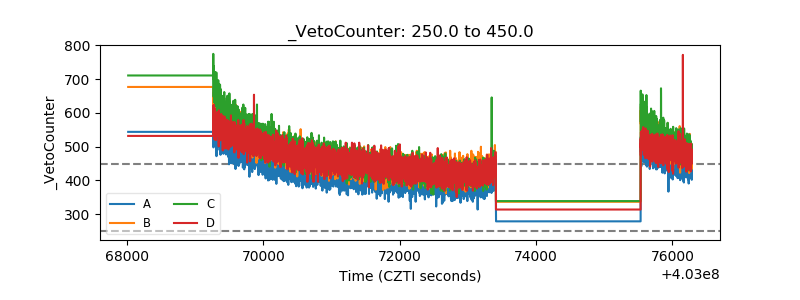 |