| Param | Original file | Final file |
|---|---|---|
| Filename | modeM0/AS1A11_082T01_9000005356_38029cztM0_level2.fits | modeM0/AS1A11_082T01_9000005356_38029cztM0_level2_quad_clean.evt |
| Size (bytes) | 344,076,480 | 92,473,920 |
| Size | 328.1 MB | 88.2 MB |
| Events in quadrant A | 2,778,342 | 627,424 |
| Events in quadrant B | 3,221,222 | 636,341 |
| Events in quadrant C | 2,883,618 | 625,927 |
| Events in quadrant D | 3,469,824 | 565,043 |
| Mode M0 | |||
|---|---|---|---|
| Quadrant | BADHDUFLAG | Total packets | Discarded packets |
| A | 0 | 11041 | 3 |
| B | 0 | 12566 | 2 |
| C | 0 | 11250 | 2 |
| D | 0 | 13379 | 2 |
| Mode SS | |||
|---|---|---|---|
| Quadrant | BADHDUFLAG | Total packets | Discarded packets |
| A | 0 | 100 | 0 |
| B | 0 | 100 | 0 |
| C | 0 | 100 | 0 |
| D | 0 | 100 | 0 |
| Mode M9 | |||
|---|---|---|---|
| Quadrant | BADHDUFLAG | Total packets | Discarded packets |
| A | 0 | 27 | 0 |
| B | 0 | 27 | 0 |
| C | 0 | 27 | 0 |
| D | 0 | 28 | 0 |
| Quadrant | Total seconds | Saturated seconds | Saturation percentage |
|---|---|---|---|
| A | 4929 | 22 | 0.446338% |
| B | 4929 | 178 | 3.611280% |
| C | 4929 | 102 | 2.069385% |
| D | 4929 | 162 | 3.286671% |
Noise dominated data is calculated using 1-second bins in cleaned event files. If a bin has >2000 counts, and if more than 50% of those come from <1% of pixels, then it is considered to be noise-dominated and hence unusable.
| Quadrant | # 1 sec bins | Bins with >0 counts | Bins with >2000 counts | High rate bins dominated by noise | Noise dominated (total time) | Noise dominated (detector-on time) | Marked lightcurve |
|---|---|---|---|---|---|---|---|
| A | 7052 | 4930 | 12 | 12 | 0.17% | 0.24% | 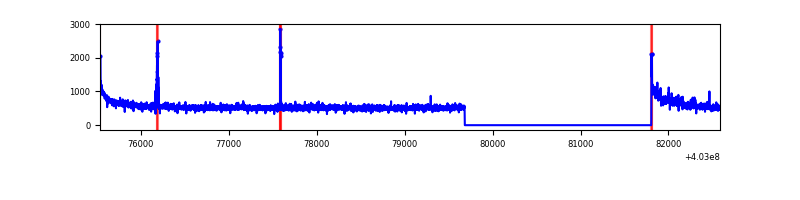 |
| B | 7052 | 4930 | 124 | 124 | 1.76% | 2.52% | 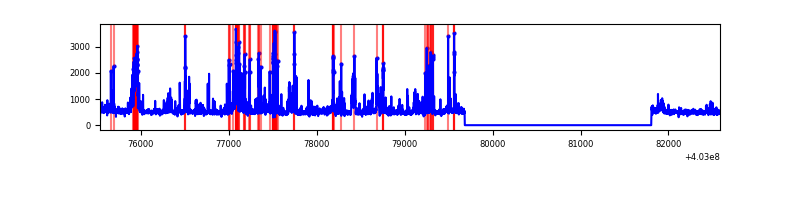 |
| C | 7052 | 4930 | 82 | 82 | 1.16% | 1.66% | 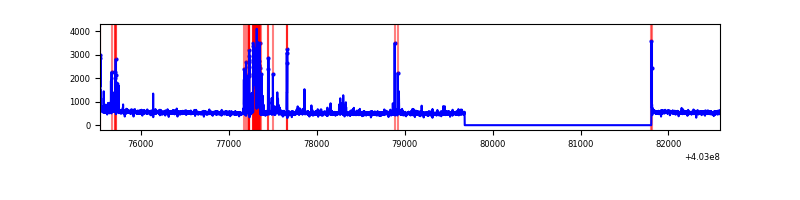 |
| D | 7052 | 4930 | 148 | 148 | 2.10% | 3.00% | 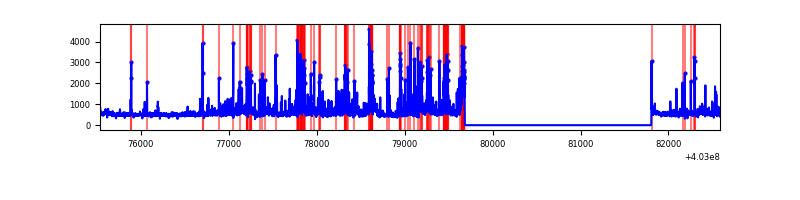 |
Top three noisy pixels from each quadrant. If the there are fewer than three noisy pixels in the level2.evt file, extra rows are filled as -1
| Pixel properties | Quadrant properties | ||||||
|---|---|---|---|---|---|---|---|
| Quadrant | DetID | PixID | Counts | Sigma | Mean | Median | Sigma |
| A | 10 | 83 | 355305 | 2951.76 | 597 | 587 | 120.2 |
| A | 12 | 16 | 48732 | 400.64 | 597 | 587 | 120.2 |
| A | 15 | 174 | 22328 | 180.92 | 597 | 587 | 120.2 |
| B | 4 | 171 | 357802 | 3234.84 | 588 | 575 | 110.4 |
| B | 5 | 172 | 240728 | 2174.69 | 588 | 575 | 110.4 |
| B | 5 | 255 | 79311 | 712.99 | 588 | 575 | 110.4 |
| C | 1 | 23 | 284833 | 2118.8 | 582 | 588 | 134.2 |
| C | 15 | 214 | 213817 | 1589.44 | 582 | 588 | 134.2 |
| C | 14 | 254 | 35736 | 262.0 | 582 | 588 | 134.2 |
| D | 12 | 227 | 329213 | 2341.06 | 580 | 566 | 140.4 |
| D | 2 | 250 | 242768 | 1725.28 | 580 | 566 | 140.4 |
| D | 13 | 200 | 172735 | 1226.42 | 580 | 566 | 140.4 |
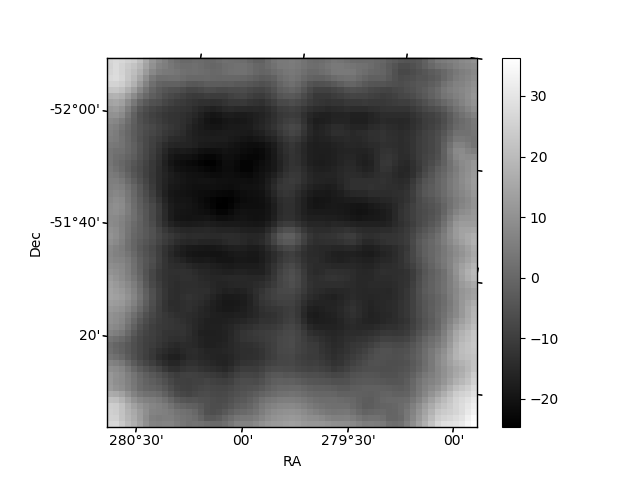
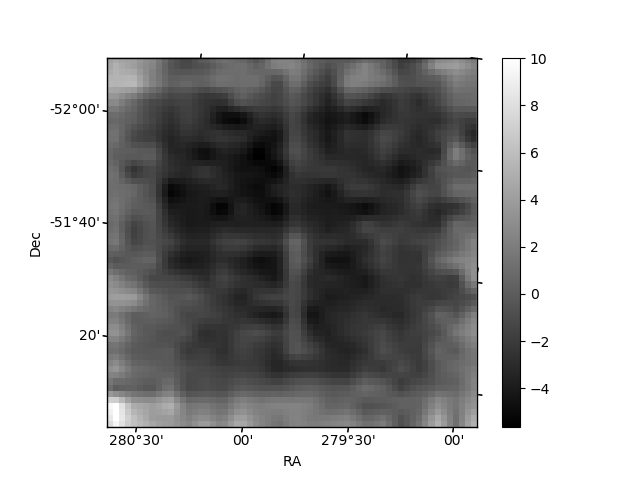
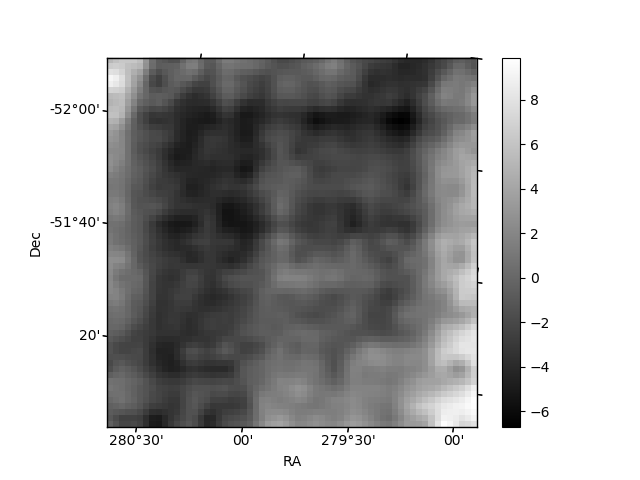
Histogram calculated using DETX and DETY for each event in the final _common_clean file
| Quadrant A | 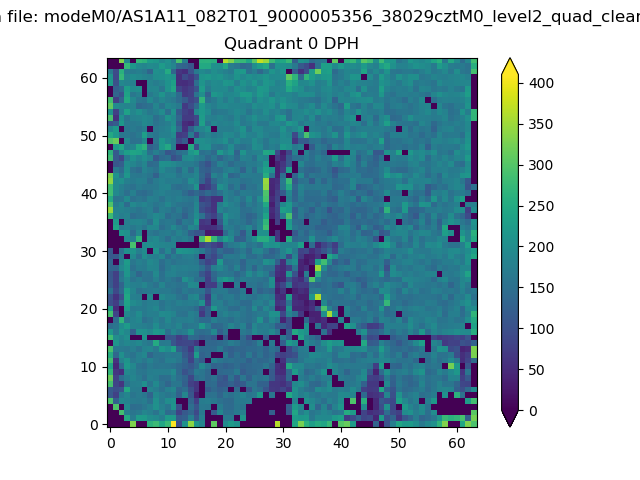 |
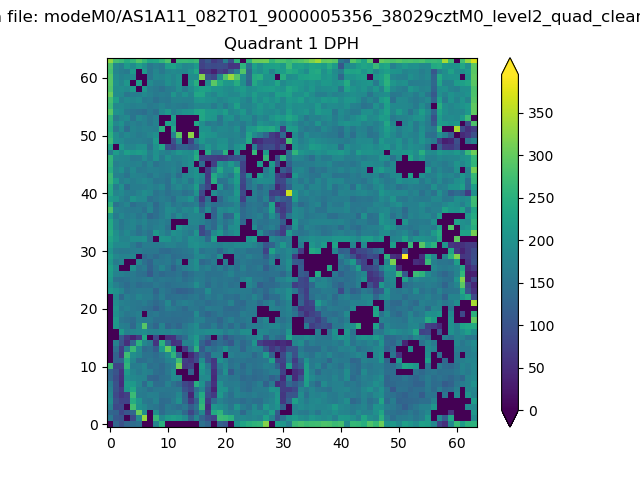 |
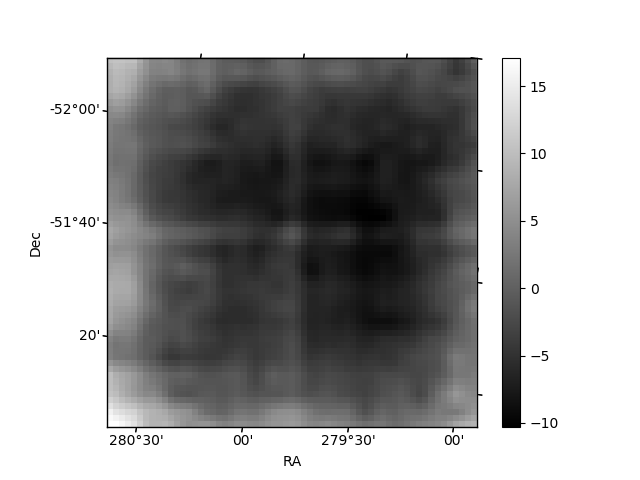
Quadrant B |
|---|---|---|---|
| Quadrant D | 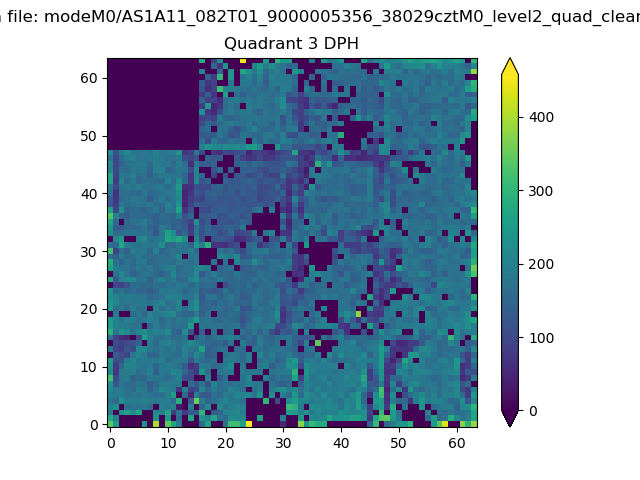 |
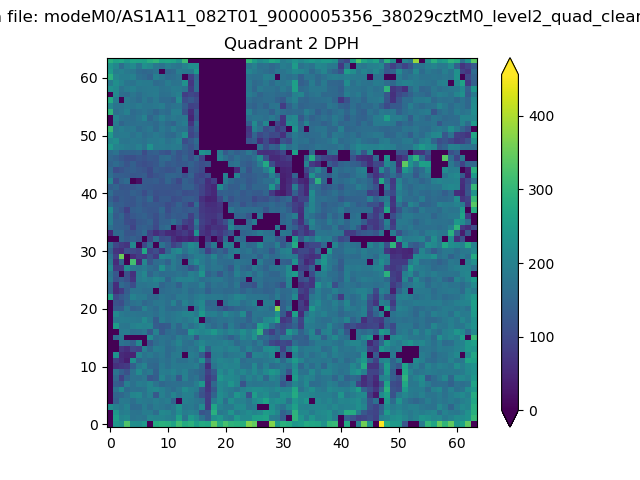 |
Quadrant C |
| Plot type | Count rate plots | Images |
|---|---|---|
| Comparison with Poisson distribution Blue bars denote a histogram of data divided into 1 sec bins. Red curve is a Poisson curve with rate = median count rate of data. |
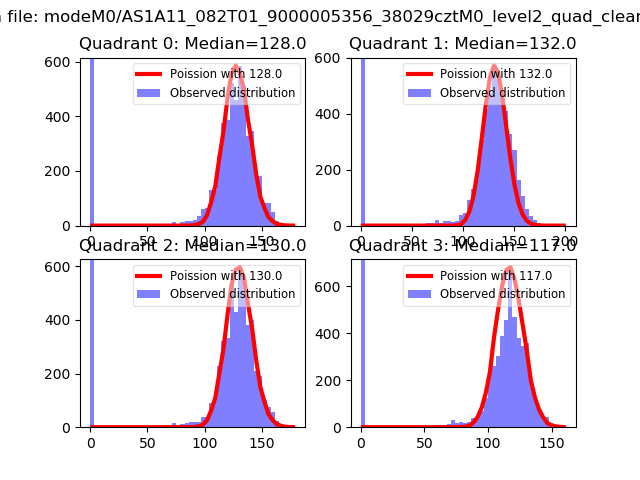 |
 |
| Quadrant-wise count rates Data is divided into 100 sec bins |
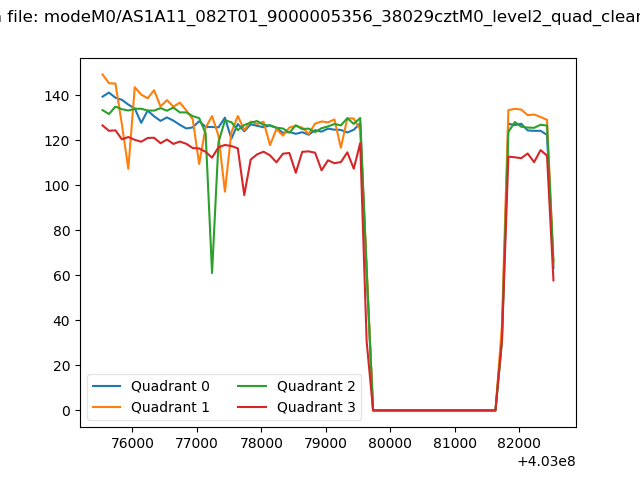 |
|
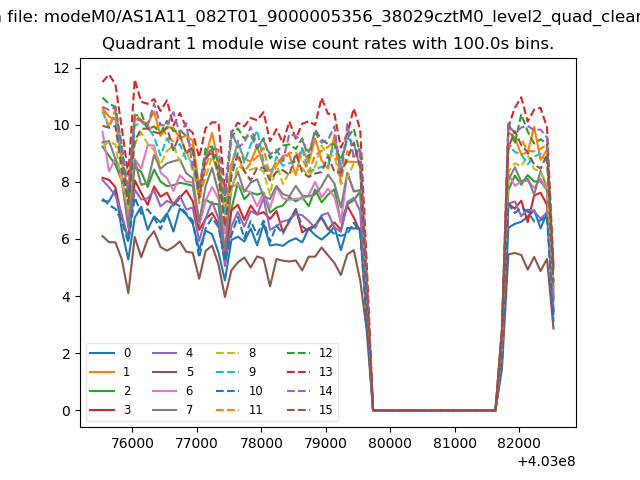
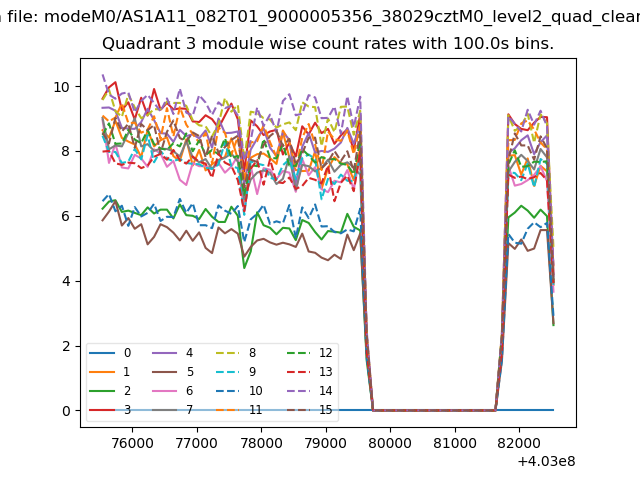
| Module-wise count rates for Quadrant A Data is divided into 100 sec bins |
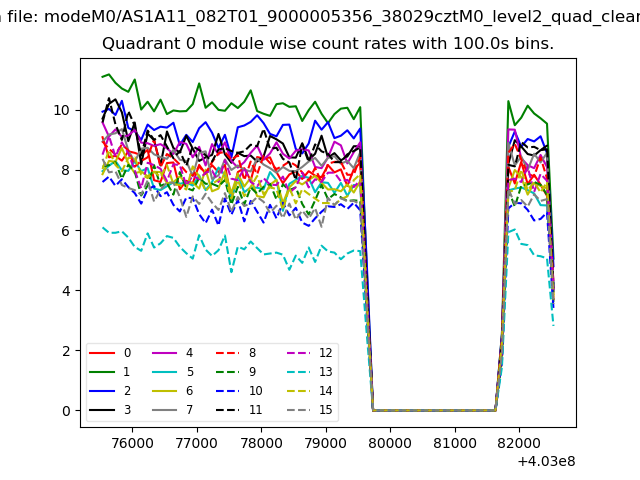 |
 |
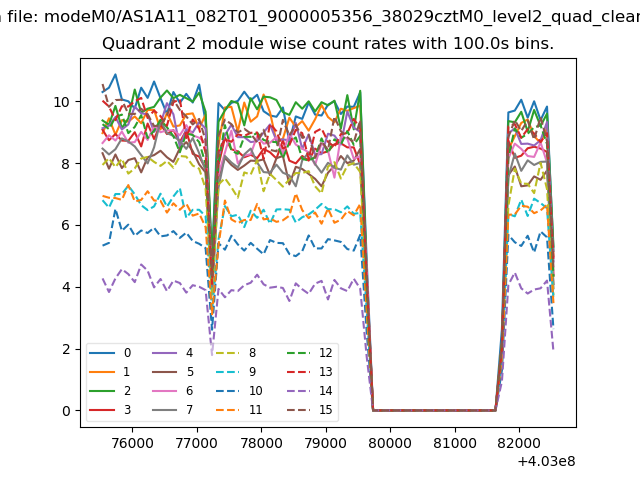
| Module-wise count rates for Quadrant B Data is divided into 100 sec bins |
 |
 |
| Module-wise count rates for Quadrant C Data is divided into 100 sec bins |
 |
 |
| Module-wise count rates for Quadrant D Data is divided into 100 sec bins |
 |
 |
| Parameter | Plot |
|---|---|
| CZT HV Monitor | 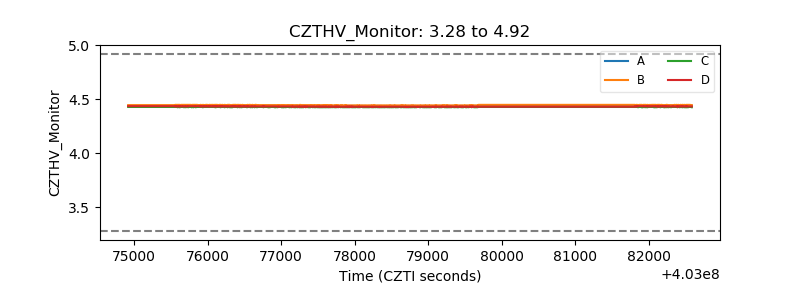 |
| D_VDD | 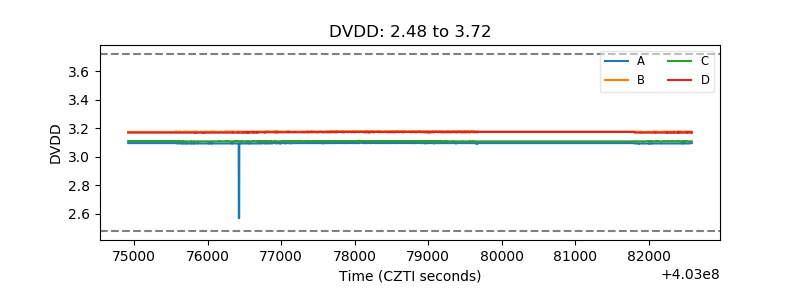 |
| Temperature 1 | 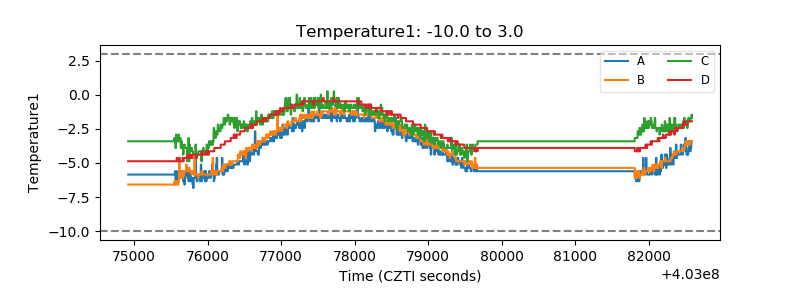 |
| Veto HV Monitor | 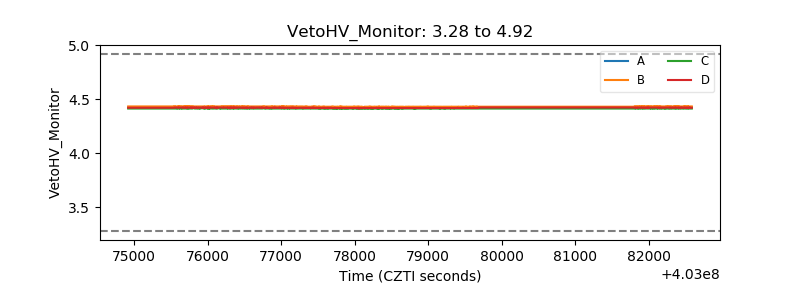 |
| Veto LLD | 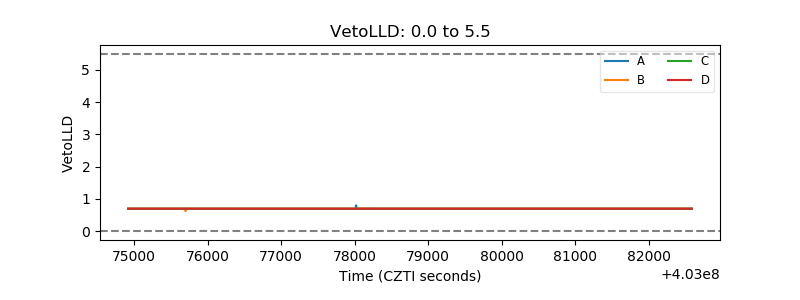 |
| Alpha Counter | 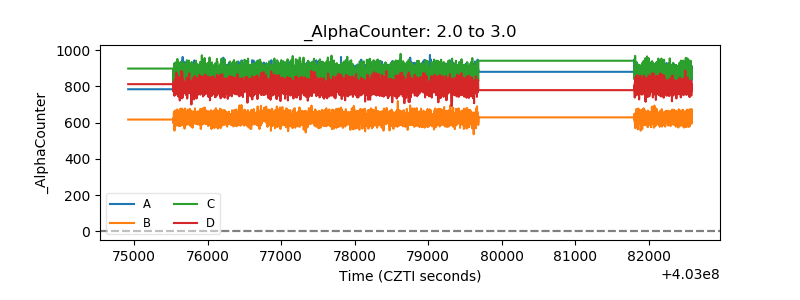 |
| _CPM_Rate | 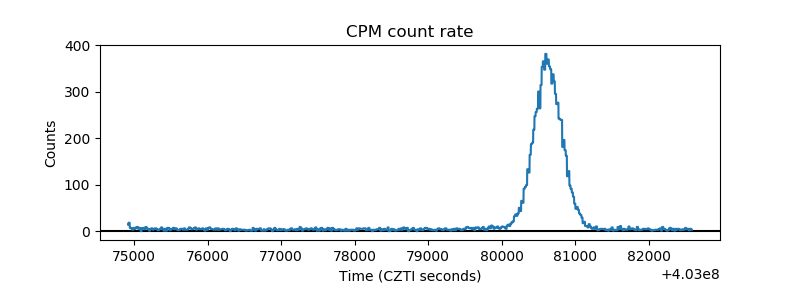 |
| CZT Counter | 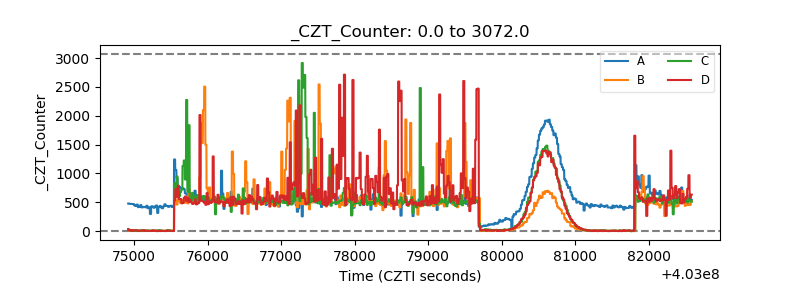 |
| +2.5 Volts monitor | 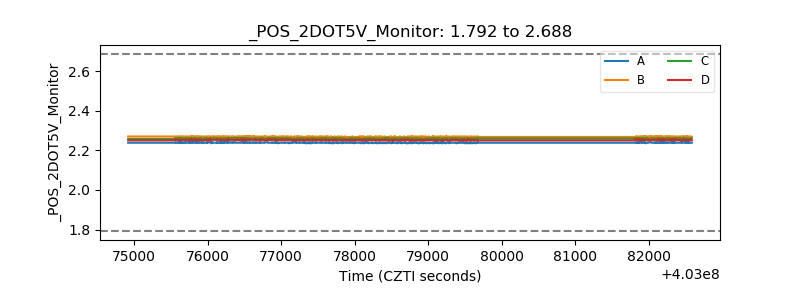 |
| +5 Volts monitor | 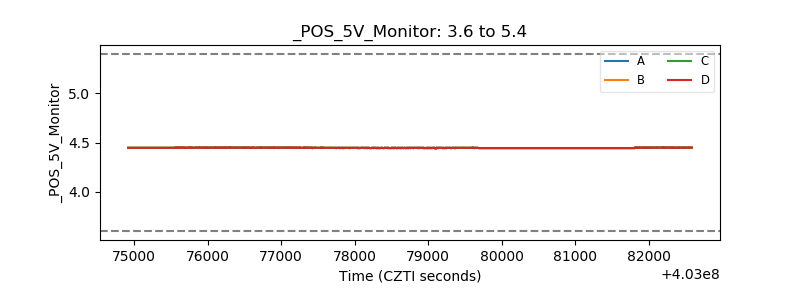 |
| _ROLL_ROT | 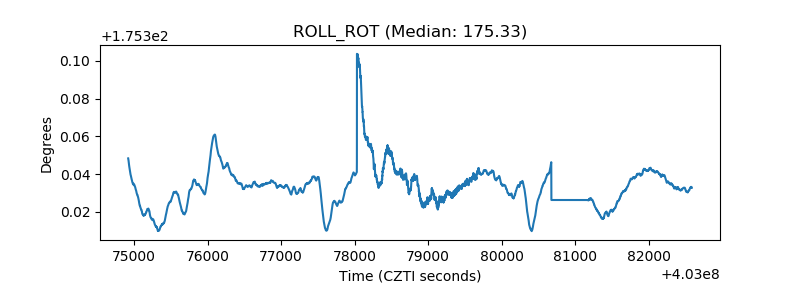 |
| _Roll_DEC | 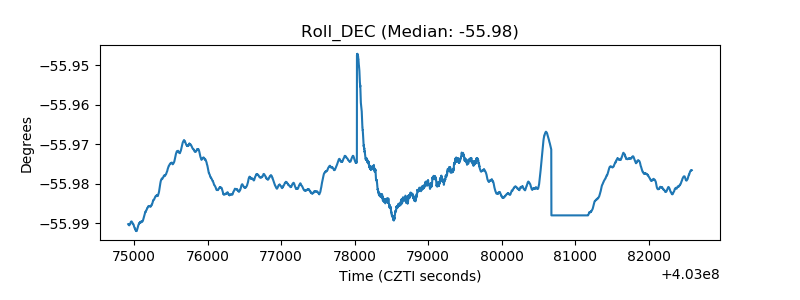 |
| _Roll_RA | 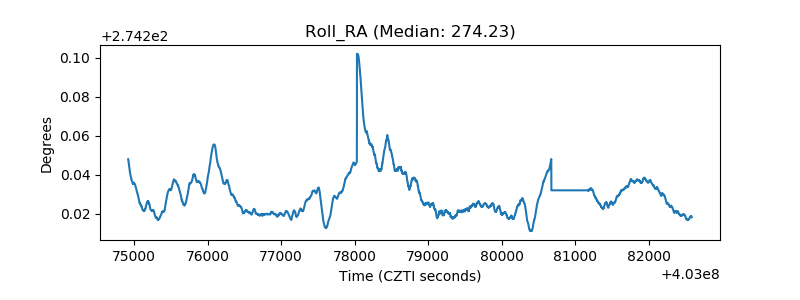 |
| Veto Counter | 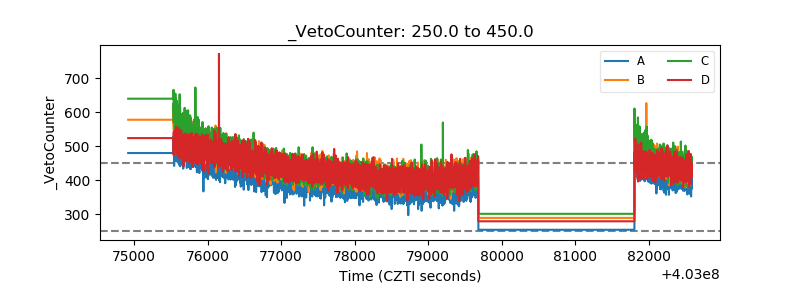 |