| Param | Original file | Final file |
|---|---|---|
| Filename | modeM0/AS1A11_082T01_9000005356_38030cztM0_level2.fits | modeM0/AS1A11_082T01_9000005356_38030cztM0_level2_quad_clean.evt |
| Size (bytes) | 382,060,800 | 89,732,160 |
| Size | 364.4 MB | 85.6 MB |
| Events in quadrant A | 2,849,430 | 613,518 |
| Events in quadrant B | 2,809,013 | 628,484 |
| Events in quadrant C | 2,621,894 | 621,520 |
| Events in quadrant D | 5,465,558 | 496,444 |
| Mode M0 | |||
|---|---|---|---|
| Quadrant | BADHDUFLAG | Total packets | Discarded packets |
| A | 0 | 11515 | 3 |
| B | 0 | 11588 | 2 |
| C | 0 | 10610 | 2 |
| D | 0 | 19623 | 2 |
| Mode SS | |||
|---|---|---|---|
| Quadrant | BADHDUFLAG | Total packets | Discarded packets |
| A | 0 | 104 | 0 |
| B | 0 | 104 | 0 |
| C | 0 | 104 | 0 |
| D | 0 | 104 | 0 |
| Mode M9 | |||
|---|---|---|---|
| Quadrant | BADHDUFLAG | Total packets | Discarded packets |
| A | 0 | 25 | 0 |
| B | 0 | 25 | 0 |
| C | 0 | 25 | 0 |
| D | 0 | 26 | 0 |
| Quadrant | Total seconds | Saturated seconds | Saturation percentage |
|---|---|---|---|
| A | 5098 | 16 | 0.313849% |
| B | 5098 | 75 | 1.471165% |
| C | 5098 | 14 | 0.274617% |
| D | 5098 | 769 | 15.084347% |
Noise dominated data is calculated using 1-second bins in cleaned event files. If a bin has >2000 counts, and if more than 50% of those come from <1% of pixels, then it is considered to be noise-dominated and hence unusable.
| Quadrant | # 1 sec bins | Bins with >0 counts | Bins with >2000 counts | High rate bins dominated by noise | Noise dominated (total time) | Noise dominated (detector-on time) | Marked lightcurve |
|---|---|---|---|---|---|---|---|
| A | 7071 | 5099 | 7 | 7 | 0.10% | 0.14% | 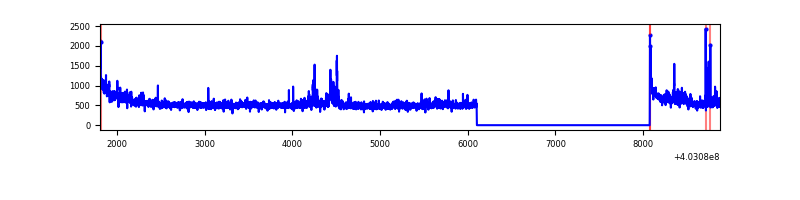 |
| B | 7071 | 5099 | 49 | 49 | 0.69% | 0.96% | 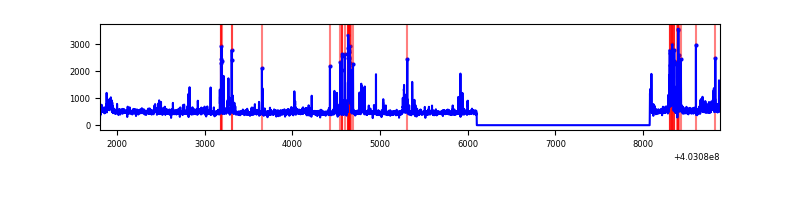 |
| C | 7071 | 5099 | 8 | 8 | 0.11% | 0.16% | 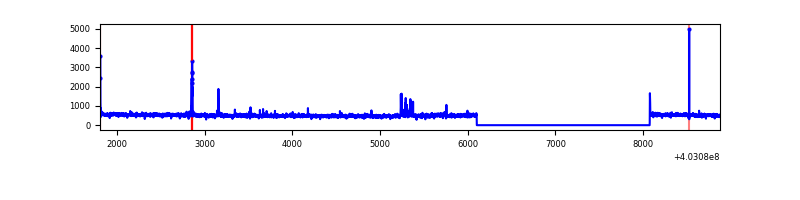 |
| D | 7071 | 5099 | 751 | 751 | 10.62% | 14.73% | 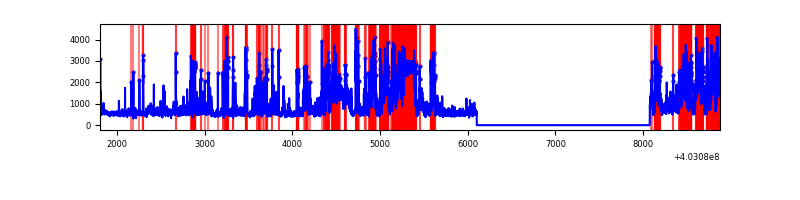 |
Top three noisy pixels from each quadrant. If the there are fewer than three noisy pixels in the level2.evt file, extra rows are filled as -1
| Pixel properties | Quadrant properties | ||||||
|---|---|---|---|---|---|---|---|
| Quadrant | DetID | PixID | Counts | Sigma | Mean | Median | Sigma |
| A | 10 | 83 | 364954 | 3056.8 | 591 | 581 | 119.2 |
| A | 12 | 16 | 123032 | 1027.27 | 591 | 581 | 119.2 |
| A | 12 | 194 | 22037 | 180.0 | 591 | 581 | 119.2 |
| B | 5 | 255 | 246266 | 2188.2 | 589 | 573 | 112.3 |
| B | 0 | 213 | 85784 | 758.91 | 589 | 573 | 112.3 |
| B | 5 | 172 | 58394 | 514.97 | 589 | 573 | 112.3 |
| C | 15 | 214 | 220495 | 1631.01 | 580 | 585 | 134.8 |
| C | 1 | 23 | 33700 | 245.6 | 580 | 585 | 134.8 |
| C | 3 | 233 | 33262 | 242.36 | 580 | 585 | 134.8 |
| D | 12 | 227 | 2092011 | 15648.73 | 546 | 530 | 133.7 |
| D | 12 | 233 | 481971 | 3602.2 | 546 | 530 | 133.7 |
| D | 2 | 250 | 245094 | 1829.86 | 546 | 530 | 133.7 |
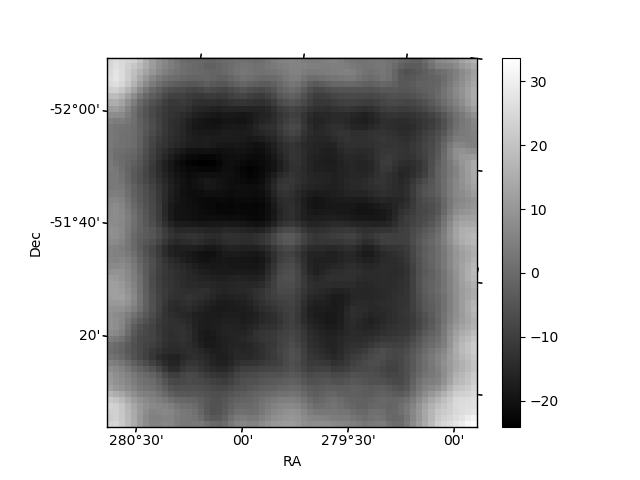
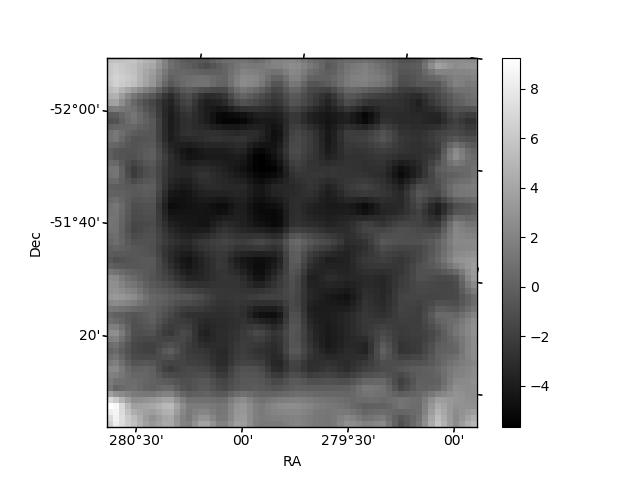
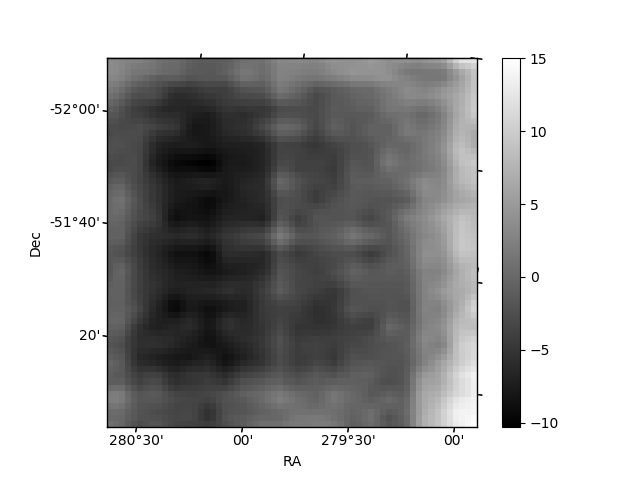
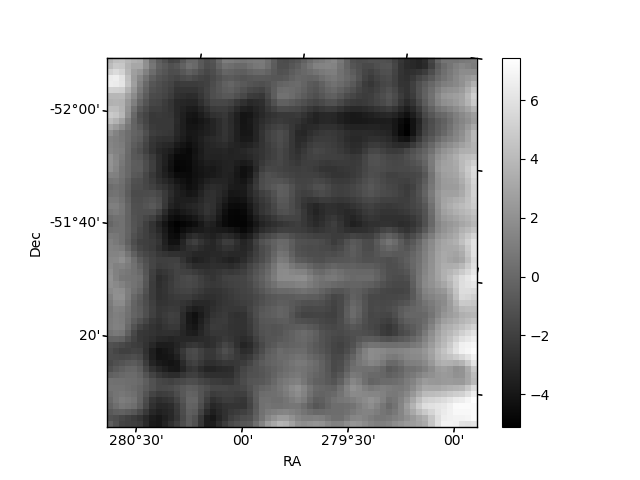
Histogram calculated using DETX and DETY for each event in the final _common_clean file
| Quadrant A | 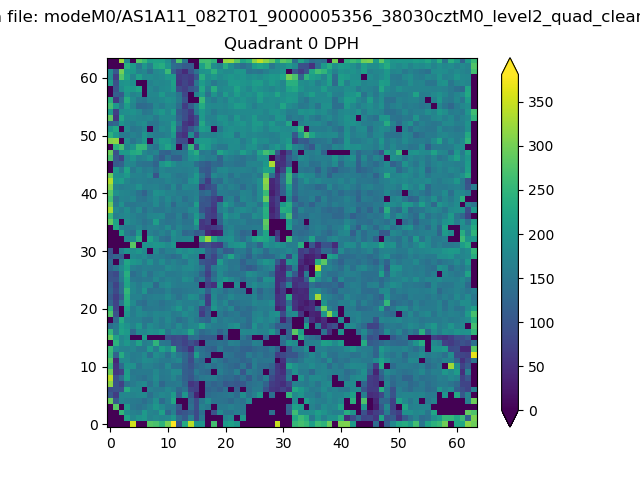 |
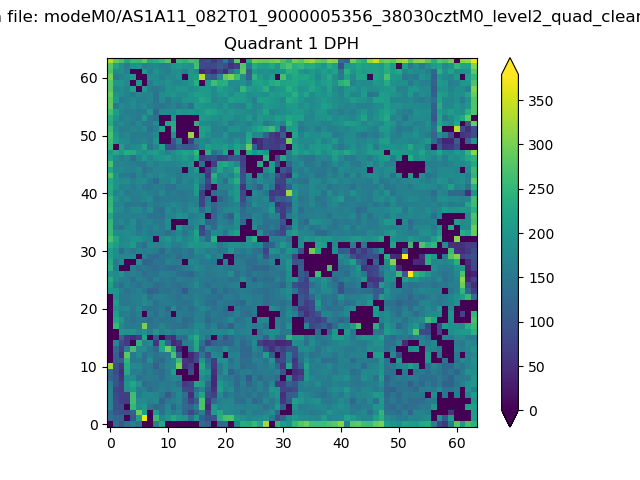 |
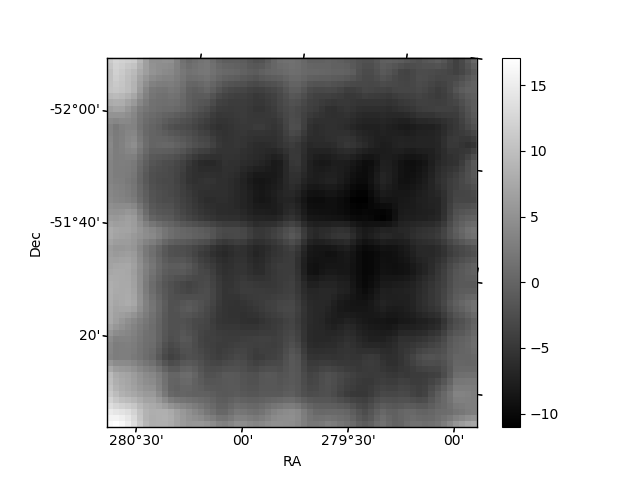
Quadrant B |
|---|---|---|---|
| Quadrant D | 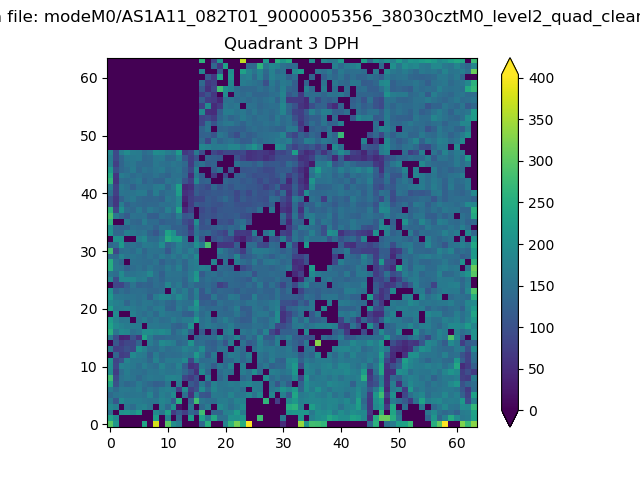 |
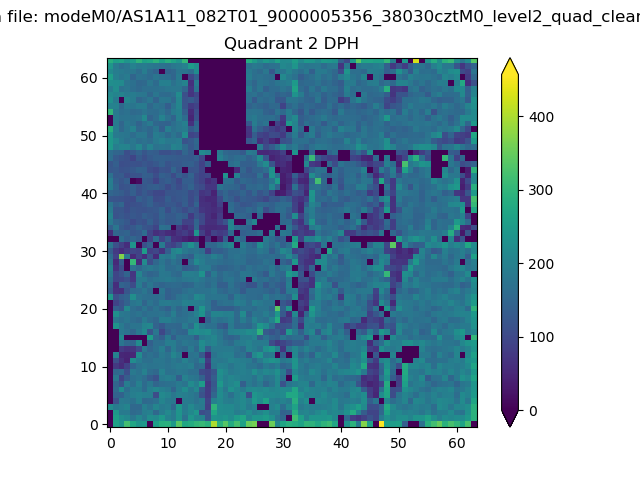 |
Quadrant C |
| Plot type | Count rate plots | Images |
|---|---|---|
| Comparison with Poisson distribution Blue bars denote a histogram of data divided into 1 sec bins. Red curve is a Poisson curve with rate = median count rate of data. |
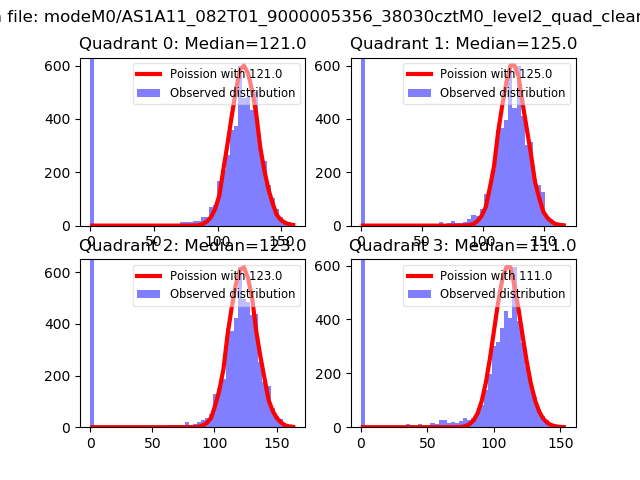 |
 |
| Quadrant-wise count rates Data is divided into 100 sec bins |
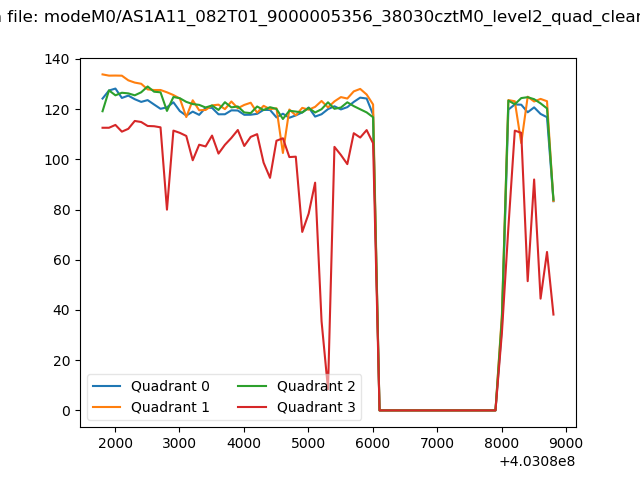 |
|
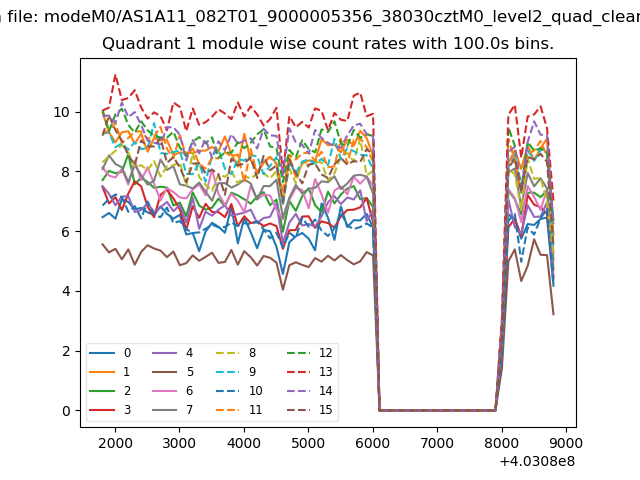
| Module-wise count rates for Quadrant A Data is divided into 100 sec bins |
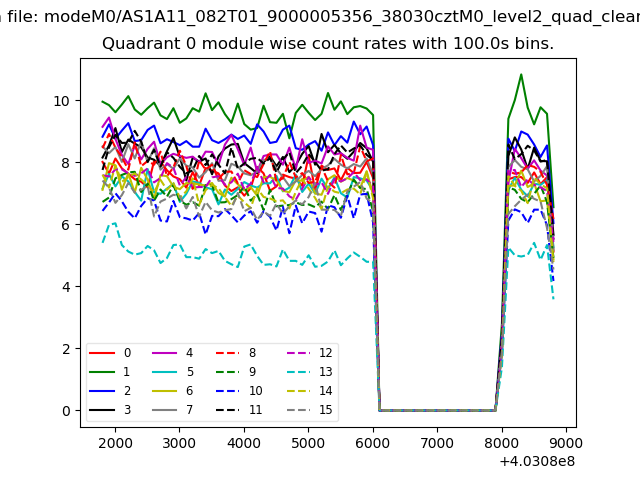 |
 |
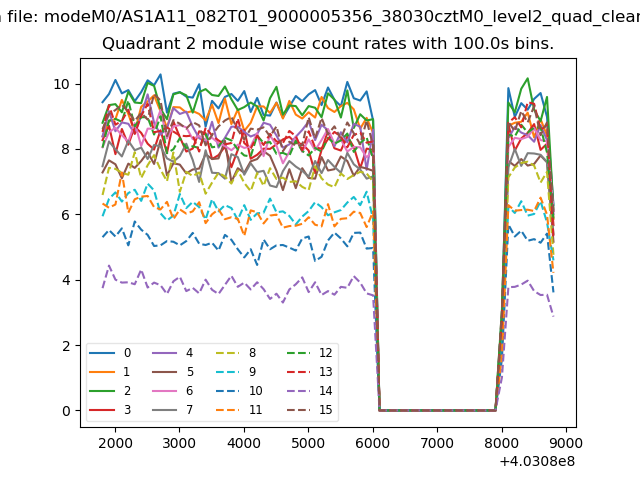
| Module-wise count rates for Quadrant B Data is divided into 100 sec bins |
 |
 |
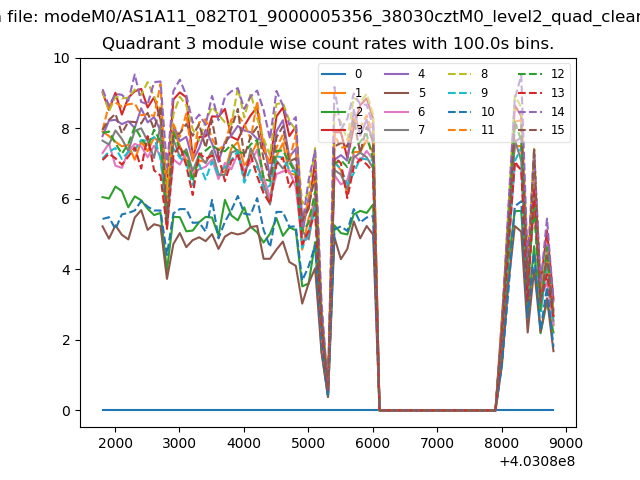
| Module-wise count rates for Quadrant C Data is divided into 100 sec bins |
 |
 |
| Module-wise count rates for Quadrant D Data is divided into 100 sec bins |
 |
 |
| Parameter | Plot |
|---|---|
| CZT HV Monitor | 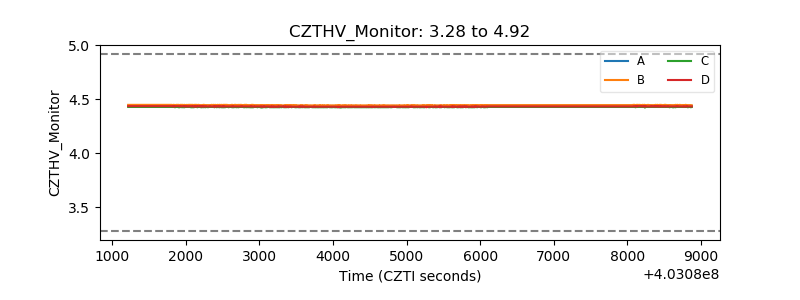 |
| D_VDD | 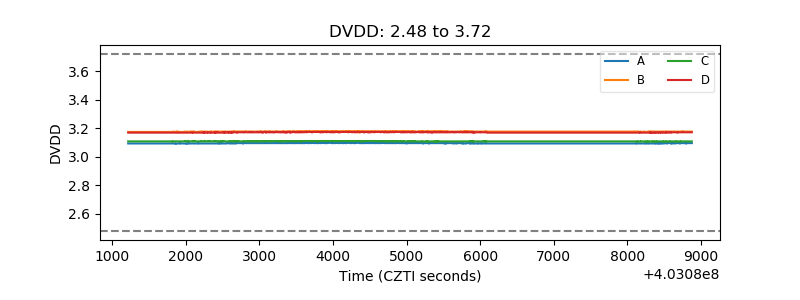 |
| Temperature 1 | 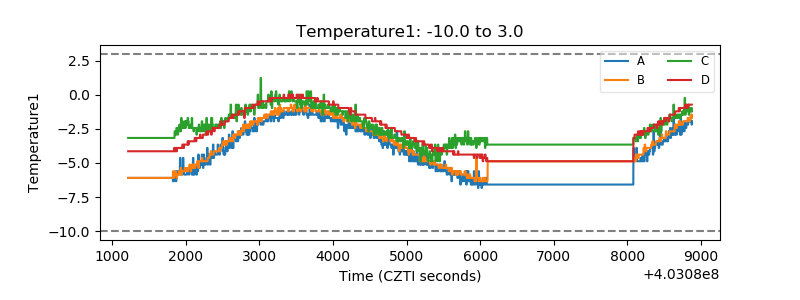 |
| Veto HV Monitor |  |
| Veto LLD | 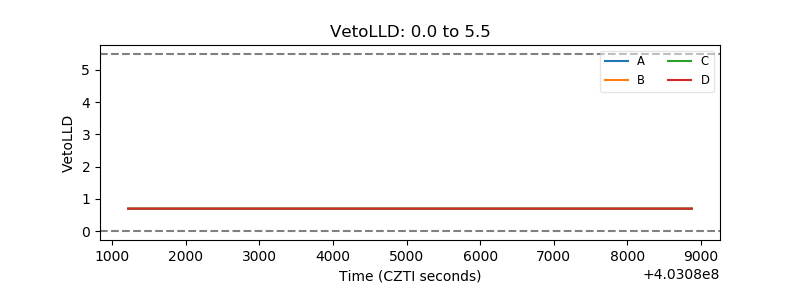 |
| Alpha Counter | 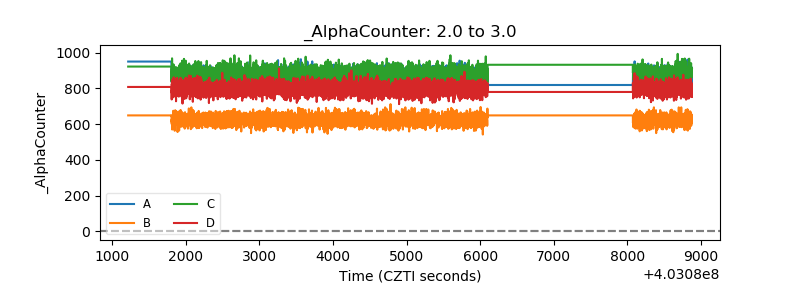 |
| _CPM_Rate | 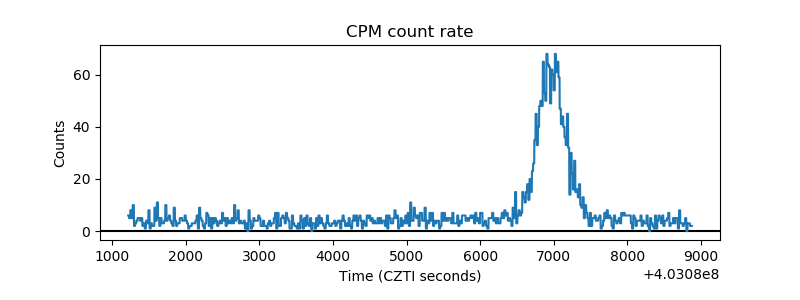 |
| CZT Counter | 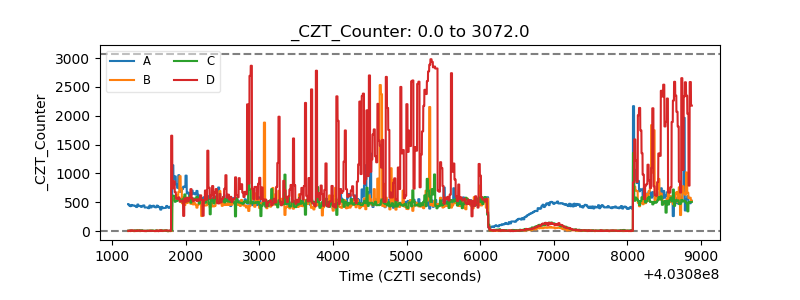 |
| +2.5 Volts monitor | 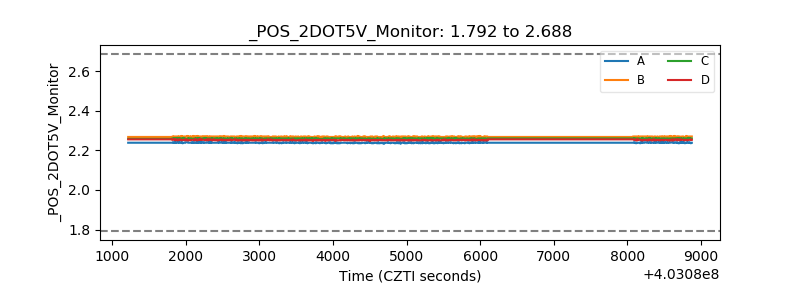 |
| +5 Volts monitor | 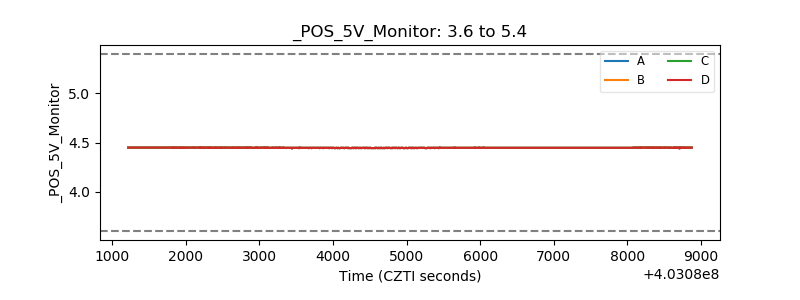 |
| _ROLL_ROT | 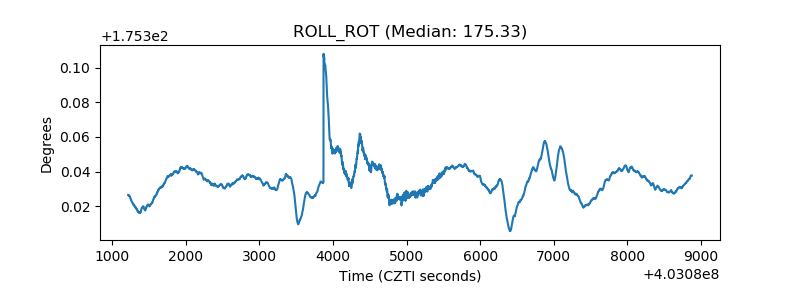 |
| _Roll_DEC | 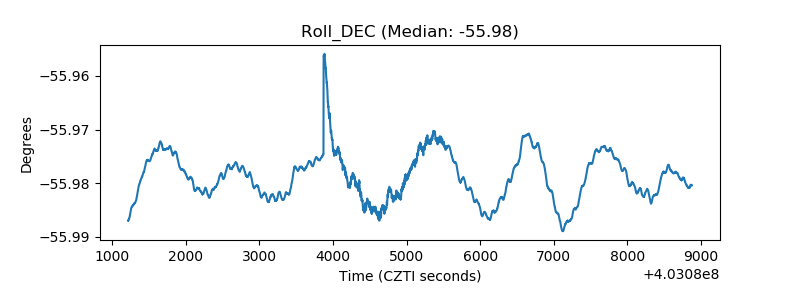 |
| _Roll_RA | 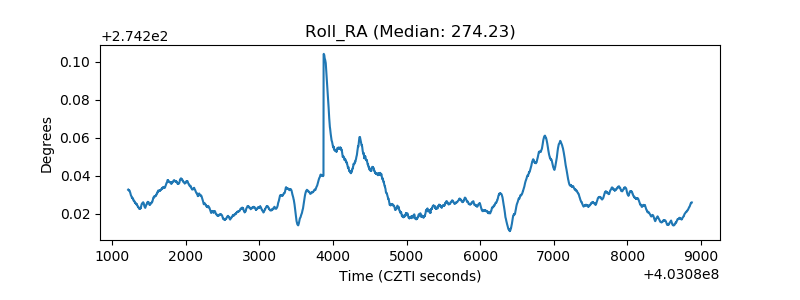 |
| Veto Counter | 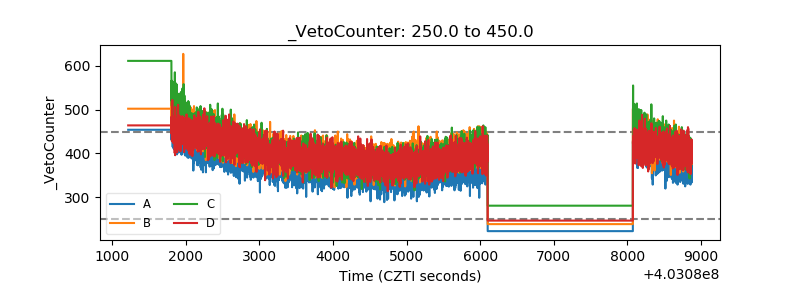 |