| Param | Original file | Final file |
|---|---|---|
| Filename | modeM0/AS1A11_024T01_9000005358_38032cztM0_level2.fits | modeM0/AS1A11_024T01_9000005358_38032cztM0_level2_quad_clean.evt |
| Size (bytes) | 404,720,640 | 103,294,080 |
| Size | 386.0 MB | 98.5 MB |
| Events in quadrant A | 3,205,468 | 702,951 |
| Events in quadrant B | 3,773,821 | 700,044 |
| Events in quadrant C | 2,959,463 | 694,429 |
| Events in quadrant D | 4,579,953 | 614,255 |
| Mode M9 | |||
|---|---|---|---|
| Quadrant | BADHDUFLAG | Total packets | Discarded packets |
| A | 0 | 18 | 0 |
| B | 0 | 18 | 0 |
| C | 0 | 18 | 0 |
| D | 0 | 19 | 0 |
| Mode SS | |||
|---|---|---|---|
| Quadrant | BADHDUFLAG | Total packets | Discarded packets |
| A | 0 | 122 | 0 |
| B | 0 | 122 | 0 |
| C | 0 | 122 | 0 |
| D | 0 | 122 | 0 |
| Mode M0 | |||
|---|---|---|---|
| Quadrant | BADHDUFLAG | Total packets | Discarded packets |
| A | 0 | 13073 | 3 |
| B | 0 | 14977 | 2 |
| C | 0 | 12326 | 2 |
| D | 0 | 17466 | 2 |
| Quadrant | Total seconds | Saturated seconds | Saturation percentage |
|---|---|---|---|
| A | 5953 | 22 | 0.369562% |
| B | 5953 | 194 | 3.258861% |
| C | 5953 | 10 | 0.167983% |
| D | 5953 | 274 | 4.602721% |
Noise dominated data is calculated using 1-second bins in cleaned event files. If a bin has >2000 counts, and if more than 50% of those come from <1% of pixels, then it is considered to be noise-dominated and hence unusable.
| Quadrant | # 1 sec bins | Bins with >0 counts | Bins with >2000 counts | High rate bins dominated by noise | Noise dominated (total time) | Noise dominated (detector-on time) | Marked lightcurve |
|---|---|---|---|---|---|---|---|
| A | 7325 | 5954 | 3 | 3 | 0.04% | 0.05% | 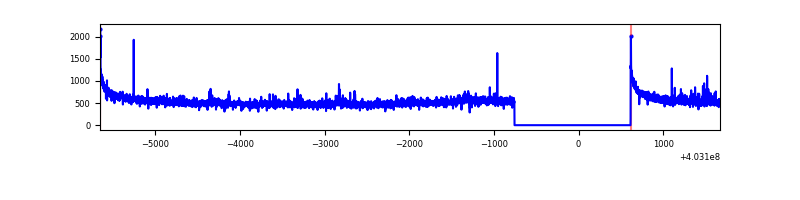 |
| B | 7325 | 5954 | 145 | 145 | 1.98% | 2.44% | 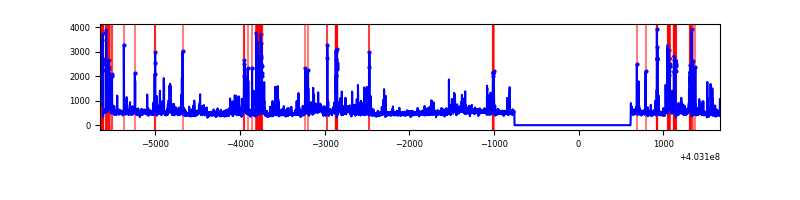 |
| C | 7325 | 5954 | 2 | 2 | 0.03% | 0.03% | 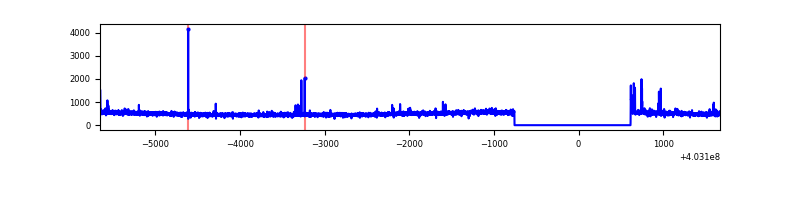 |
| D | 7325 | 5954 | 248 | 248 | 3.39% | 4.17% | 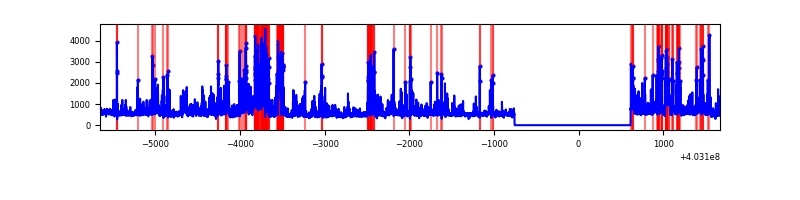 |
Top three noisy pixels from each quadrant. If the there are fewer than three noisy pixels in the level2.evt file, extra rows are filled as -1
| Pixel properties | Quadrant properties | ||||||
|---|---|---|---|---|---|---|---|
| Quadrant | DetID | PixID | Counts | Sigma | Mean | Median | Sigma |
| A | 10 | 83 | 430261 | 3011.02 | 691 | 678 | 142.7 |
| A | 12 | 16 | 49719 | 343.74 | 691 | 678 | 142.7 |
| A | 12 | 189 | 20695 | 140.3 | 691 | 678 | 142.7 |
| B | 5 | 184 | 331253 | 2515.04 | 678 | 659 | 131.4 |
| B | 5 | 172 | 196145 | 1487.19 | 678 | 659 | 131.4 |
| B | 5 | 255 | 163422 | 1238.24 | 678 | 659 | 131.4 |
| C | 15 | 214 | 252654 | 1602.23 | 672 | 676 | 157.3 |
| C | 1 | 23 | 32087 | 199.73 | 672 | 676 | 157.3 |
| C | 14 | 254 | 20560 | 126.43 | 672 | 676 | 157.3 |
| D | 12 | 227 | 567825 | 3511.48 | 660 | 643 | 161.5 |
| D | 2 | 250 | 257864 | 1592.48 | 660 | 643 | 161.5 |
| D | 13 | 171 | 243305 | 1502.34 | 660 | 643 | 161.5 |
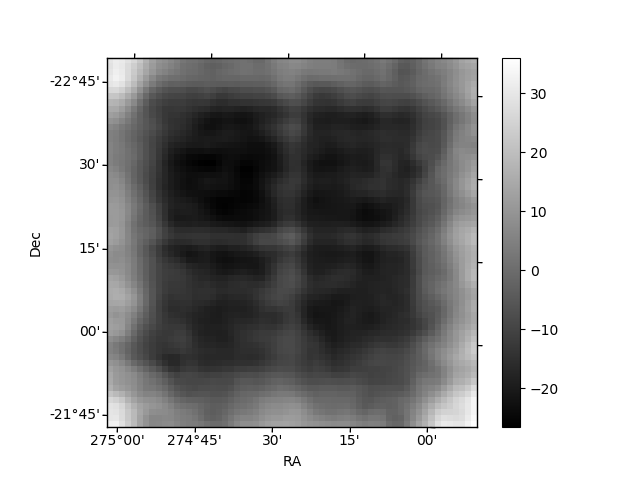
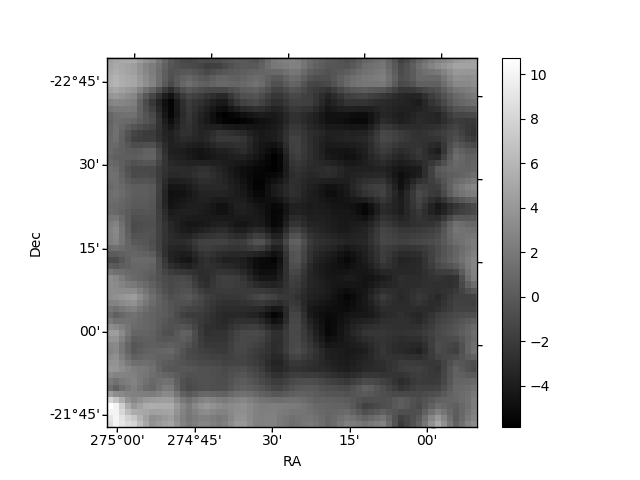
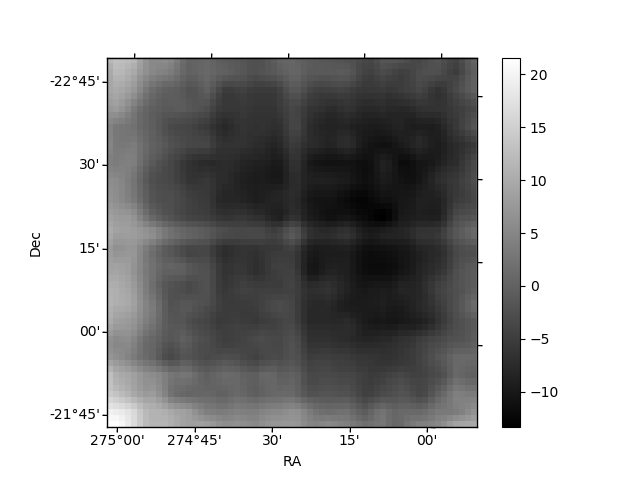
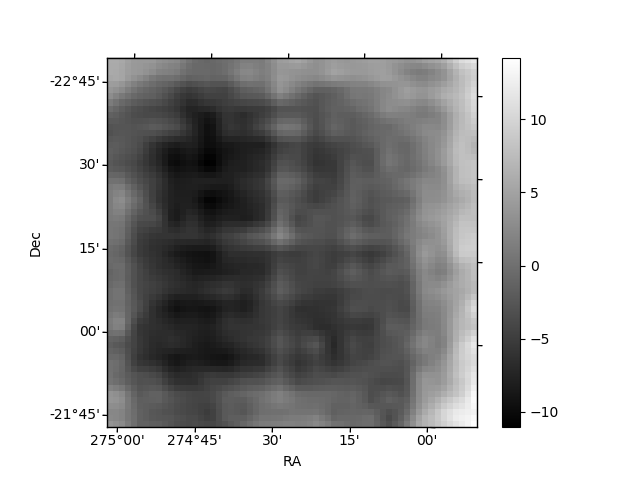
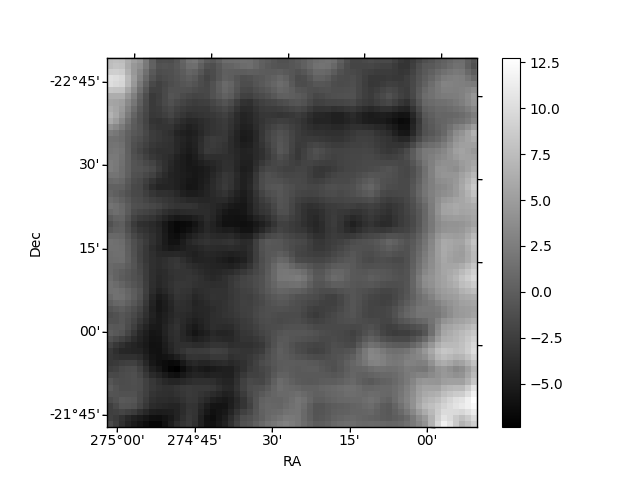
Histogram calculated using DETX and DETY for each event in the final _common_clean file
| Quadrant A | 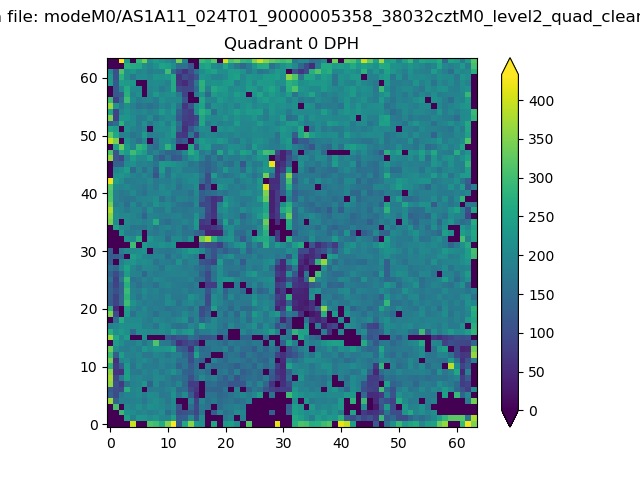 |
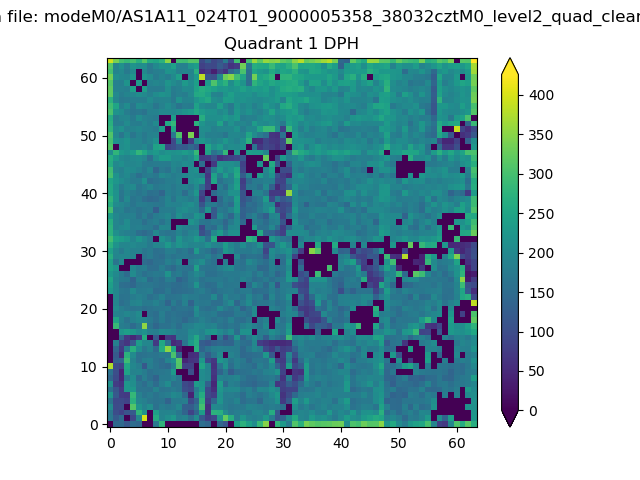 |
Quadrant B |
|---|---|---|---|
| Quadrant D | 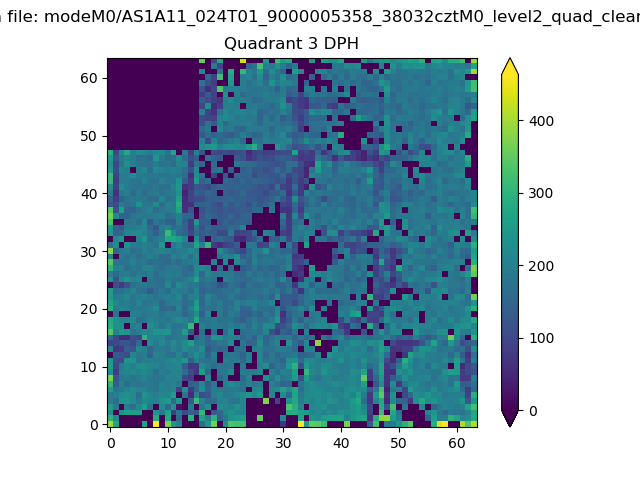 |
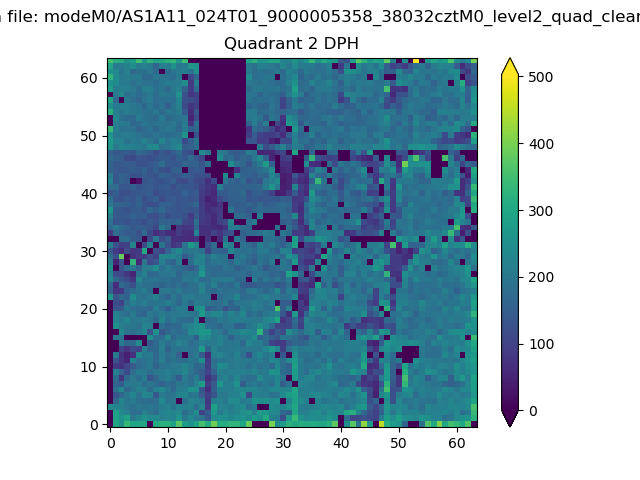 |
Quadrant C |
| Plot type | Count rate plots | Images |
|---|---|---|
| Comparison with Poisson distribution Blue bars denote a histogram of data divided into 1 sec bins. Red curve is a Poisson curve with rate = median count rate of data. |
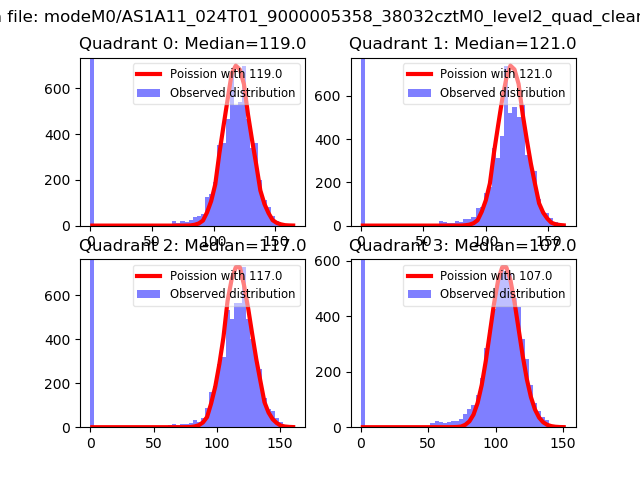 |
 |
| Quadrant-wise count rates Data is divided into 100 sec bins |
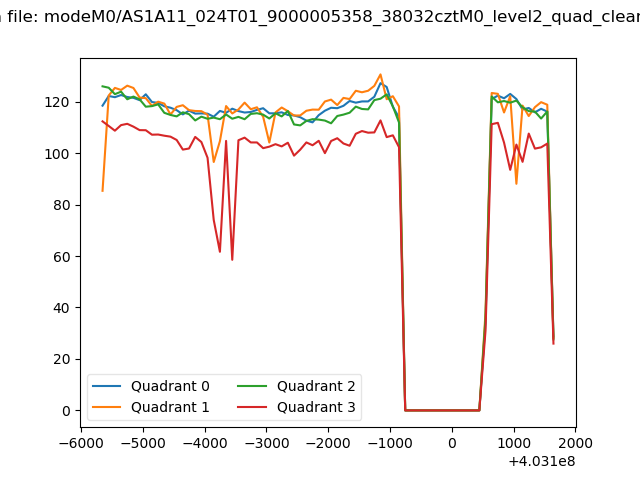 |
|
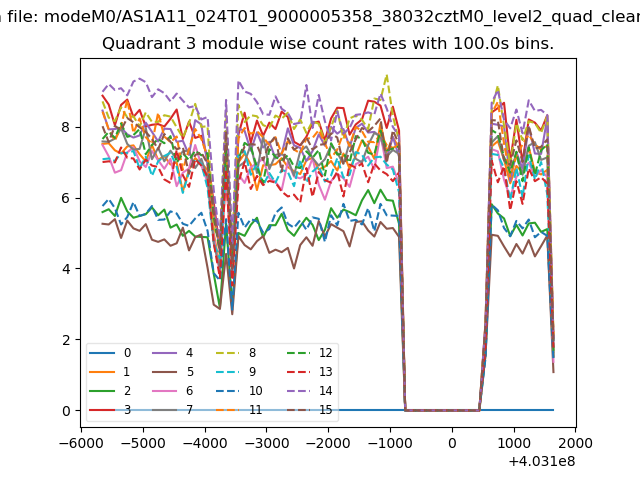
| Module-wise count rates for Quadrant A Data is divided into 100 sec bins |
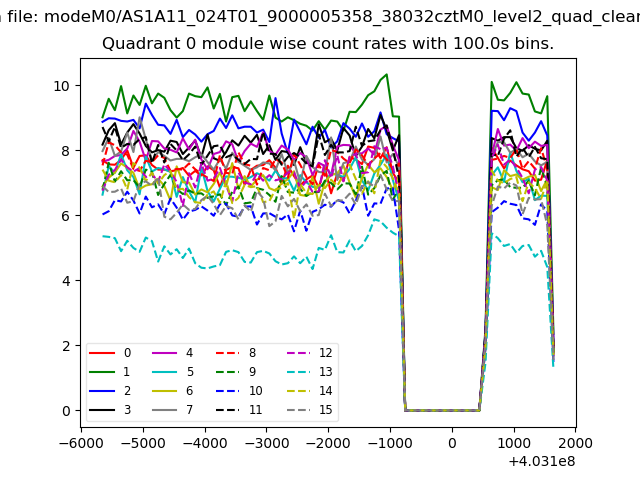 |
 |
| Module-wise count rates for Quadrant B Data is divided into 100 sec bins |
 |
 |
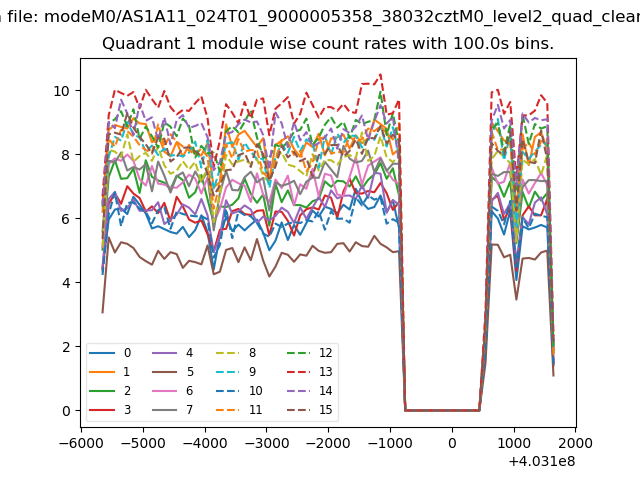
| Module-wise count rates for Quadrant C Data is divided into 100 sec bins |
 |
 |
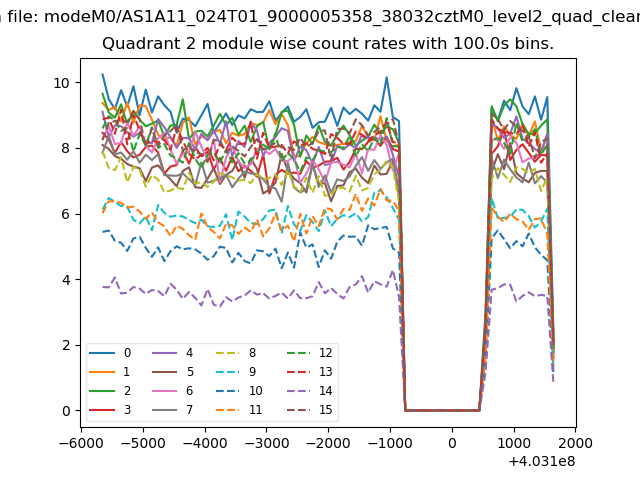
| Module-wise count rates for Quadrant D Data is divided into 100 sec bins |
 |
 |
| Parameter | Plot |
|---|---|
| CZT HV Monitor | 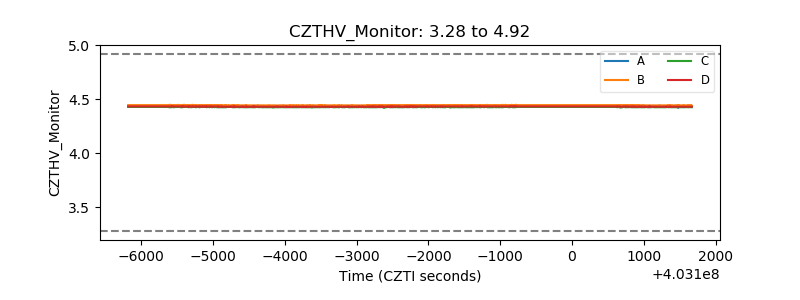 |
| D_VDD | 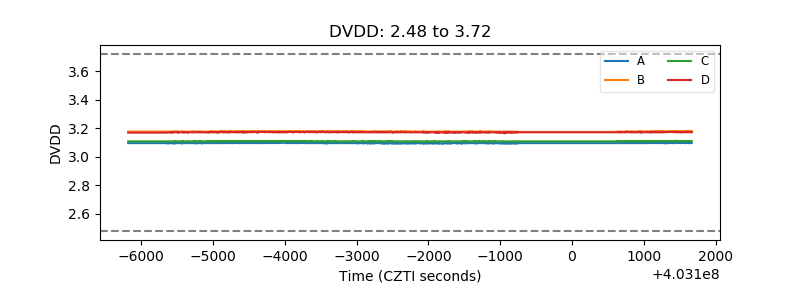 |
| Temperature 1 | 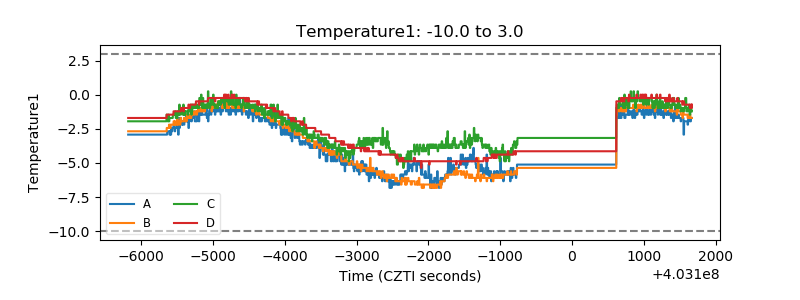 |
| Veto HV Monitor | 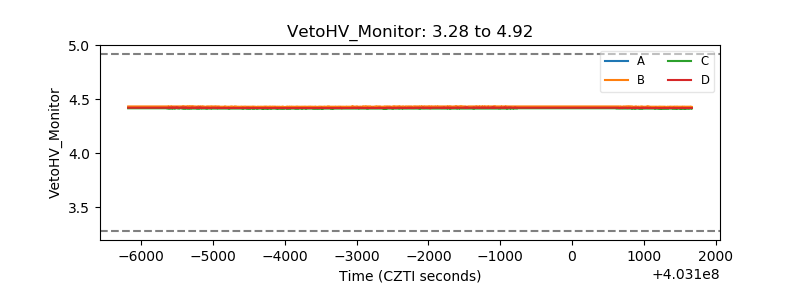 |
| Veto LLD | 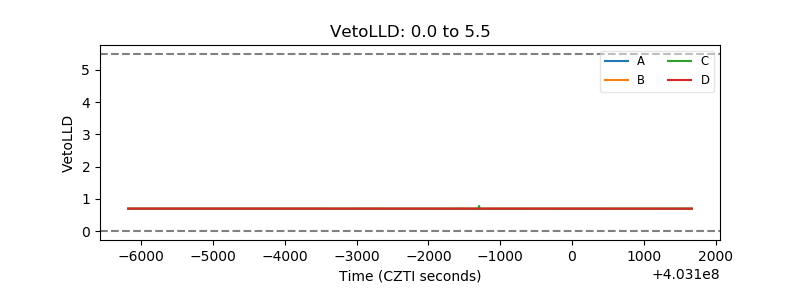 |
| Alpha Counter | 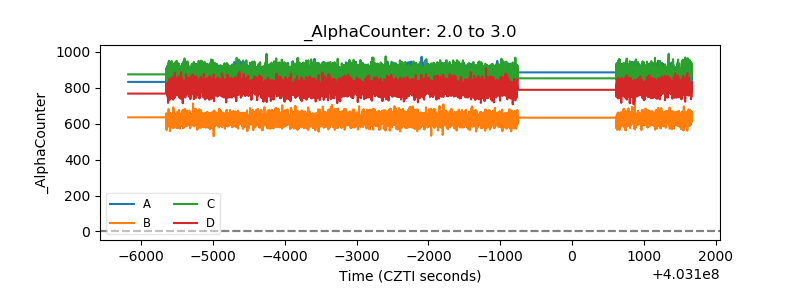 |
| _CPM_Rate | 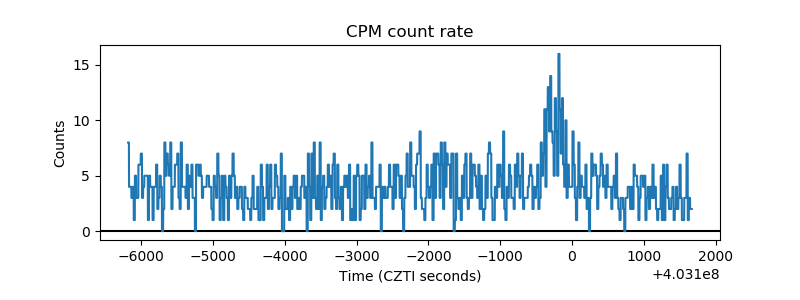 |
| CZT Counter | 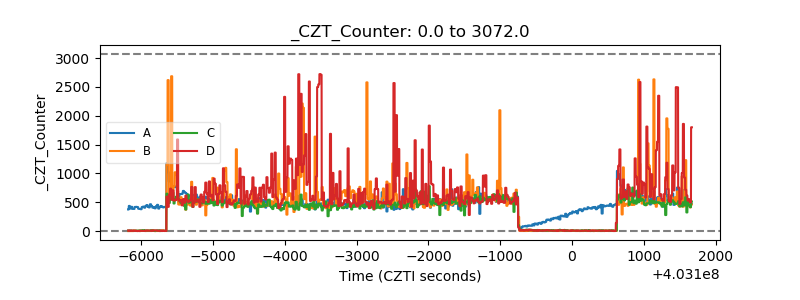 |
| +2.5 Volts monitor | 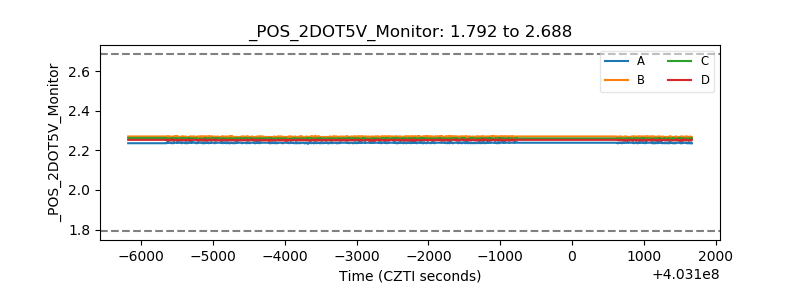 |
| +5 Volts monitor | 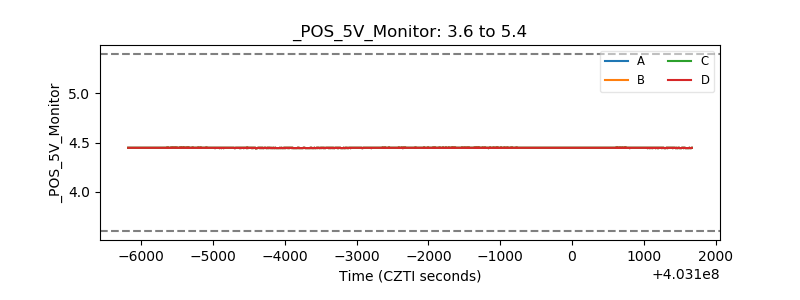 |
| _ROLL_ROT | 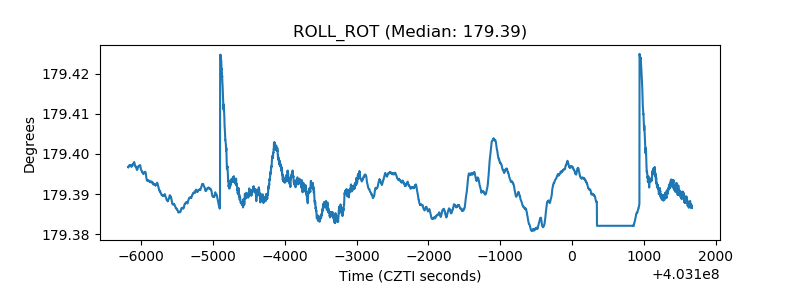 |
| _Roll_DEC | 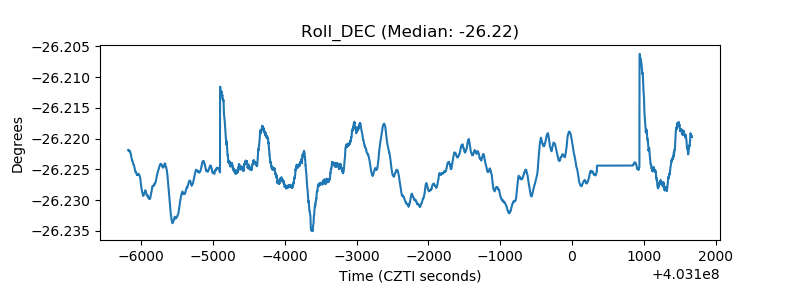 |
| _Roll_RA | 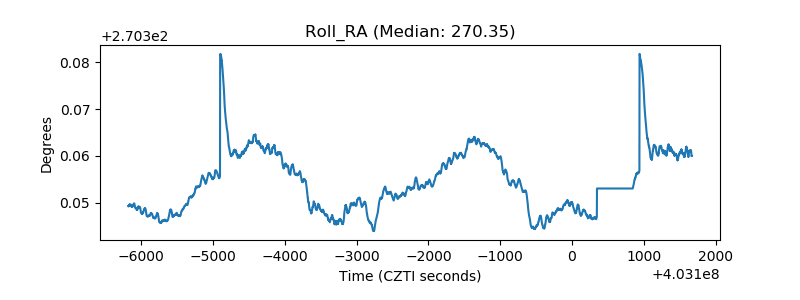 |
| Veto Counter | 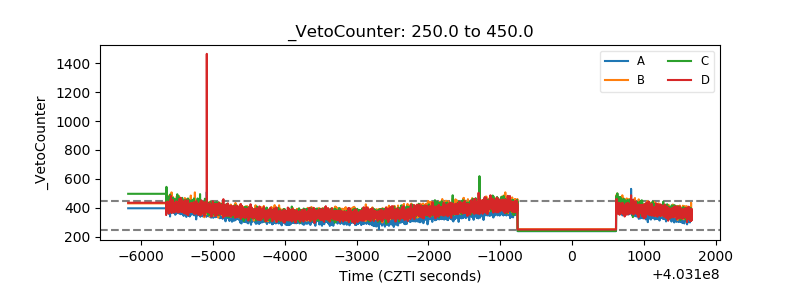 |