| Param | Original file | Final file |
|---|---|---|
| Filename | modeM0/AS1A11_024T01_9000005358_38033cztM0_level2.fits | modeM0/AS1A11_024T01_9000005358_38033cztM0_level2_quad_clean.evt |
| Size (bytes) | 372,214,080 | 98,573,760 |
| Size | 355.0 MB | 94.0 MB |
| Events in quadrant A | 3,170,699 | 669,374 |
| Events in quadrant B | 3,193,567 | 670,929 |
| Events in quadrant C | 3,309,347 | 646,420 |
| Events in quadrant D | 3,658,443 | 597,300 |
| Mode M9 | |||
|---|---|---|---|
| Quadrant | BADHDUFLAG | Total packets | Discarded packets |
| A | 0 | 13 | 0 |
| B | 0 | 13 | 0 |
| C | 0 | 13 | 0 |
| D | 0 | 13 | 0 |
| Mode SS | |||
|---|---|---|---|
| Quadrant | BADHDUFLAG | Total packets | Discarded packets |
| A | 0 | 116 | 0 |
| B | 0 | 116 | 0 |
| C | 0 | 116 | 0 |
| D | 0 | 116 | 0 |
| Mode M0 | |||
|---|---|---|---|
| Quadrant | BADHDUFLAG | Total packets | Discarded packets |
| A | 0 | 12901 | 2 |
| B | 0 | 13138 | 1 |
| C | 0 | 13404 | 1 |
| D | 0 | 14504 | 1 |
| Quadrant | Total seconds | Saturated seconds | Saturation percentage |
|---|---|---|---|
| A | 5734 | 23 | 0.401116% |
| B | 5734 | 136 | 2.371817% |
| C | 5734 | 113 | 1.970701% |
| D | 5734 | 99 | 1.726543% |
Noise dominated data is calculated using 1-second bins in cleaned event files. If a bin has >2000 counts, and if more than 50% of those come from <1% of pixels, then it is considered to be noise-dominated and hence unusable.
| Quadrant | # 1 sec bins | Bins with >0 counts | Bins with >2000 counts | High rate bins dominated by noise | Noise dominated (total time) | Noise dominated (detector-on time) | Marked lightcurve |
|---|---|---|---|---|---|---|---|
| A | 7047 | 5735 | 5 | 5 | 0.07% | 0.09% | 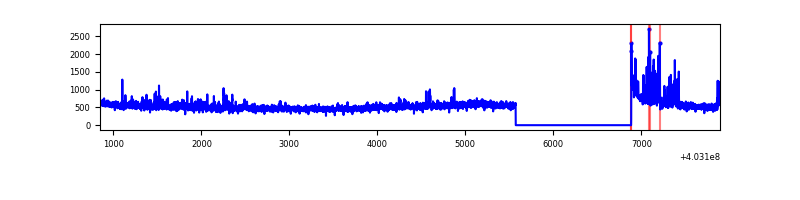 |
| B | 7047 | 5735 | 107 | 107 | 1.52% | 1.87% | 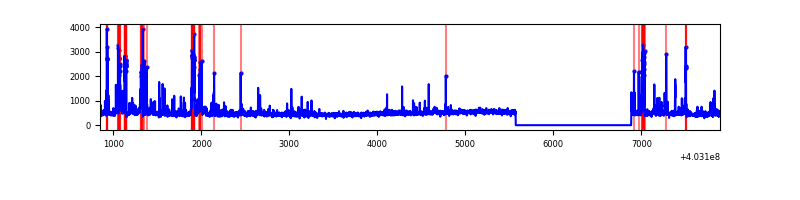 |
| C | 7047 | 5735 | 89 | 89 | 1.26% | 1.55% | 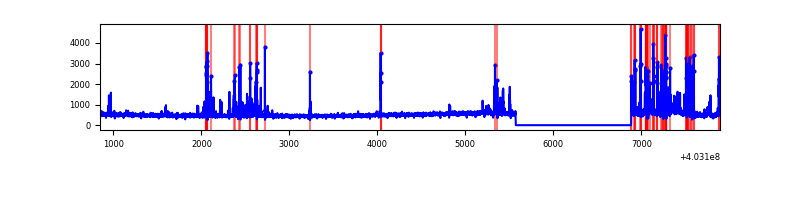 |
| D | 7047 | 5735 | 82 | 82 | 1.16% | 1.43% | 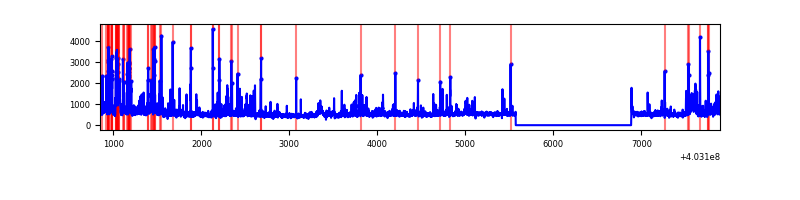 |
Top three noisy pixels from each quadrant. If the there are fewer than three noisy pixels in the level2.evt file, extra rows are filled as -1
| Pixel properties | Quadrant properties | ||||||
|---|---|---|---|---|---|---|---|
| Quadrant | DetID | PixID | Counts | Sigma | Mean | Median | Sigma |
| A | 10 | 83 | 360245 | 2698.74 | 659 | 647 | 133.2 |
| A | 12 | 16 | 203340 | 1521.18 | 659 | 647 | 133.2 |
| A | 12 | 194 | 33918 | 249.69 | 659 | 647 | 133.2 |
| B | 5 | 184 | 212366 | 1665.0 | 652 | 636 | 127.2 |
| B | 5 | 200 | 112452 | 879.3 | 652 | 636 | 127.2 |
| B | 5 | 172 | 110829 | 866.54 | 652 | 636 | 127.2 |
| C | 1 | 23 | 529295 | 3553.35 | 636 | 641 | 148.8 |
| C | 15 | 214 | 238895 | 1601.42 | 636 | 641 | 148.8 |
| C | 14 | 67 | 17649 | 114.32 | 636 | 641 | 148.8 |
| D | 12 | 227 | 345519 | 2202.84 | 636 | 619 | 156.6 |
| D | 2 | 250 | 231785 | 1476.43 | 636 | 619 | 156.6 |
| D | 7 | 223 | 175678 | 1118.08 | 636 | 619 | 156.6 |
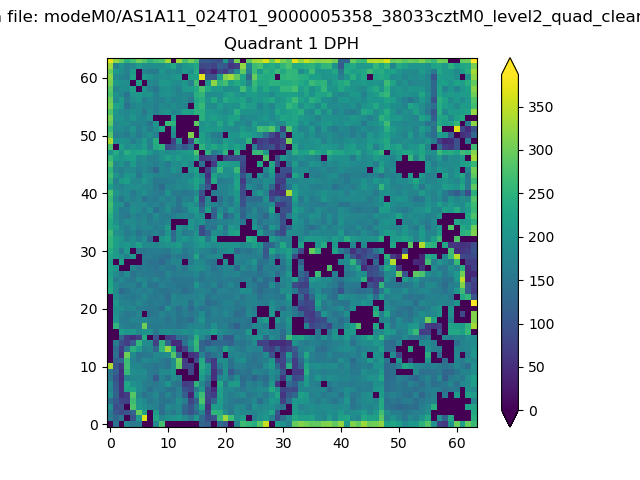
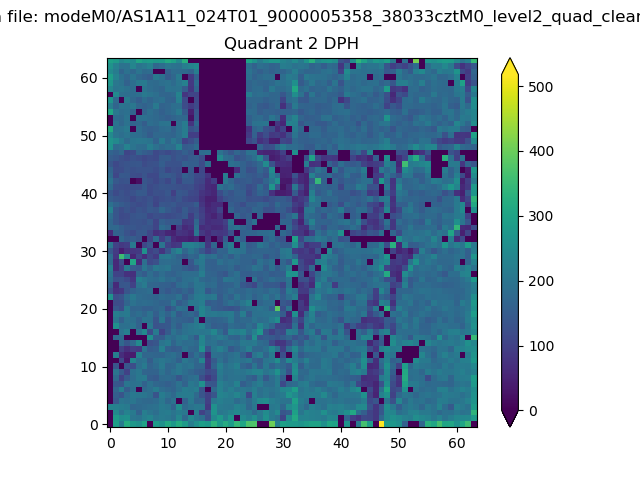
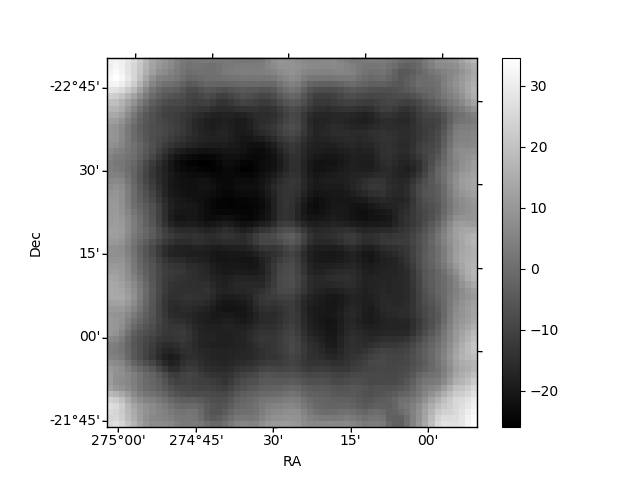
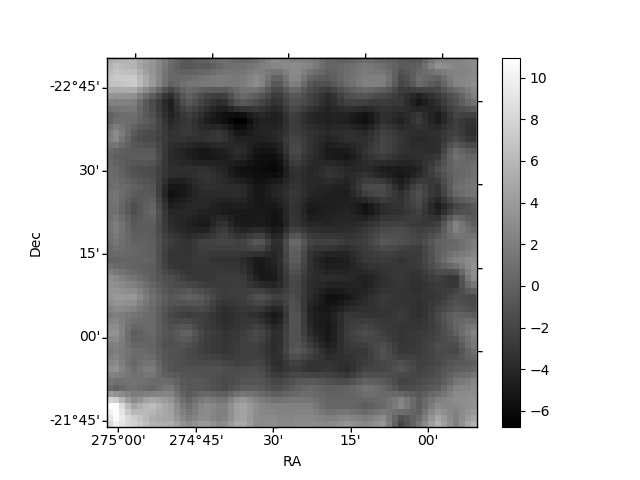
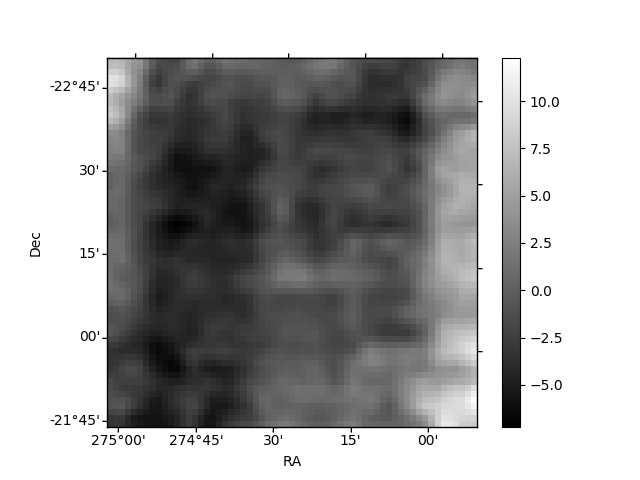
Histogram calculated using DETX and DETY for each event in the final _common_clean file
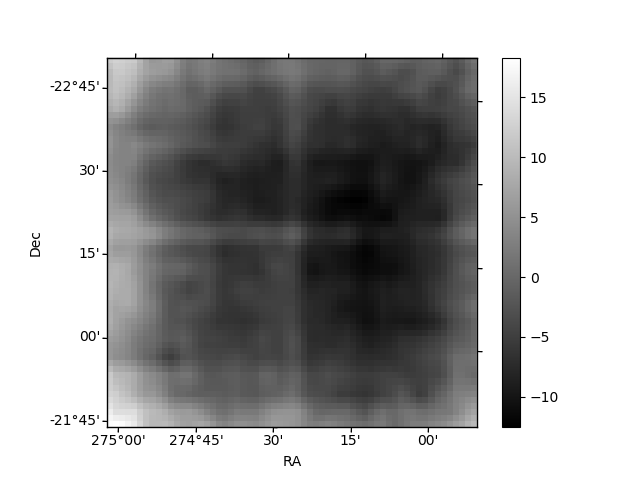
| Quadrant A |  |
 |
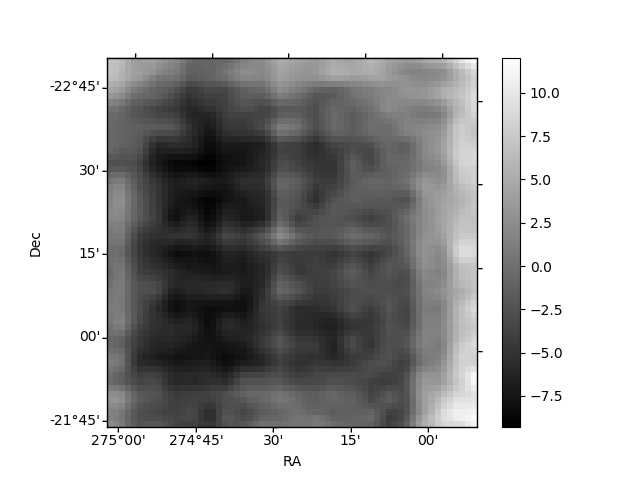
Quadrant B |
|---|---|---|---|
| Quadrant D | 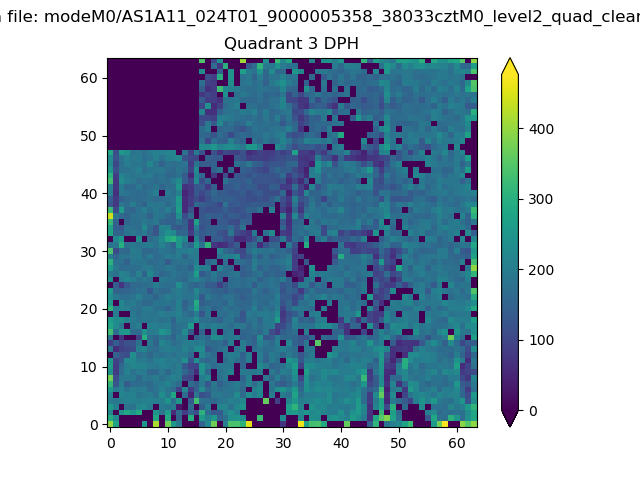 |
 |
Quadrant C |
| Plot type | Count rate plots | Images |
|---|---|---|
| Comparison with Poisson distribution Blue bars denote a histogram of data divided into 1 sec bins. Red curve is a Poisson curve with rate = median count rate of data. |
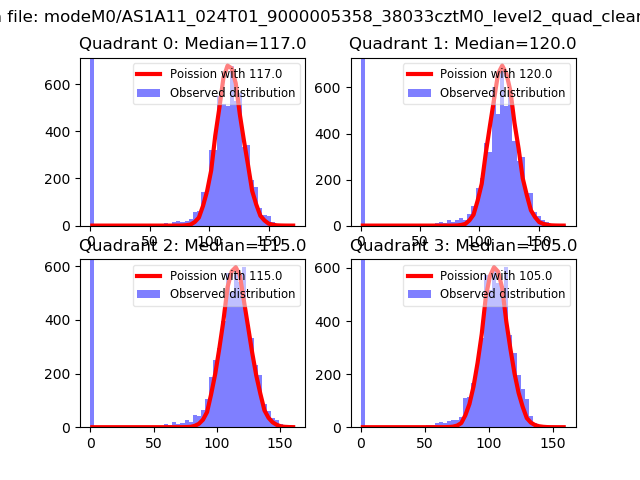 |
 |
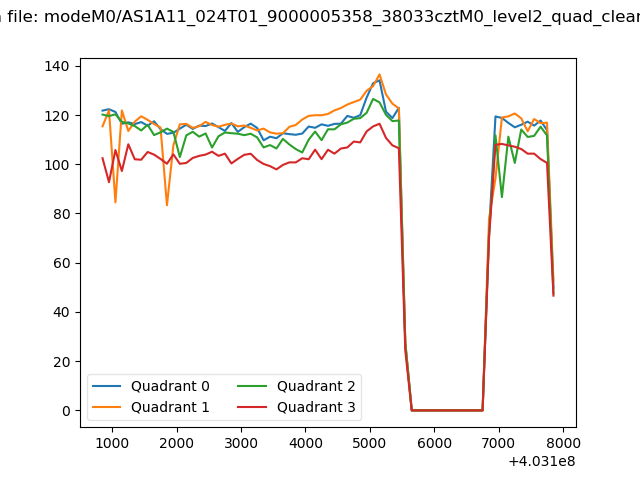
| Quadrant-wise count rates Data is divided into 100 sec bins |
 |
|
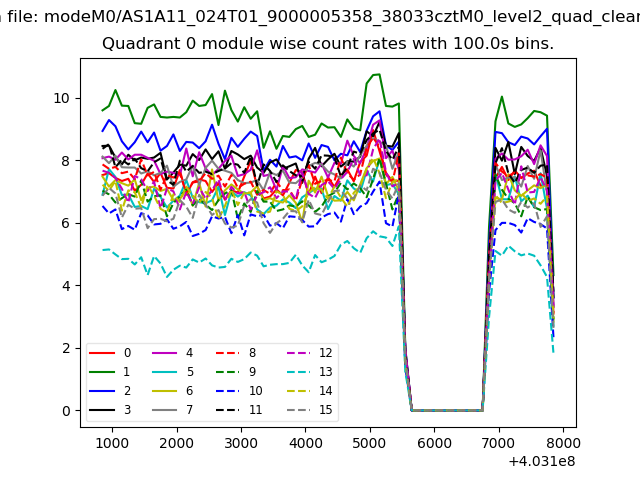
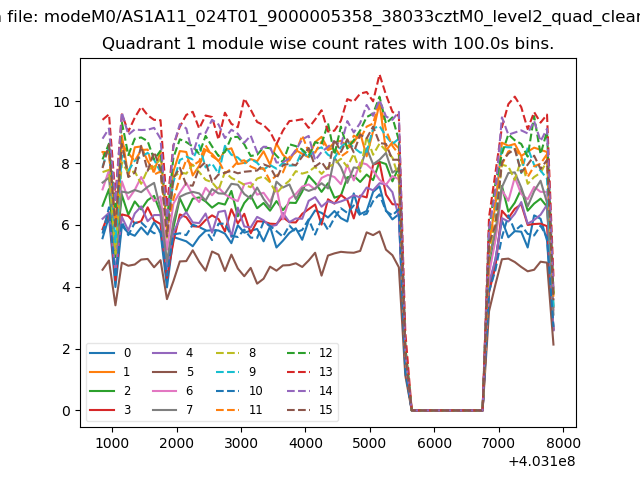
| Module-wise count rates for Quadrant A Data is divided into 100 sec bins |
 |
 |
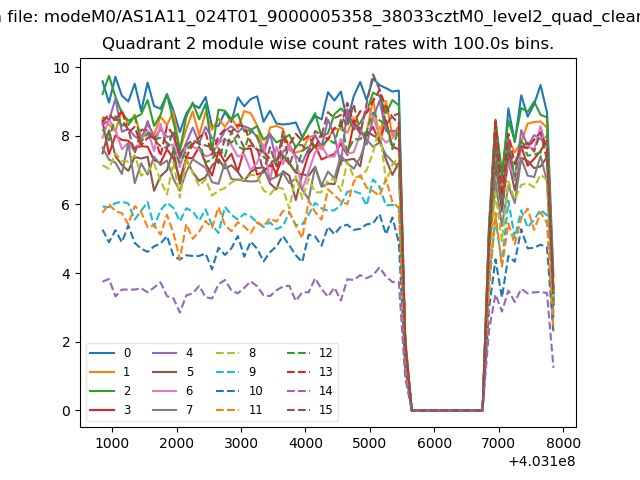
| Module-wise count rates for Quadrant B Data is divided into 100 sec bins |
 |
 |
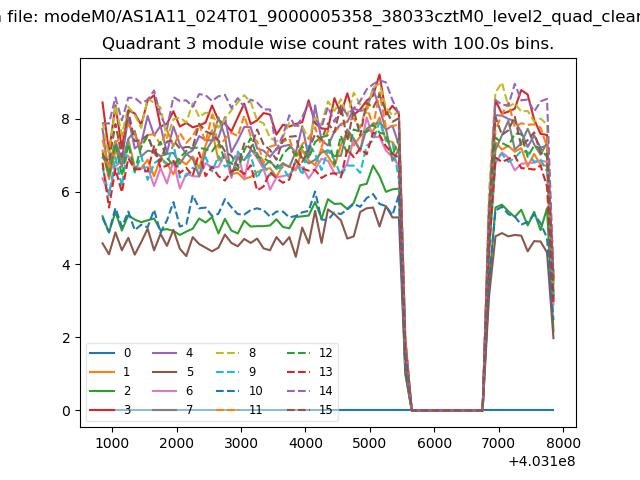
| Module-wise count rates for Quadrant C Data is divided into 100 sec bins |
 |
 |
| Module-wise count rates for Quadrant D Data is divided into 100 sec bins |
 |
 |
| Parameter | Plot |
|---|---|
| CZT HV Monitor | 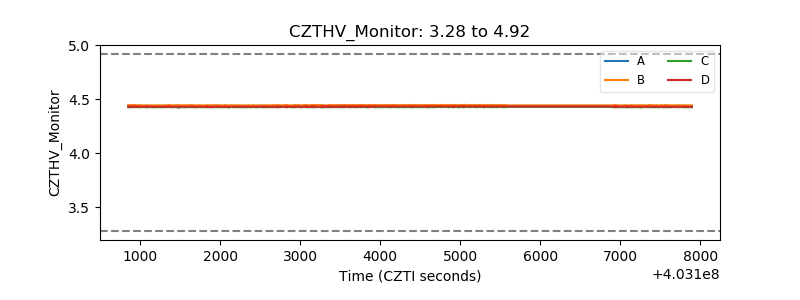 |
| D_VDD | 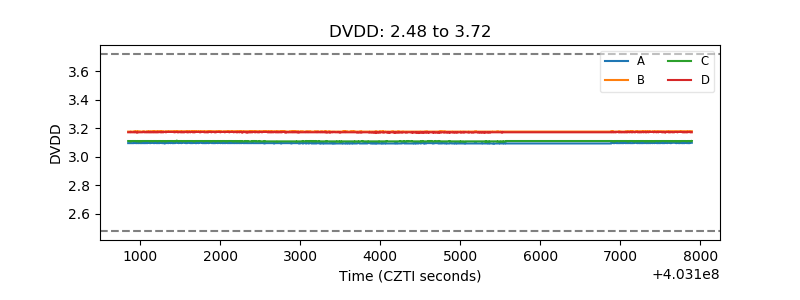 |
| Temperature 1 | 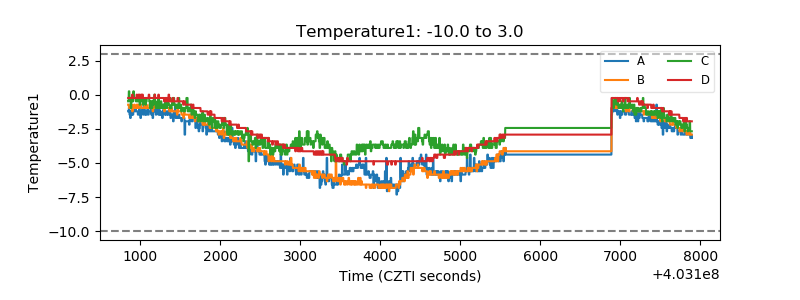 |
| Veto HV Monitor | 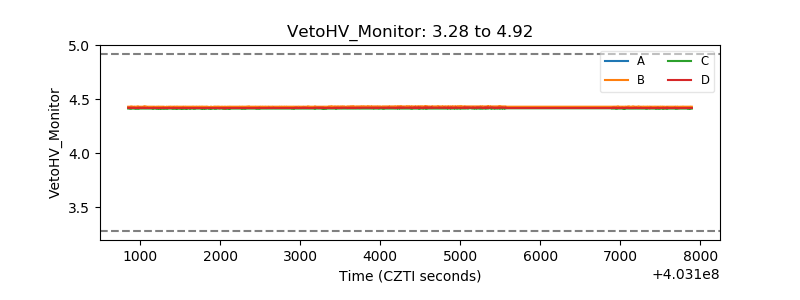 |
| Veto LLD | 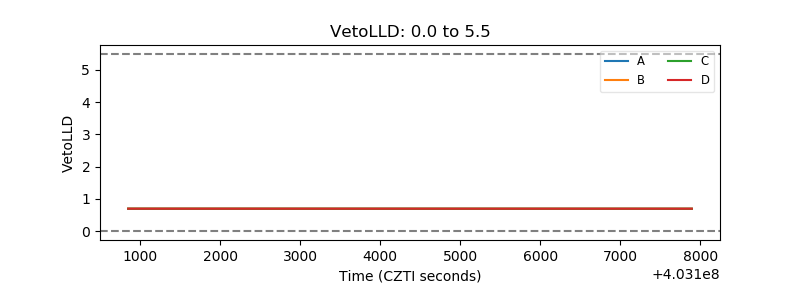 |
| Alpha Counter | 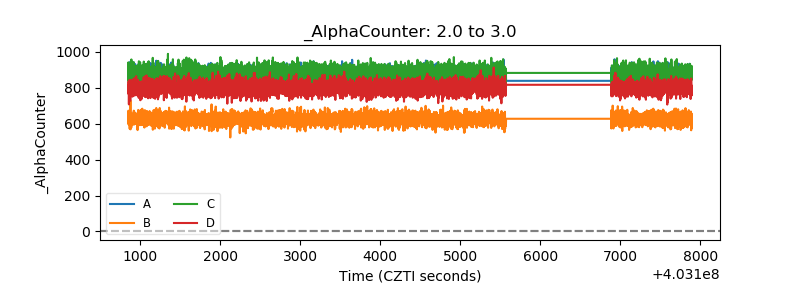 |
| _CPM_Rate | 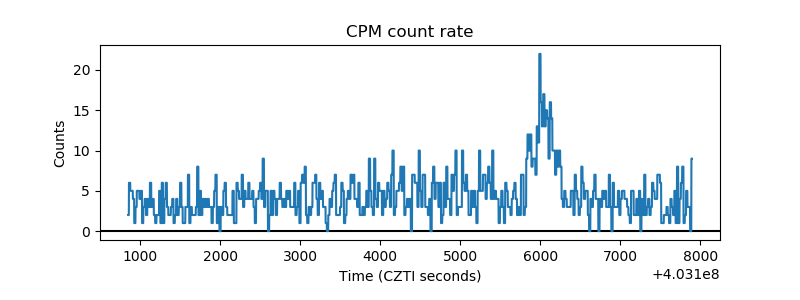 |
| CZT Counter | 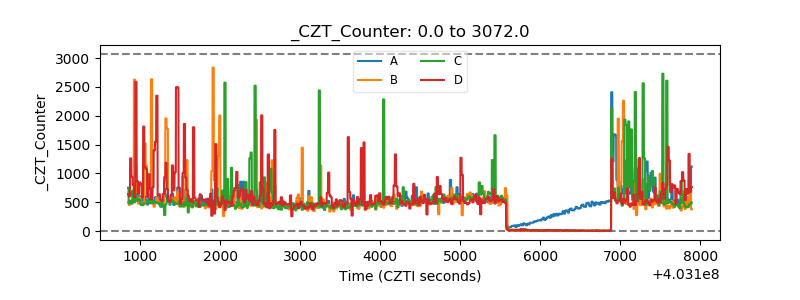 |
| +2.5 Volts monitor | 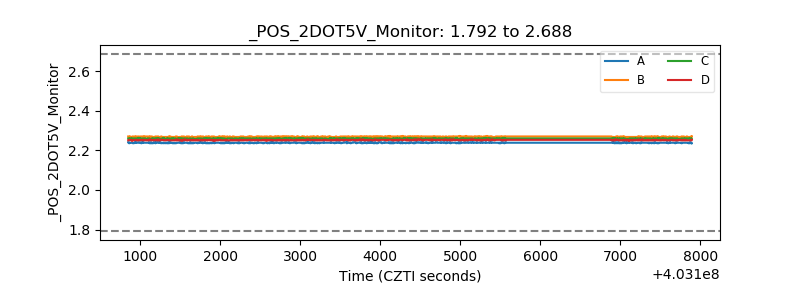 |
| +5 Volts monitor | 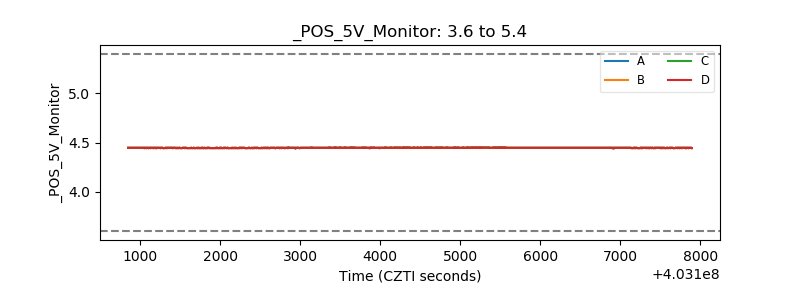 |
| _ROLL_ROT | 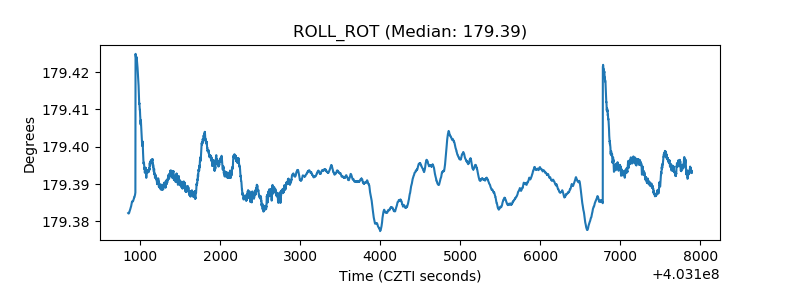 |
| _Roll_DEC | 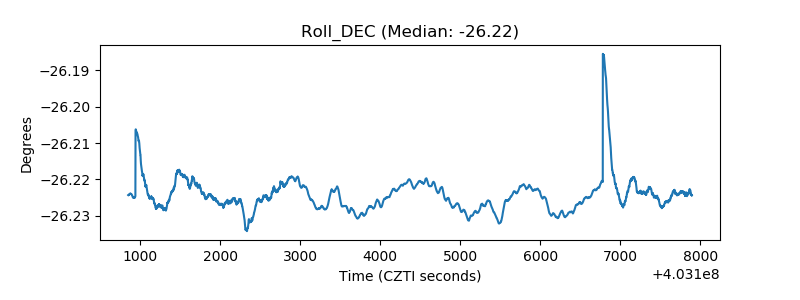 |
| _Roll_RA | 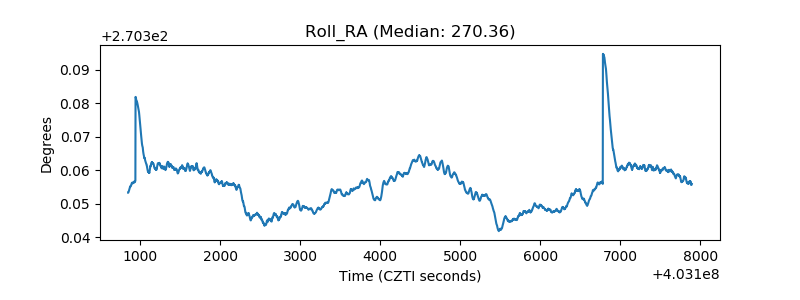 |
| Veto Counter | 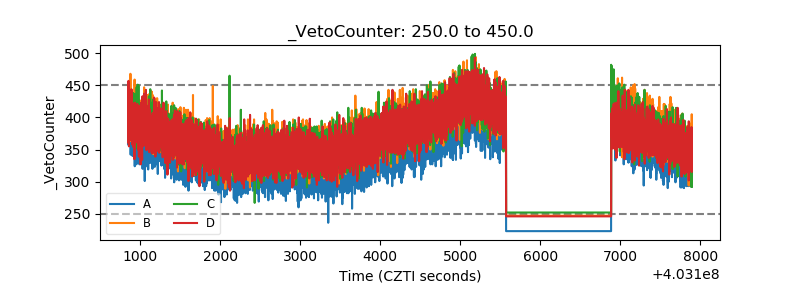 |