| Param | Original file | Final file |
|---|---|---|
| Filename | modeM0/AS1A11_024T01_9000005358_38036cztM0_level2.fits | modeM0/AS1A11_024T01_9000005358_38036cztM0_level2_quad_clean.evt |
| Size (bytes) | 968,999,040 | 257,146,560 |
| Size | 924.1 MB | 245.2 MB |
| Events in quadrant A | 8,362,996 | 1,741,299 |
| Events in quadrant B | 8,863,840 | 1,748,573 |
| Events in quadrant C | 8,145,056 | 1,702,263 |
| Events in quadrant D | 9,315,958 | 1,540,968 |
| Mode M9 | |||
|---|---|---|---|
| Quadrant | BADHDUFLAG | Total packets | Discarded packets |
| A | 0 | 44 | 0 |
| B | 0 | 44 | 0 |
| C | 0 | 44 | 0 |
| D | 0 | 44 | 0 |
| Mode SS | |||
|---|---|---|---|
| Quadrant | BADHDUFLAG | Total packets | Discarded packets |
| A | 0 | 310 | 0 |
| B | 0 | 310 | 0 |
| C | 0 | 310 | 0 |
| D | 0 | 310 | 0 |
| Mode M0 | |||
|---|---|---|---|
| Quadrant | BADHDUFLAG | Total packets | Discarded packets |
| A | 0 | 34392 | 4 |
| B | 0 | 36351 | 3 |
| C | 0 | 33796 | 3 |
| D | 0 | 37596 | 3 |
| Quadrant | Total seconds | Saturated seconds | Saturation percentage |
|---|---|---|---|
| A | 15257 | 44 | 0.288392% |
| B | 15257 | 427 | 2.798715% |
| C | 15257 | 111 | 0.727535% |
| D | 15257 | 320 | 2.097398% |
Noise dominated data is calculated using 1-second bins in cleaned event files. If a bin has >2000 counts, and if more than 50% of those come from <1% of pixels, then it is considered to be noise-dominated and hence unusable.
| Quadrant | # 1 sec bins | Bins with >0 counts | Bins with >2000 counts | High rate bins dominated by noise | Noise dominated (total time) | Noise dominated (detector-on time) | Marked lightcurve |
|---|---|---|---|---|---|---|---|
| A | 19586 | 15260 | 18 | 18 | 0.09% | 0.12% | 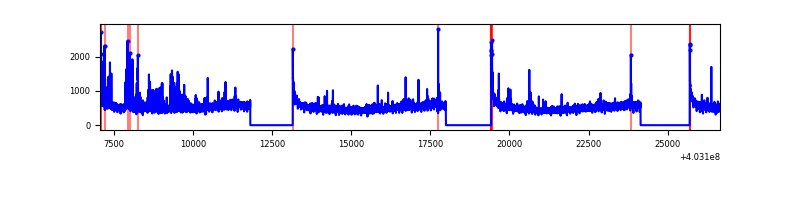 |
| B | 19586 | 15260 | 277 | 277 | 1.41% | 1.82% | 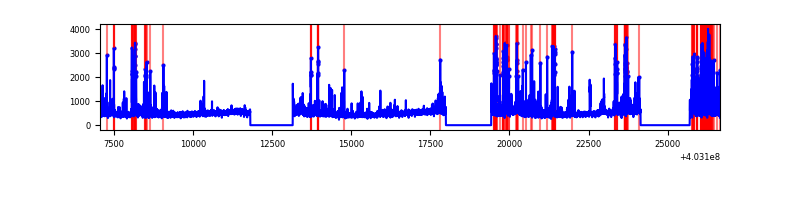 |
| C | 19586 | 15260 | 87 | 87 | 0.44% | 0.57% | 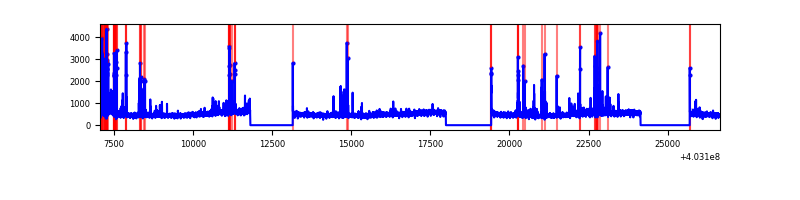 |
| D | 19586 | 15260 | 274 | 274 | 1.40% | 1.80% | 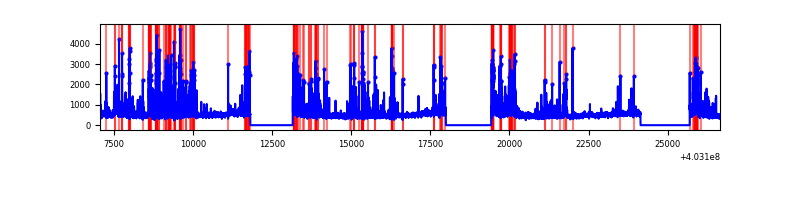 |
Top three noisy pixels from each quadrant. If the there are fewer than three noisy pixels in the level2.evt file, extra rows are filled as -1
| Pixel properties | Quadrant properties | ||||||
|---|---|---|---|---|---|---|---|
| Quadrant | DetID | PixID | Counts | Sigma | Mean | Median | Sigma |
| A | 10 | 83 | 911671 | 2570.25 | 1760 | 1726 | 354.0 |
| A | 12 | 16 | 484993 | 1365.05 | 1760 | 1726 | 354.0 |
| A | 12 | 194 | 82711 | 228.75 | 1760 | 1726 | 354.0 |
| B | 5 | 172 | 578619 | 1731.13 | 1746 | 1698 | 333.3 |
| B | 5 | 184 | 313465 | 935.5 | 1746 | 1698 | 333.3 |
| B | 4 | 171 | 257902 | 768.77 | 1746 | 1698 | 333.3 |
| C | 1 | 23 | 684995 | 1708.33 | 1719 | 1731 | 400.0 |
| C | 15 | 214 | 634737 | 1582.67 | 1719 | 1731 | 400.0 |
| C | 15 | 159 | 35865 | 85.34 | 1719 | 1731 | 400.0 |
| D | 2 | 250 | 1117929 | 2659.06 | 1701 | 1658 | 419.8 |
| D | 7 | 223 | 371301 | 880.52 | 1701 | 1658 | 419.8 |
| D | 10 | 199 | 216689 | 512.22 | 1701 | 1658 | 419.8 |
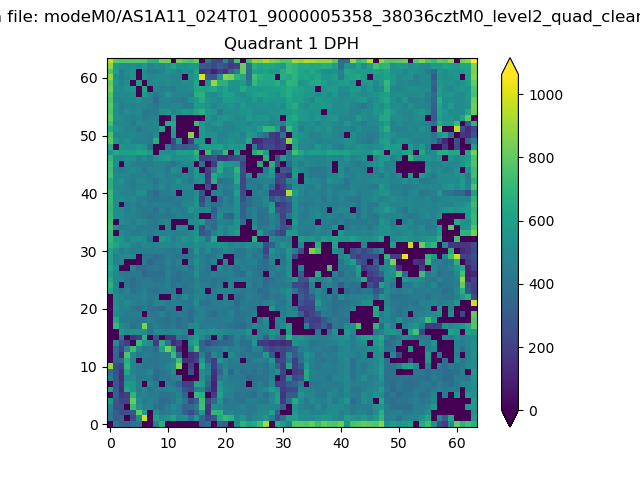
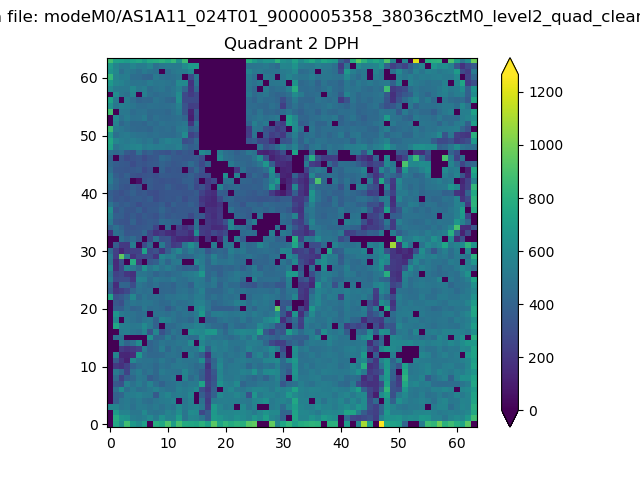
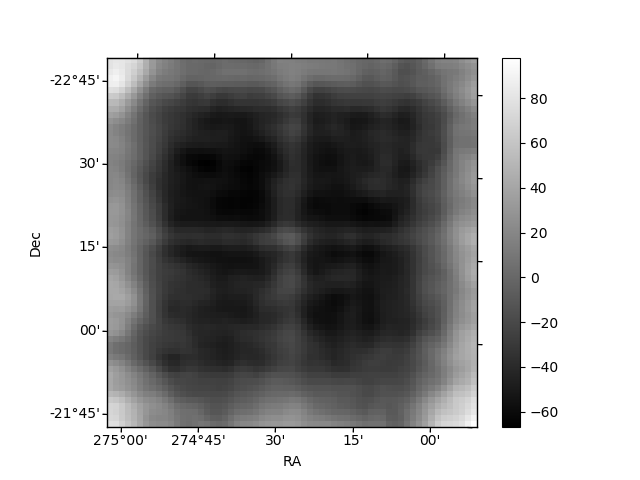
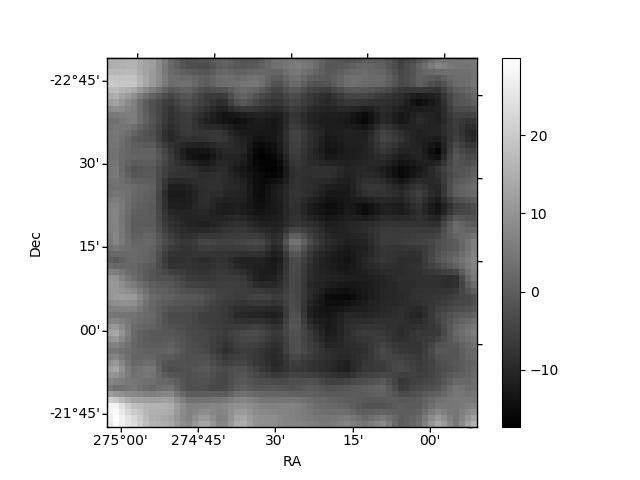
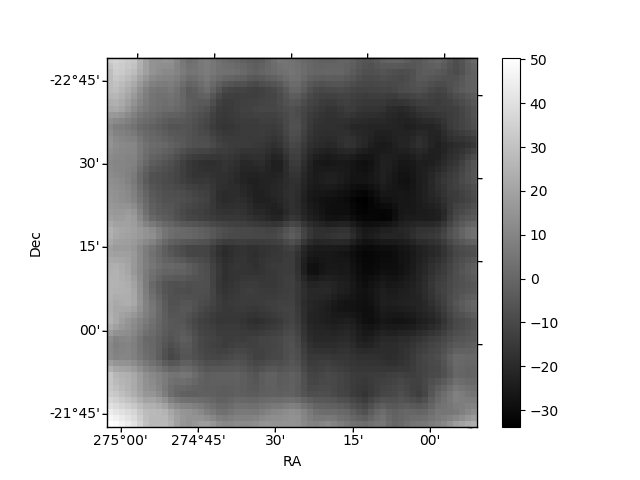
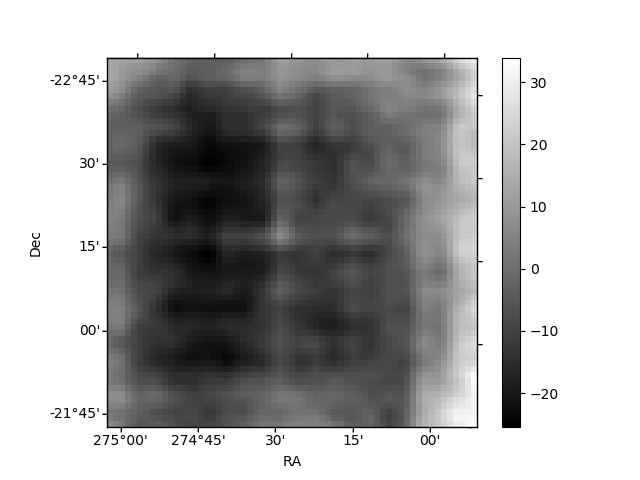
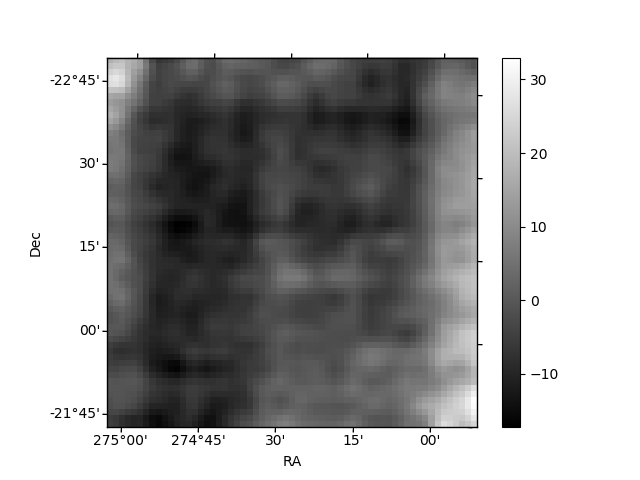
Histogram calculated using DETX and DETY for each event in the final _common_clean file
| Quadrant A |  |
 |
Quadrant B |
|---|---|---|---|
| Quadrant D | 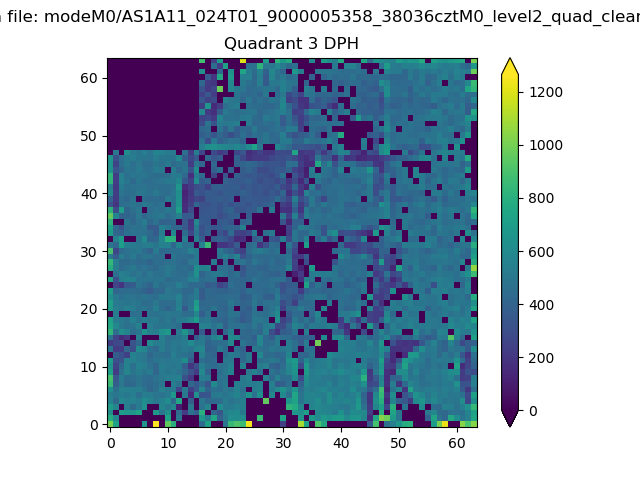 |
 |
Quadrant C |
| Plot type | Count rate plots | Images |
|---|---|---|
| Comparison with Poisson distribution Blue bars denote a histogram of data divided into 1 sec bins. Red curve is a Poisson curve with rate = median count rate of data. |
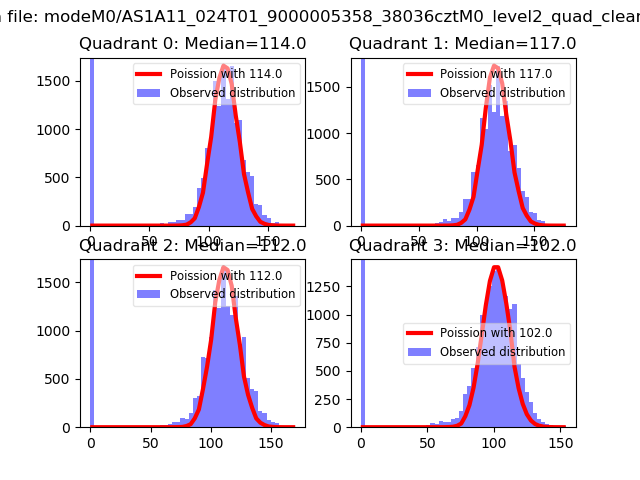 |
 |
| Quadrant-wise count rates Data is divided into 100 sec bins |
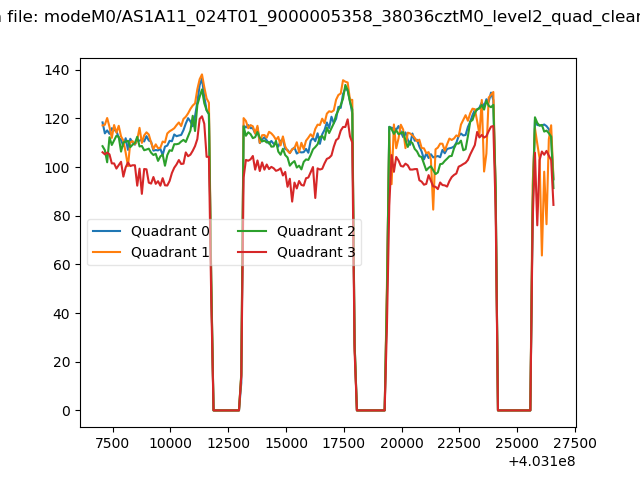 |
|
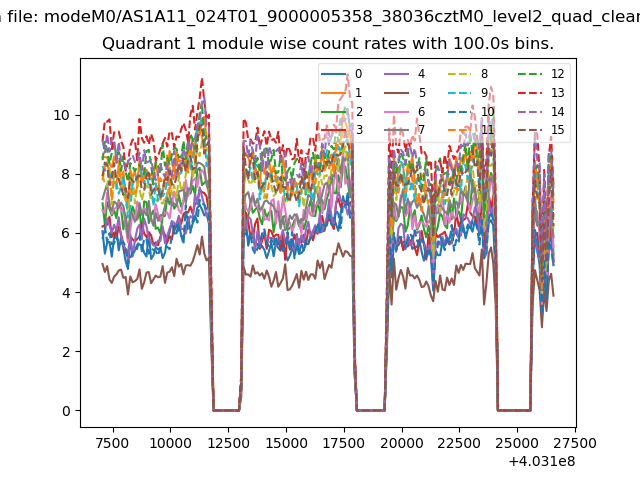
| Module-wise count rates for Quadrant A Data is divided into 100 sec bins |
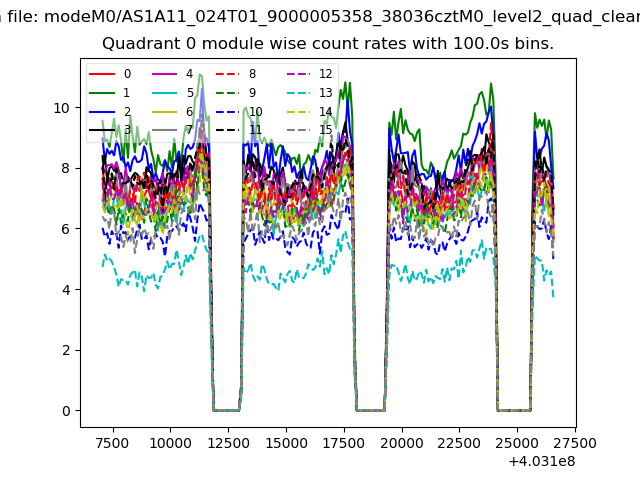 |
 |
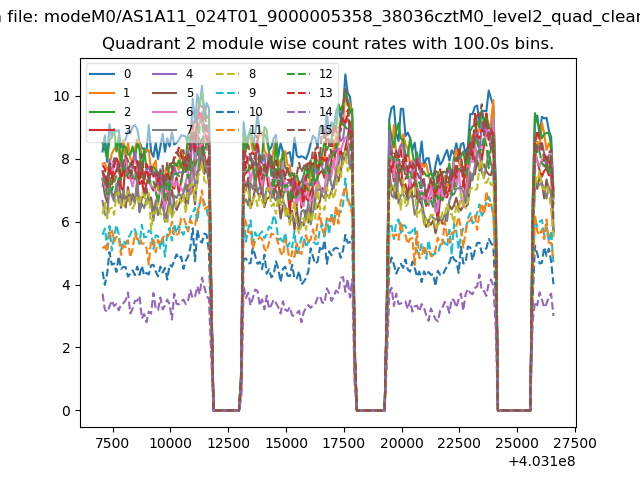
| Module-wise count rates for Quadrant B Data is divided into 100 sec bins |
 |
 |
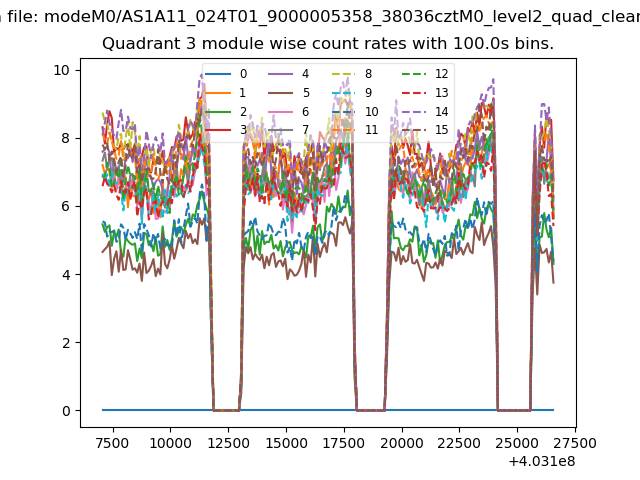
| Module-wise count rates for Quadrant C Data is divided into 100 sec bins |
 |
 |
| Module-wise count rates for Quadrant D Data is divided into 100 sec bins |
 |
 |
| Parameter | Plot |
|---|---|
| CZT HV Monitor | 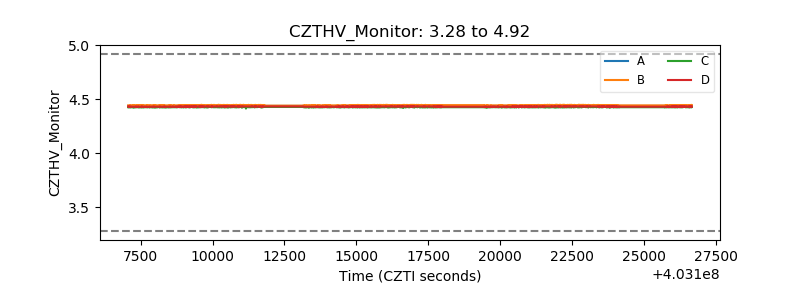 |
| D_VDD | 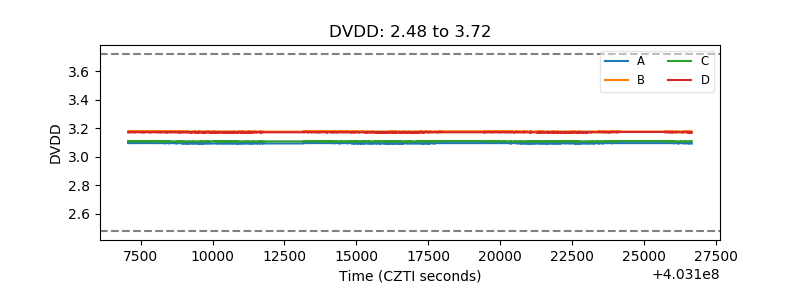 |
| Temperature 1 | 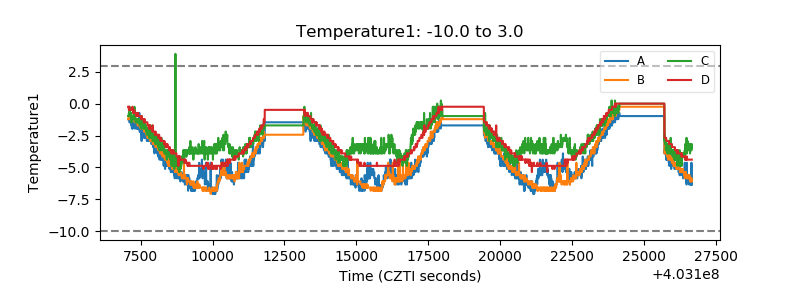 |
| Veto HV Monitor | 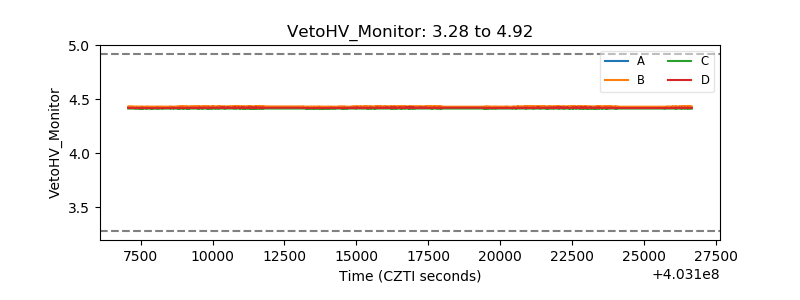 |
| Veto LLD | 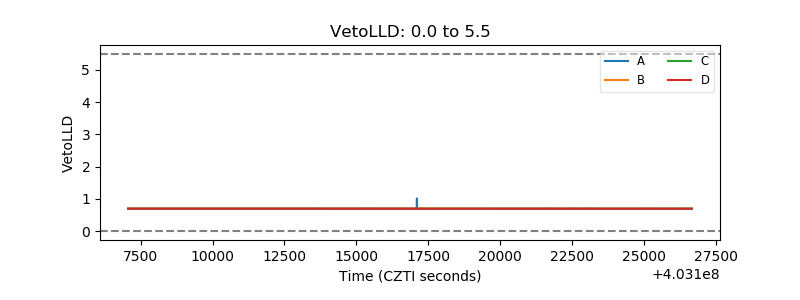 |
| Alpha Counter | 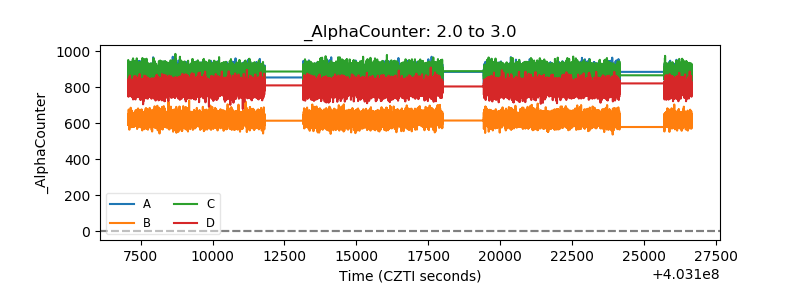 |
| _CPM_Rate | 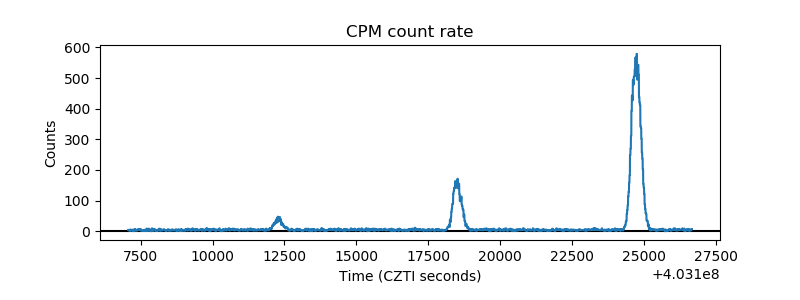 |
| CZT Counter | 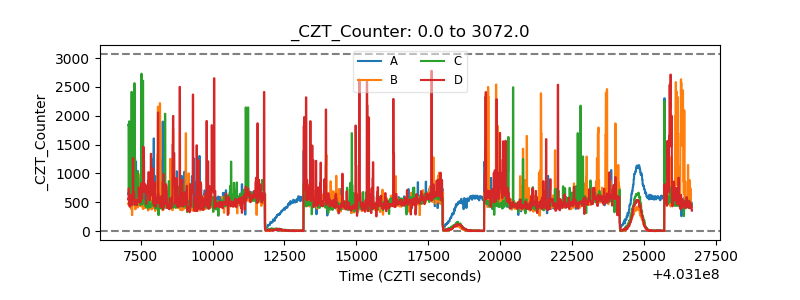 |
| +2.5 Volts monitor | 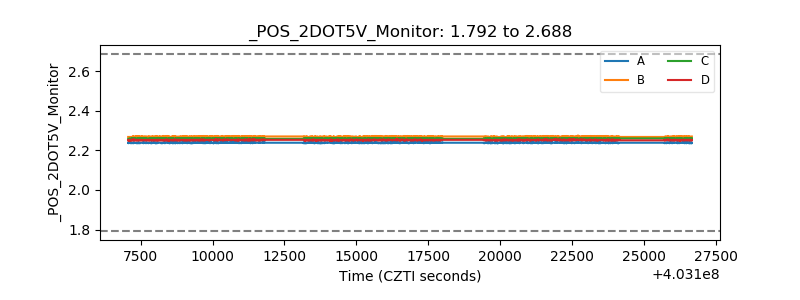 |
| +5 Volts monitor | 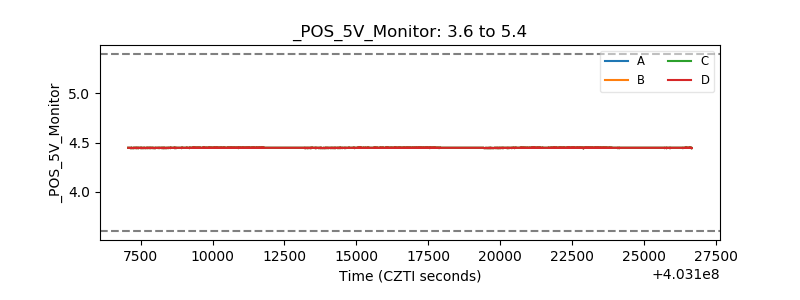 |
| _ROLL_ROT | 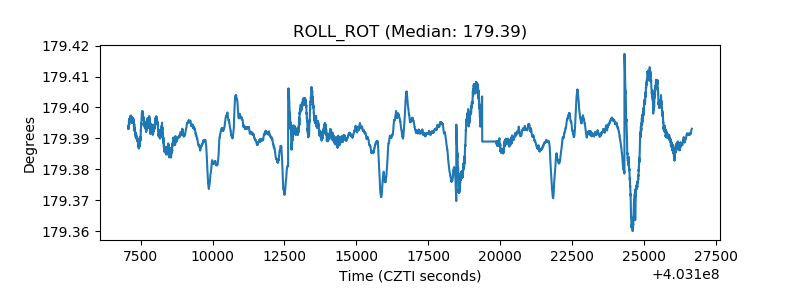 |
| _Roll_DEC | 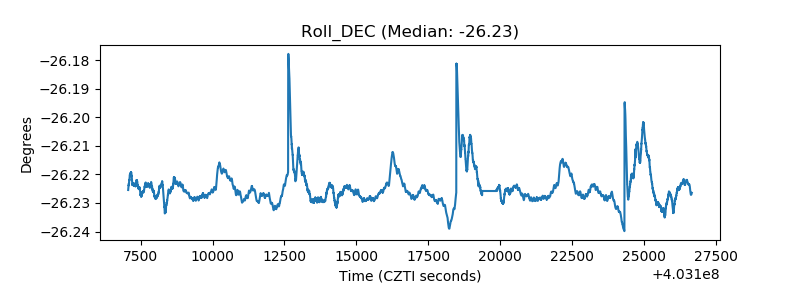 |
| _Roll_RA | 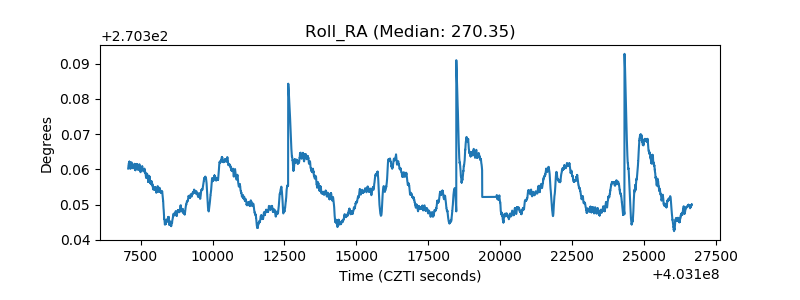 |
| Veto Counter | 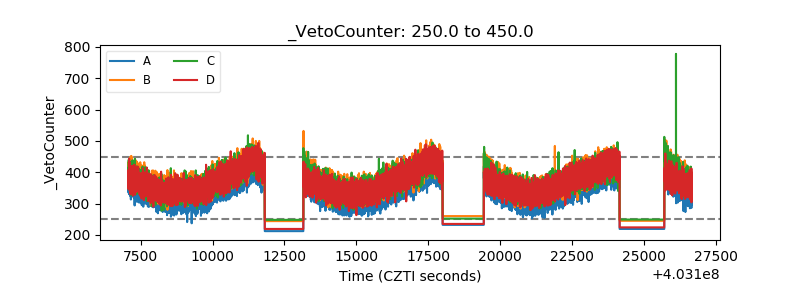 |