| Param | Original file | Final file |
|---|---|---|
| Filename | modeM0/AS1A11_024T01_9000005358_38037cztM0_level2.fits | modeM0/AS1A11_024T01_9000005358_38037cztM0_level2_quad_clean.evt |
| Size (bytes) | 347,616,000 | 94,127,040 |
| Size | 331.5 MB | 89.8 MB |
| Events in quadrant A | 2,895,073 | 641,416 |
| Events in quadrant B | 3,404,388 | 635,637 |
| Events in quadrant C | 2,875,821 | 626,733 |
| Events in quadrant D | 3,266,311 | 563,751 |
| Mode M9 | |||
|---|---|---|---|
| Quadrant | BADHDUFLAG | Total packets | Discarded packets |
| A | 0 | 29 | 0 |
| B | 0 | 29 | 0 |
| C | 0 | 29 | 0 |
| D | 0 | 30 | 0 |
| Mode SS | |||
|---|---|---|---|
| Quadrant | BADHDUFLAG | Total packets | Discarded packets |
| A | 0 | 110 | 0 |
| B | 0 | 110 | 0 |
| C | 0 | 110 | 0 |
| D | 0 | 110 | 0 |
| Mode M0 | |||
|---|---|---|---|
| Quadrant | BADHDUFLAG | Total packets | Discarded packets |
| A | 0 | 11902 | 3 |
| B | 0 | 13581 | 2 |
| C | 0 | 11812 | 2 |
| D | 0 | 13295 | 2 |
| Quadrant | Total seconds | Saturated seconds | Saturation percentage |
|---|---|---|---|
| A | 5470 | 13 | 0.237660% |
| B | 5470 | 266 | 4.862888% |
| C | 5470 | 27 | 0.493601% |
| D | 5470 | 162 | 2.961609% |
Noise dominated data is calculated using 1-second bins in cleaned event files. If a bin has >2000 counts, and if more than 50% of those come from <1% of pixels, then it is considered to be noise-dominated and hence unusable.
| Quadrant | # 1 sec bins | Bins with >0 counts | Bins with >2000 counts | High rate bins dominated by noise | Noise dominated (total time) | Noise dominated (detector-on time) | Marked lightcurve |
|---|---|---|---|---|---|---|---|
| A | 7113 | 5471 | 7 | 7 | 0.10% | 0.13% | 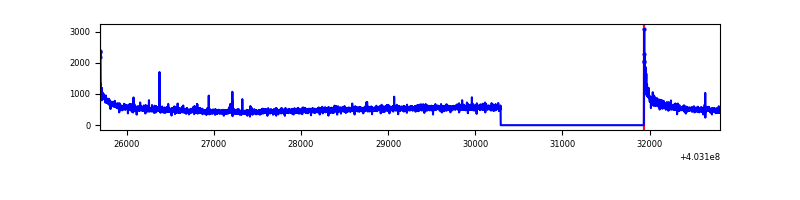 |
| B | 7113 | 5471 | 171 | 171 | 2.40% | 3.13% | 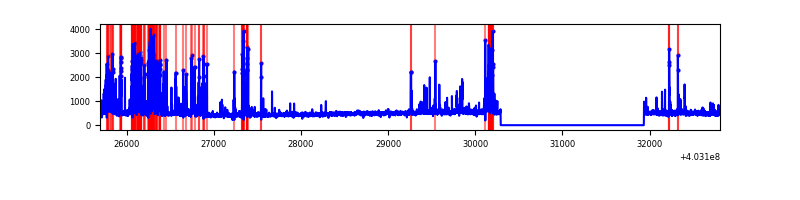 |
| C | 7113 | 5471 | 19 | 19 | 0.27% | 0.35% | 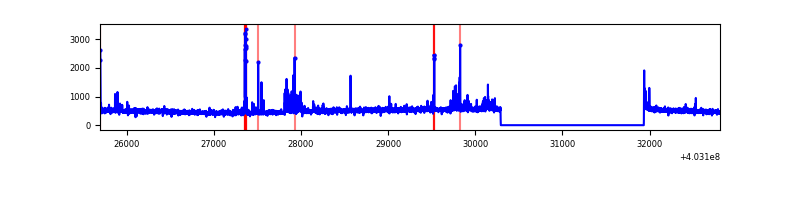 |
| D | 7113 | 5471 | 147 | 147 | 2.07% | 2.69% | 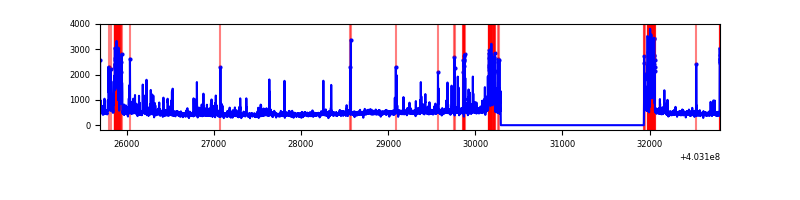 |
Top three noisy pixels from each quadrant. If the there are fewer than three noisy pixels in the level2.evt file, extra rows are filled as -1
| Pixel properties | Quadrant properties | ||||||
|---|---|---|---|---|---|---|---|
| Quadrant | DetID | PixID | Counts | Sigma | Mean | Median | Sigma |
| A | 10 | 83 | 375131 | 2917.35 | 634 | 621 | 128.4 |
| A | 12 | 16 | 26637 | 202.66 | 634 | 621 | 128.4 |
| A | 12 | 189 | 12490 | 92.46 | 634 | 621 | 128.4 |
| B | 5 | 172 | 269443 | 2249.28 | 622 | 607 | 119.5 |
| B | 4 | 171 | 224463 | 1872.95 | 622 | 607 | 119.5 |
| B | 5 | 255 | 194040 | 1618.41 | 622 | 607 | 119.5 |
| C | 15 | 214 | 233153 | 1593.28 | 620 | 626 | 145.9 |
| C | 1 | 23 | 180455 | 1232.19 | 620 | 626 | 145.9 |
| C | 0 | 10 | 18224 | 120.58 | 620 | 626 | 145.9 |
| D | 2 | 250 | 329878 | 2196.13 | 609 | 592 | 149.9 |
| D | 12 | 227 | 183092 | 1217.16 | 609 | 592 | 149.9 |
| D | 7 | 223 | 114874 | 762.19 | 609 | 592 | 149.9 |
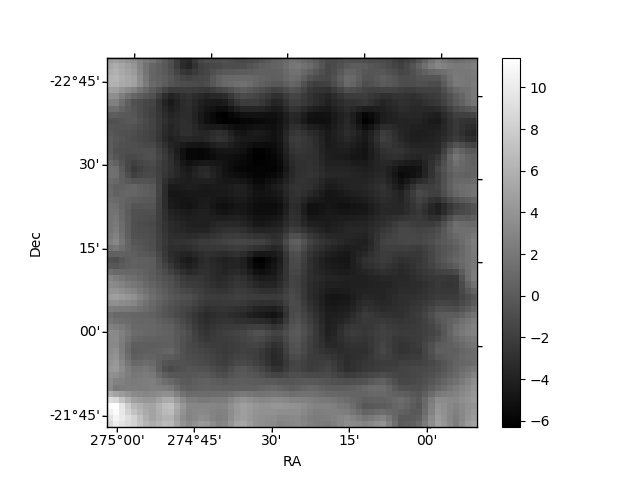
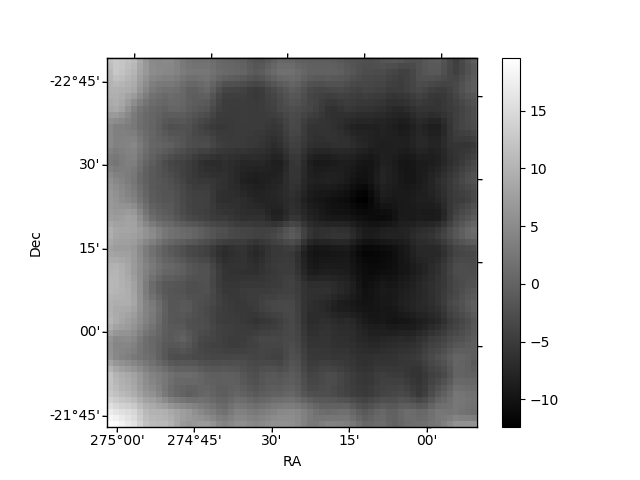
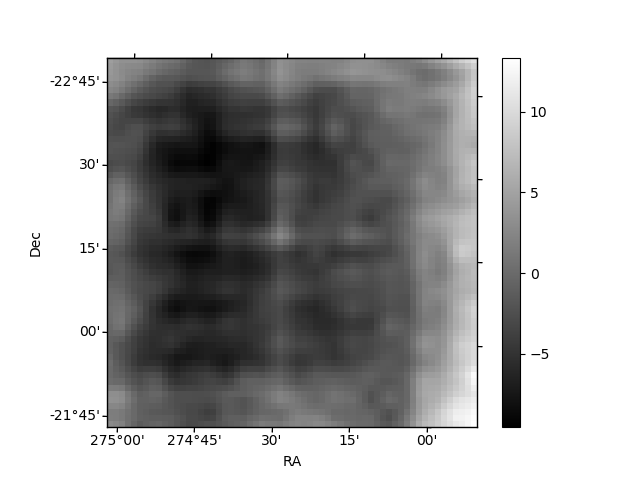
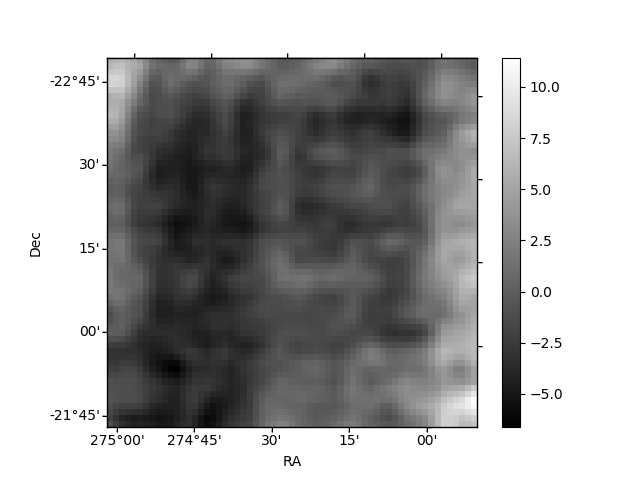
Histogram calculated using DETX and DETY for each event in the final _common_clean file
| Quadrant A | 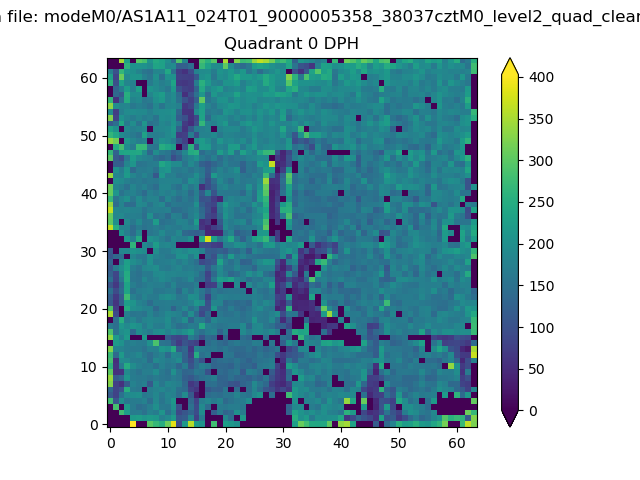 |
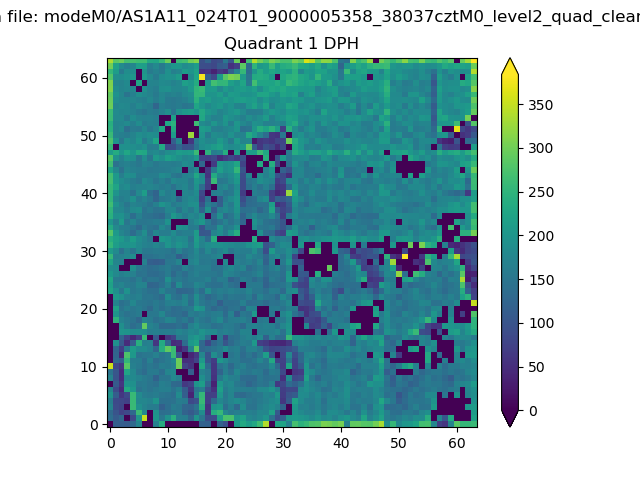 |
Quadrant B |
|---|---|---|---|
| Quadrant D | 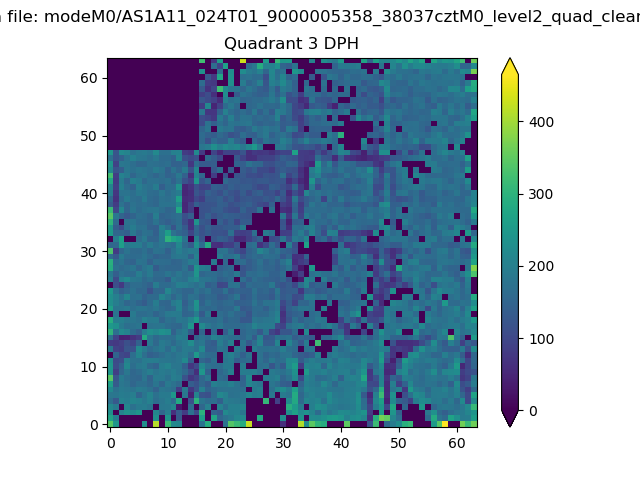 |
 |
Quadrant C |
| Plot type | Count rate plots | Images |
|---|---|---|
| Comparison with Poisson distribution Blue bars denote a histogram of data divided into 1 sec bins. Red curve is a Poisson curve with rate = median count rate of data. |
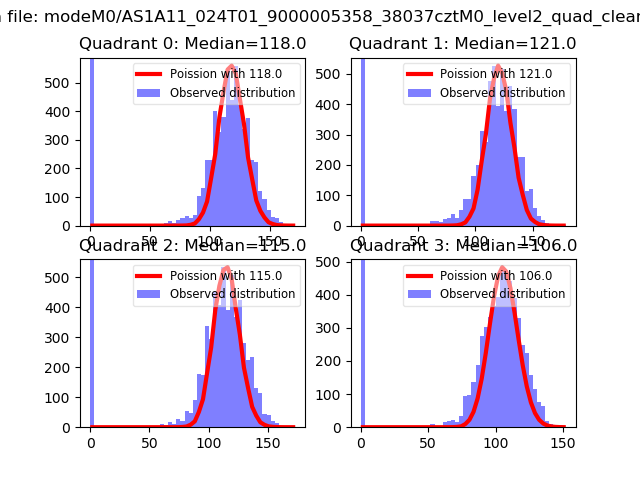 |
 |
| Quadrant-wise count rates Data is divided into 100 sec bins |
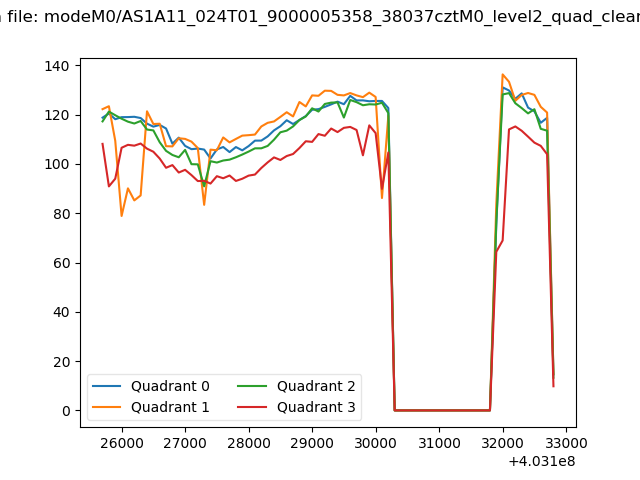 |
|
| Module-wise count rates for Quadrant A Data is divided into 100 sec bins |
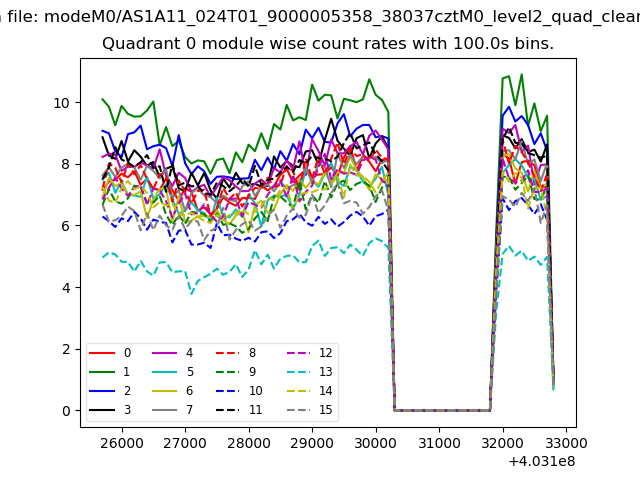 |
 |
| Module-wise count rates for Quadrant B Data is divided into 100 sec bins |
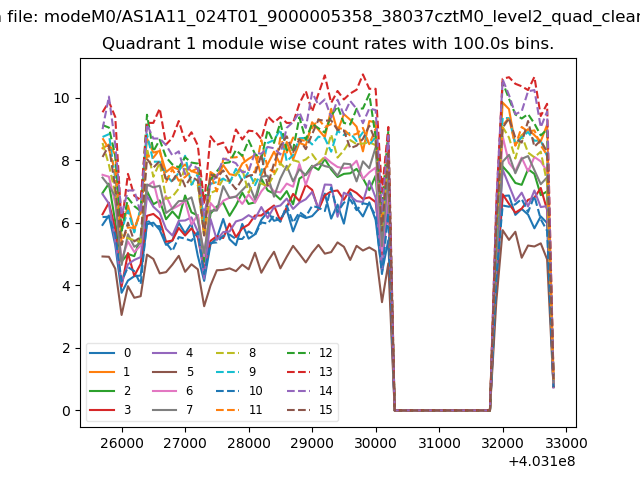 |
 |
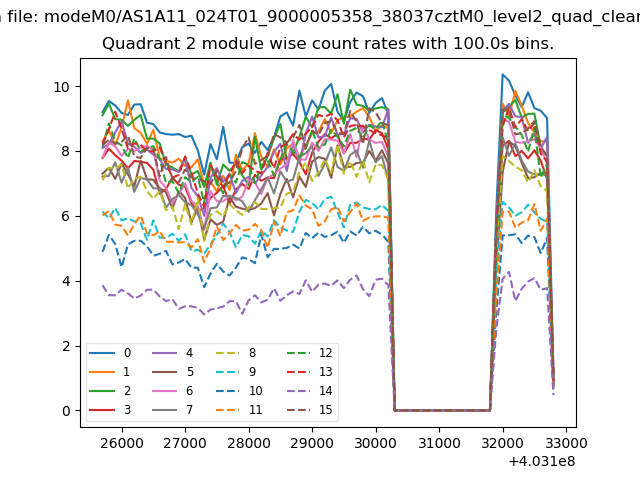
| Module-wise count rates for Quadrant C Data is divided into 100 sec bins |
 |
 |
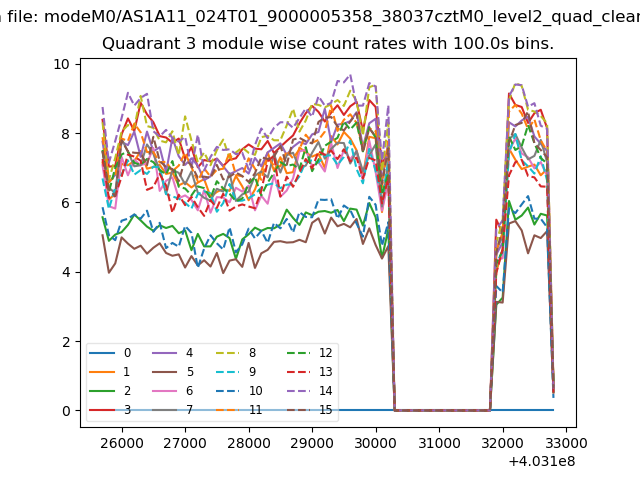
| Module-wise count rates for Quadrant D Data is divided into 100 sec bins |
 |
 |
| Parameter | Plot |
|---|---|
| CZT HV Monitor | 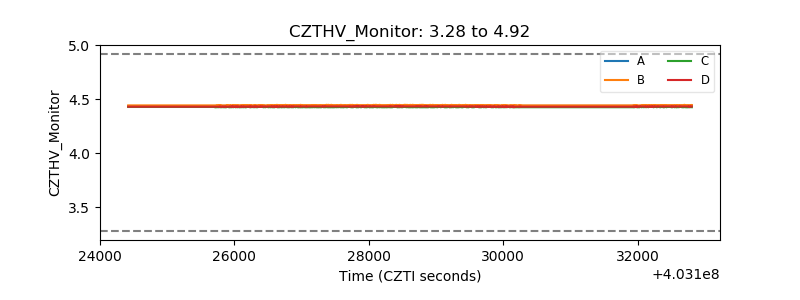 |
| D_VDD | 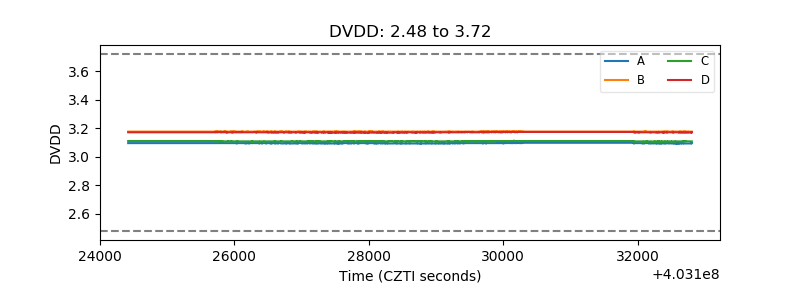 |
| Temperature 1 | 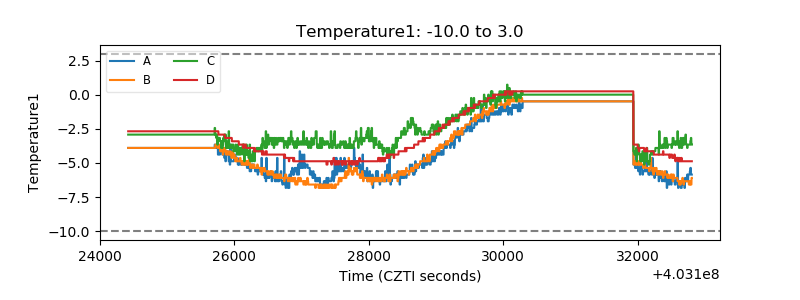 |
| Veto HV Monitor | 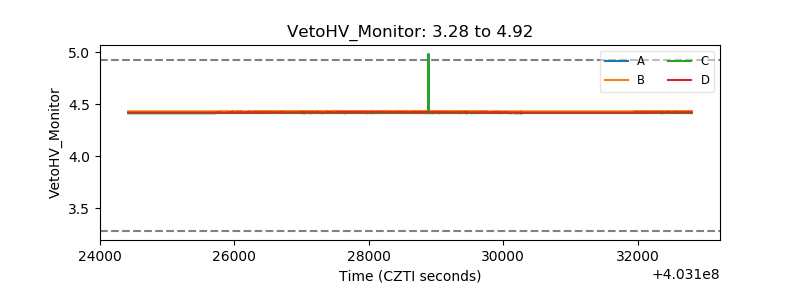 |
| Veto LLD | 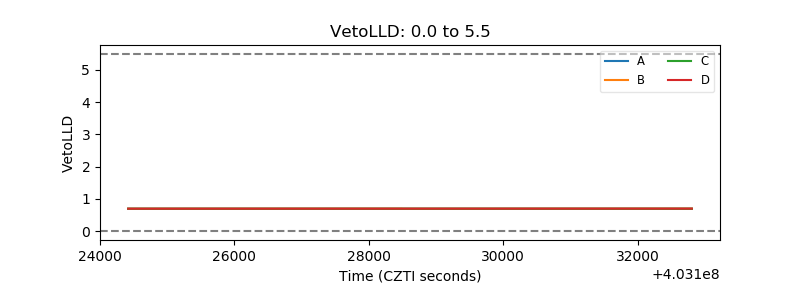 |
| Alpha Counter | 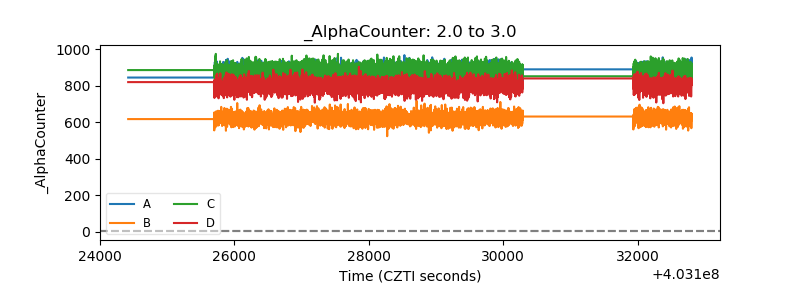 |
| _CPM_Rate |  |
| CZT Counter |  |
| +2.5 Volts monitor | 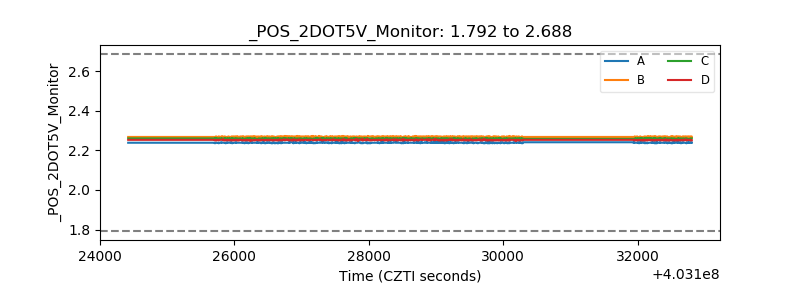 |
| +5 Volts monitor | 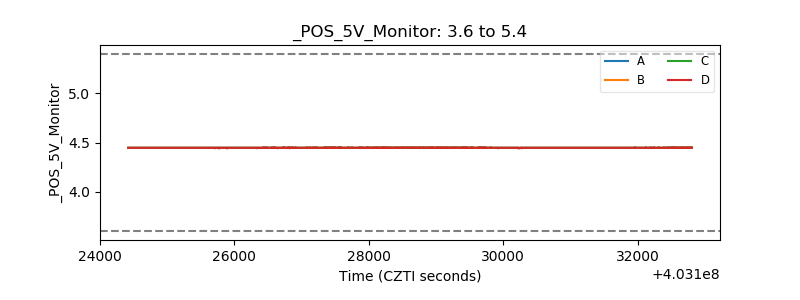 |
| _ROLL_ROT | 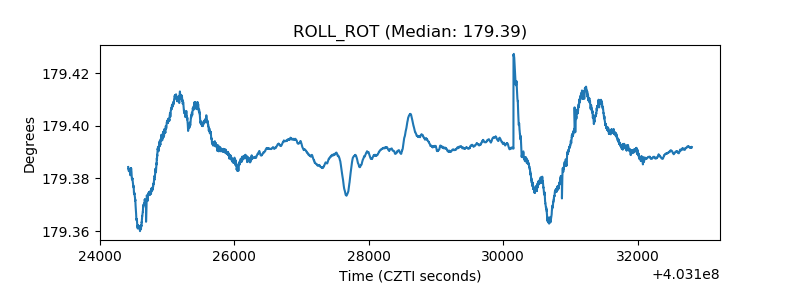 |
| _Roll_DEC | 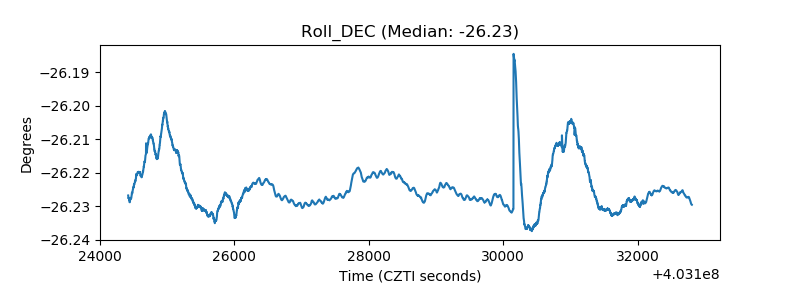 |
| _Roll_RA | 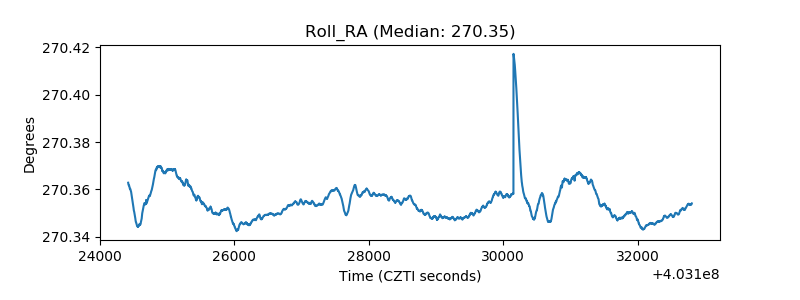 |
| Veto Counter | 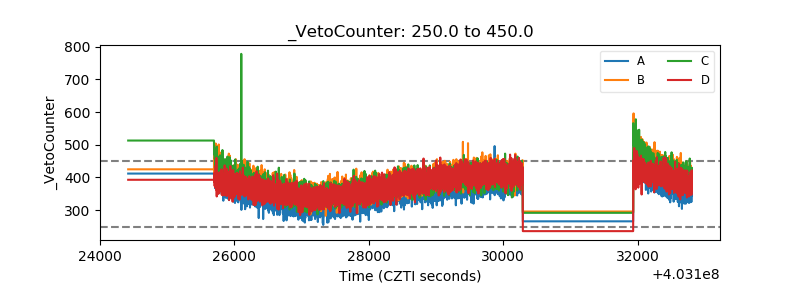 |