| Param | Original file | Final file |
|---|---|---|
| Filename | modeM0/AS1A11_024T01_9000005358_38040cztM0_level2.fits | modeM0/AS1A11_024T01_9000005358_38040cztM0_level2_quad_clean.evt |
| Size (bytes) | 335,813,760 | 100,906,560 |
| Size | 320.3 MB | 96.2 MB |
| Events in quadrant A | 2,981,875 | 688,544 |
| Events in quadrant B | 3,041,251 | 711,389 |
| Events in quadrant C | 2,900,129 | 673,710 |
| Events in quadrant D | 3,091,387 | 607,605 |
| Mode M9 | |||
|---|---|---|---|
| Quadrant | BADHDUFLAG | Total packets | Discarded packets |
| A | 0 | 21 | 0 |
| B | 0 | 21 | 0 |
| C | 0 | 21 | 0 |
| D | 0 | 22 | 0 |
| Mode SS | |||
|---|---|---|---|
| Quadrant | BADHDUFLAG | Total packets | Discarded packets |
| A | 0 | 110 | 0 |
| B | 0 | 110 | 0 |
| C | 0 | 110 | 0 |
| D | 0 | 110 | 0 |
| Mode M0 | |||
|---|---|---|---|
| Quadrant | BADHDUFLAG | Total packets | Discarded packets |
| A | 0 | 11918 | 3 |
| B | 0 | 12204 | 2 |
| C | 0 | 11475 | 2 |
| D | 0 | 12504 | 2 |
| Quadrant | Total seconds | Saturated seconds | Saturation percentage |
|---|---|---|---|
| A | 5344 | 26 | 0.486527% |
| B | 5344 | 86 | 1.609281% |
| C | 5344 | 19 | 0.355539% |
| D | 5344 | 82 | 1.534431% |
Noise dominated data is calculated using 1-second bins in cleaned event files. If a bin has >2000 counts, and if more than 50% of those come from <1% of pixels, then it is considered to be noise-dominated and hence unusable.
| Quadrant | # 1 sec bins | Bins with >0 counts | Bins with >2000 counts | High rate bins dominated by noise | Noise dominated (total time) | Noise dominated (detector-on time) | Marked lightcurve |
|---|---|---|---|---|---|---|---|
| A | 7257 | 5345 | 12 | 12 | 0.17% | 0.22% | 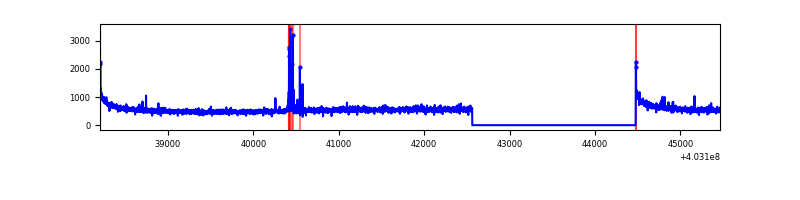 |
| B | 7257 | 5345 | 55 | 55 | 0.76% | 1.03% | 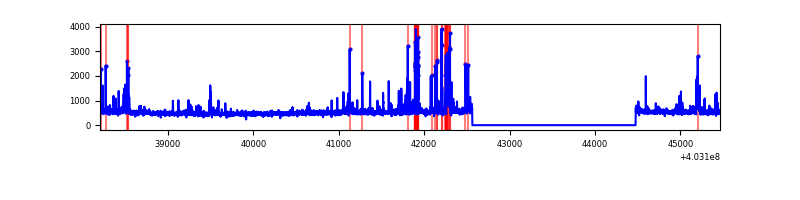 |
| C | 7257 | 5345 | 12 | 12 | 0.17% | 0.22% | 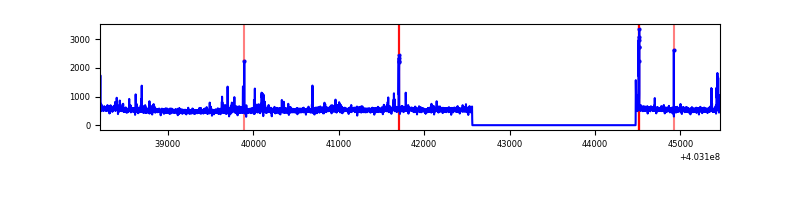 |
| D | 7257 | 5344 | 68 | 68 | 0.94% | 1.27% | 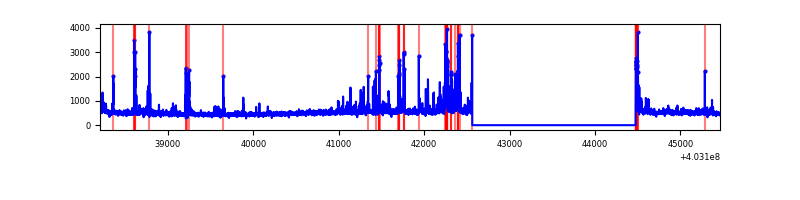 |
Top three noisy pixels from each quadrant. If the there are fewer than three noisy pixels in the level2.evt file, extra rows are filled as -1
| Pixel properties | Quadrant properties | ||||||
|---|---|---|---|---|---|---|---|
| Quadrant | DetID | PixID | Counts | Sigma | Mean | Median | Sigma |
| A | 10 | 83 | 357164 | 2662.29 | 658 | 646 | 133.9 |
| A | 13 | 248 | 41175 | 302.65 | 658 | 646 | 133.9 |
| A | 13 | 6 | 12774 | 90.56 | 658 | 646 | 133.9 |
| B | 4 | 171 | 159948 | 1272.06 | 658 | 643 | 125.2 |
| B | 5 | 172 | 147453 | 1172.29 | 658 | 643 | 125.2 |
| B | 5 | 255 | 51406 | 405.35 | 658 | 643 | 125.2 |
| C | 15 | 214 | 228989 | 1544.91 | 643 | 649 | 147.8 |
| C | 1 | 23 | 109657 | 737.53 | 643 | 649 | 147.8 |
| C | 3 | 233 | 32614 | 216.27 | 643 | 649 | 147.8 |
| D | 12 | 227 | 151005 | 987.72 | 634 | 620 | 152.3 |
| D | 7 | 223 | 124139 | 811.27 | 634 | 620 | 152.3 |
| D | 13 | 249 | 101978 | 665.71 | 634 | 620 | 152.3 |
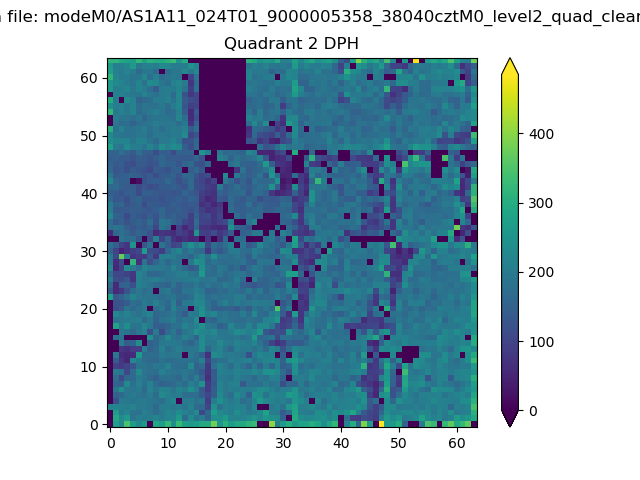
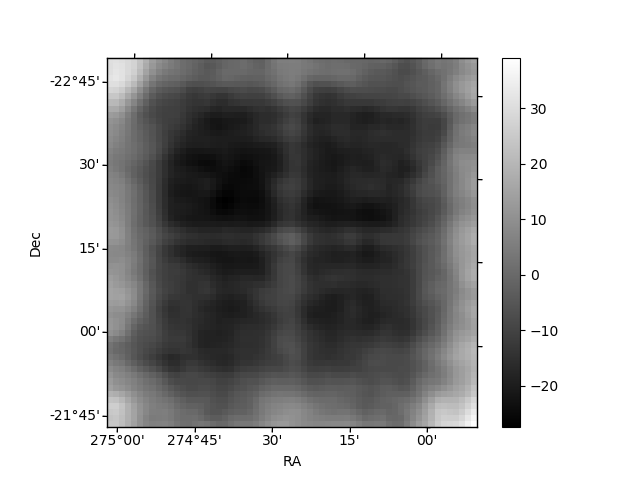
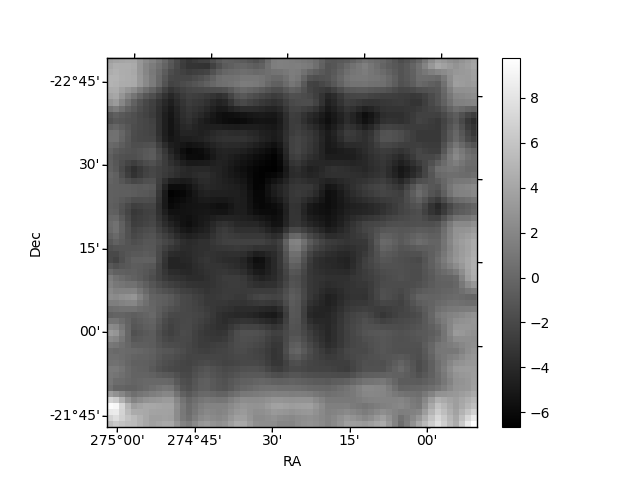
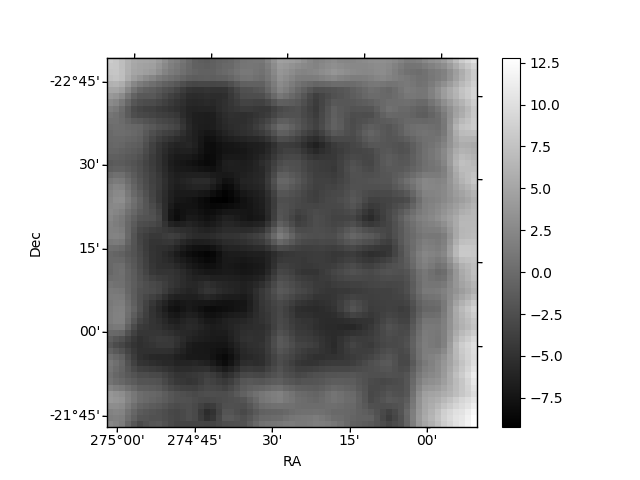
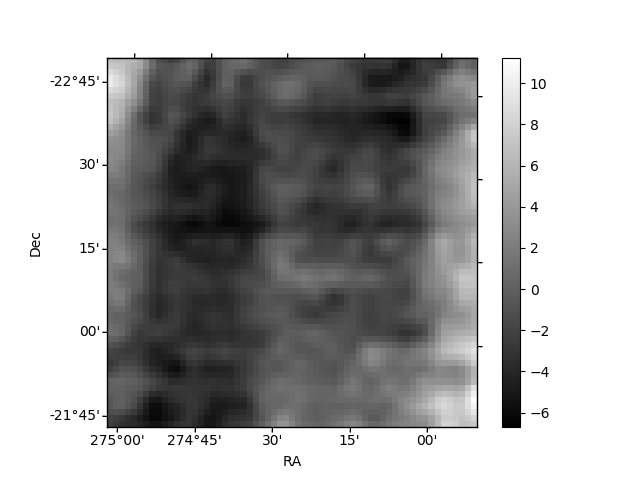
Histogram calculated using DETX and DETY for each event in the final _common_clean file
| Quadrant A | 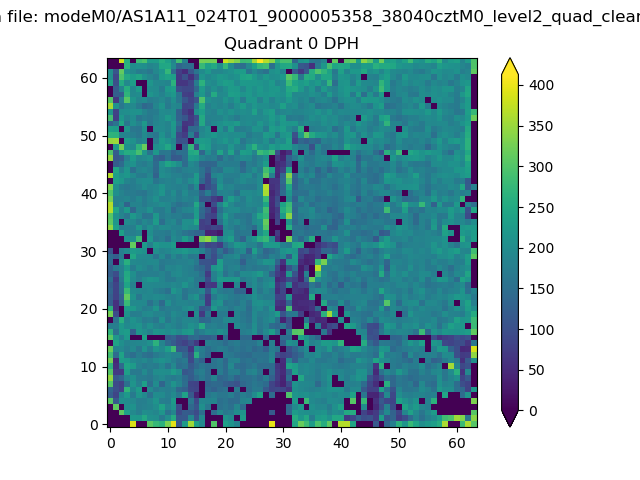 |
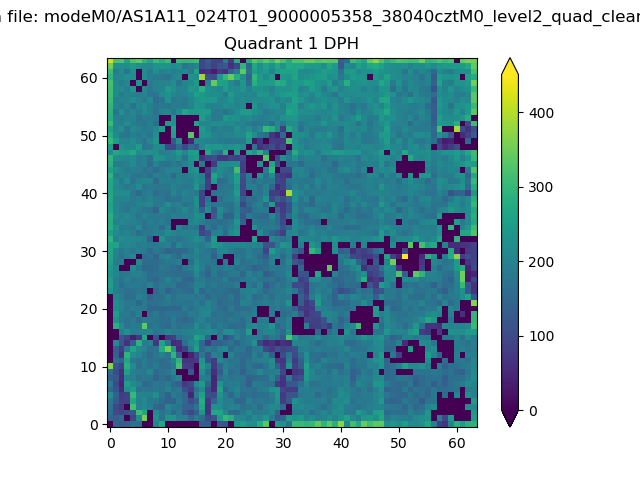 |
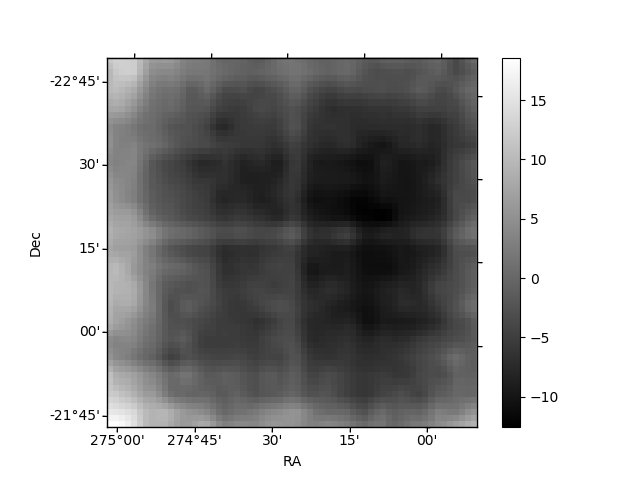
Quadrant B |
|---|---|---|---|
| Quadrant D | 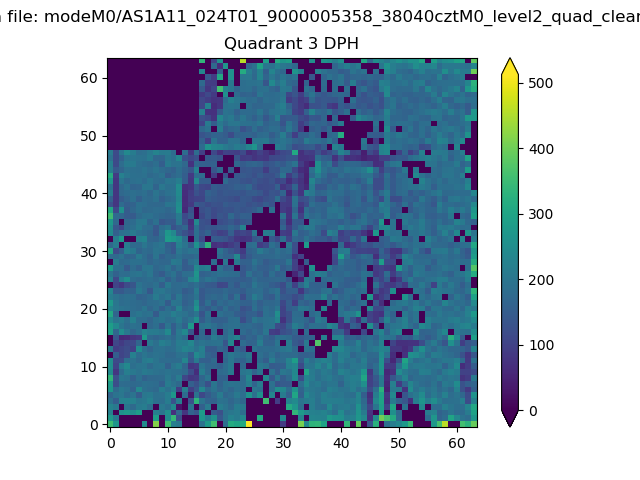 |
 |
Quadrant C |
| Plot type | Count rate plots | Images |
|---|---|---|
| Comparison with Poisson distribution Blue bars denote a histogram of data divided into 1 sec bins. Red curve is a Poisson curve with rate = median count rate of data. |
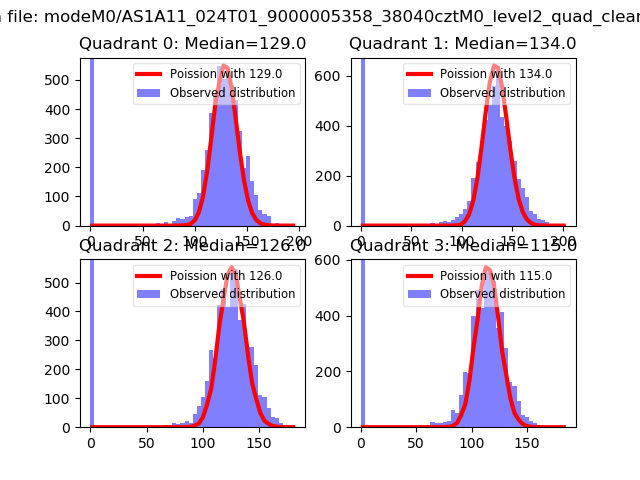 |
 |
| Quadrant-wise count rates Data is divided into 100 sec bins |
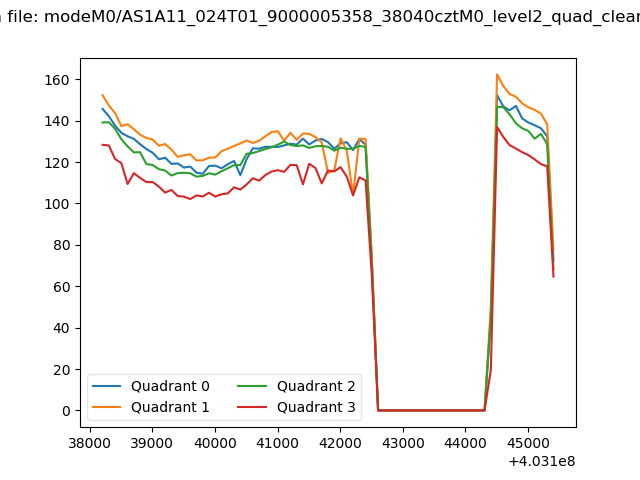 |
|
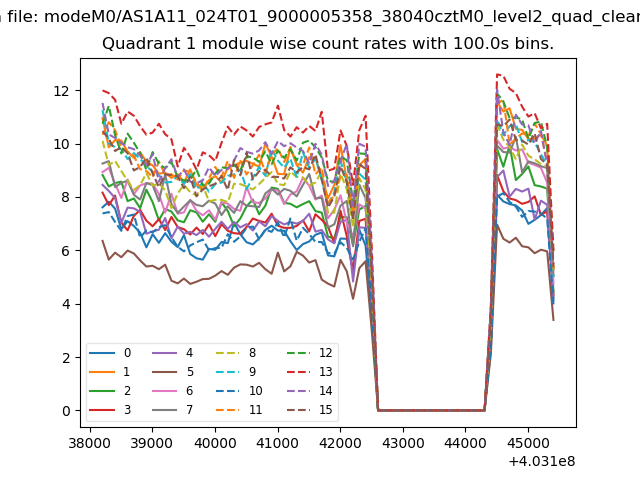
| Module-wise count rates for Quadrant A Data is divided into 100 sec bins |
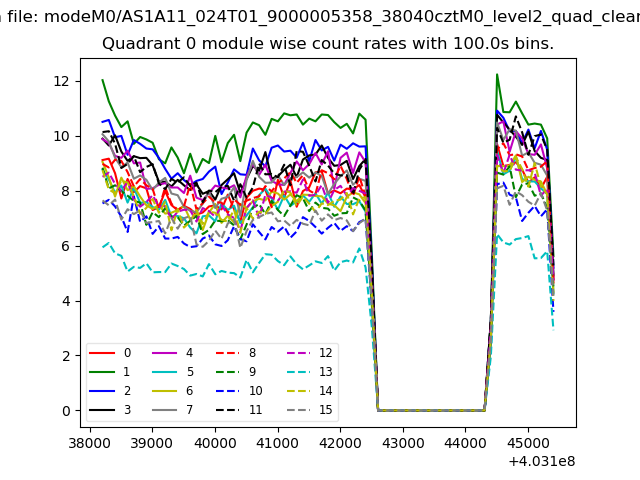 |
 |
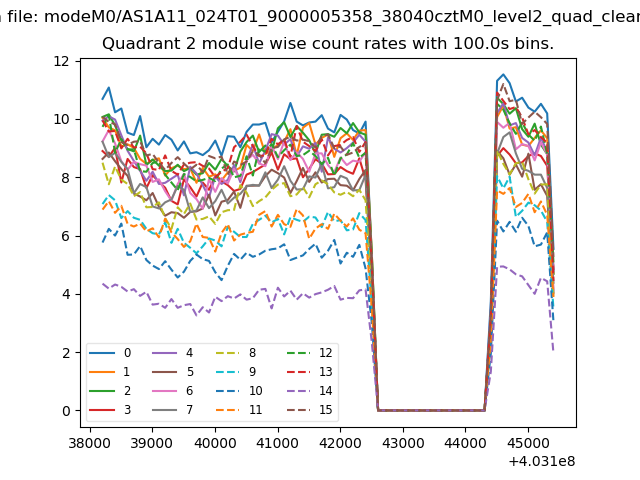
| Module-wise count rates for Quadrant B Data is divided into 100 sec bins |
 |
 |
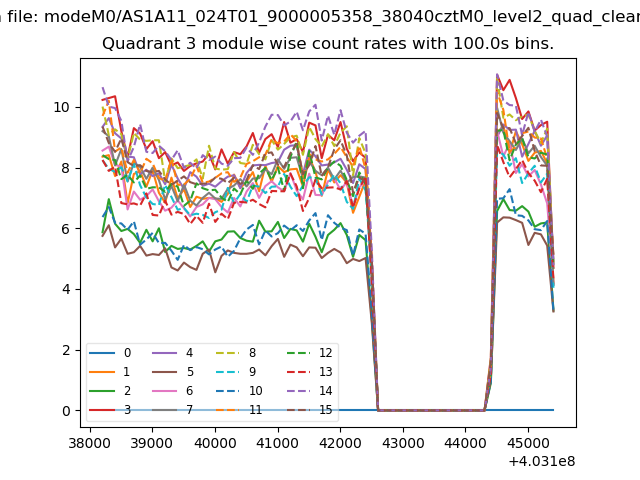
| Module-wise count rates for Quadrant C Data is divided into 100 sec bins |
 |
 |
| Module-wise count rates for Quadrant D Data is divided into 100 sec bins |
 |
 |
| Parameter | Plot |
|---|---|
| CZT HV Monitor | 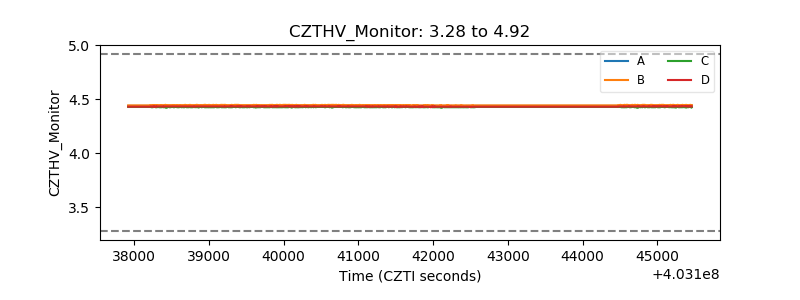 |
| D_VDD | 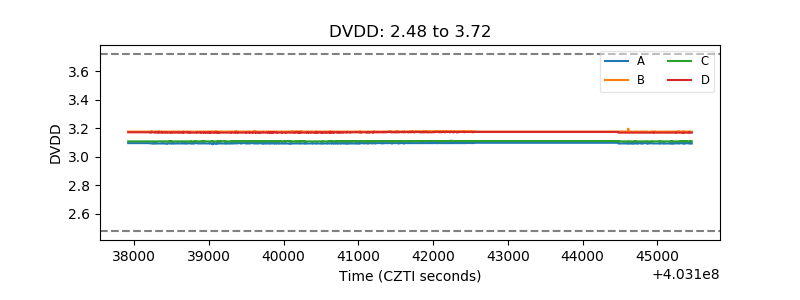 |
| Temperature 1 | 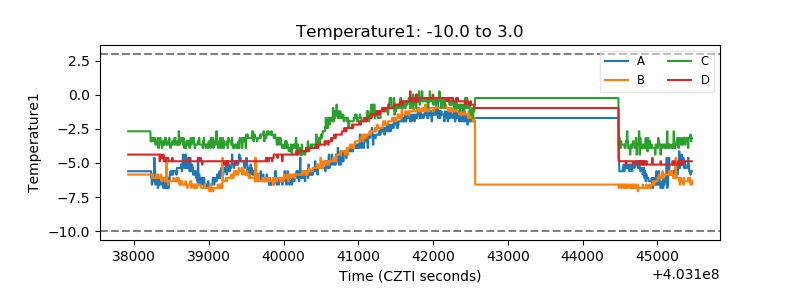 |
| Veto HV Monitor | 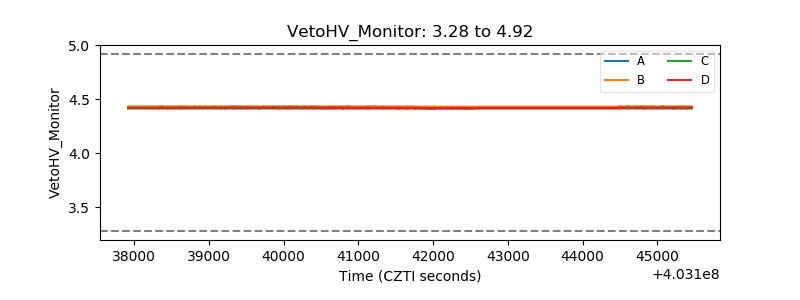 |
| Veto LLD | 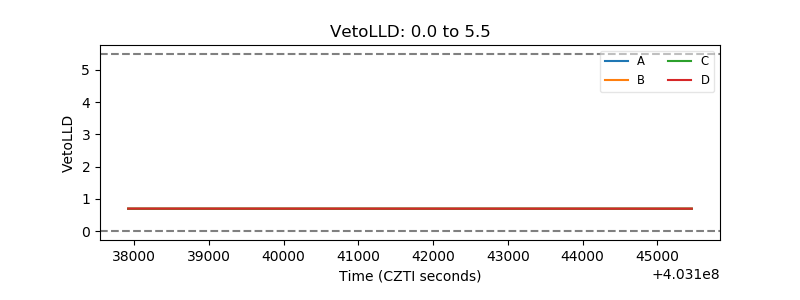 |
| Alpha Counter | 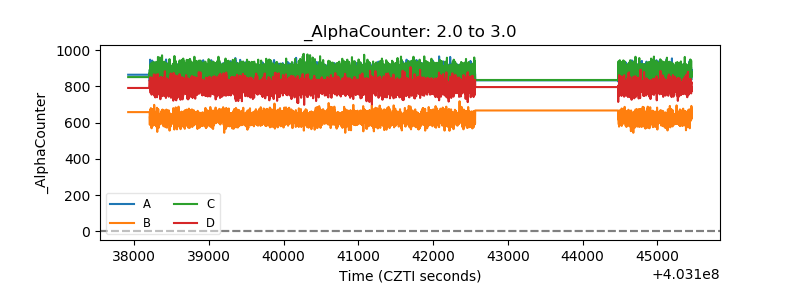 |
| _CPM_Rate | 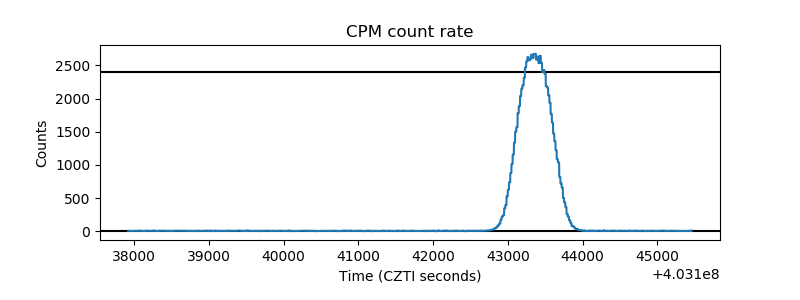 |
| CZT Counter |  |
| +2.5 Volts monitor | 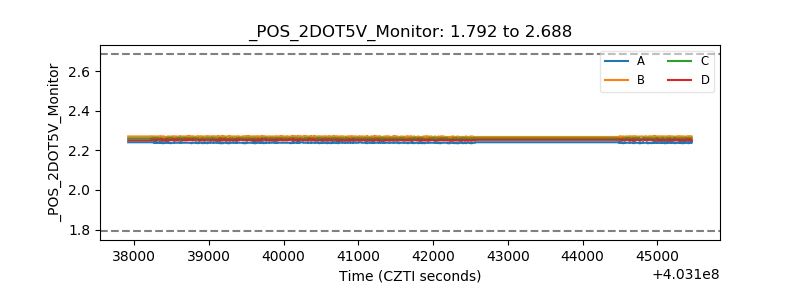 |
| +5 Volts monitor | 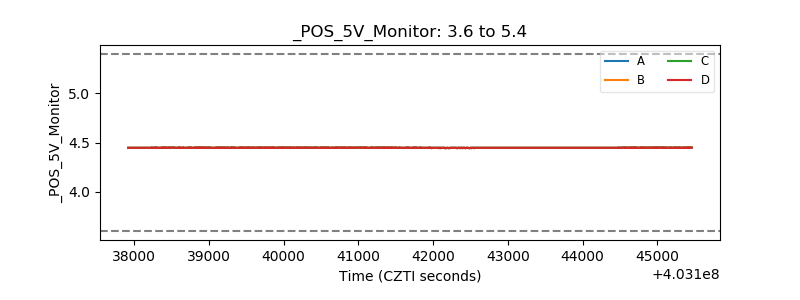 |
| _ROLL_ROT | 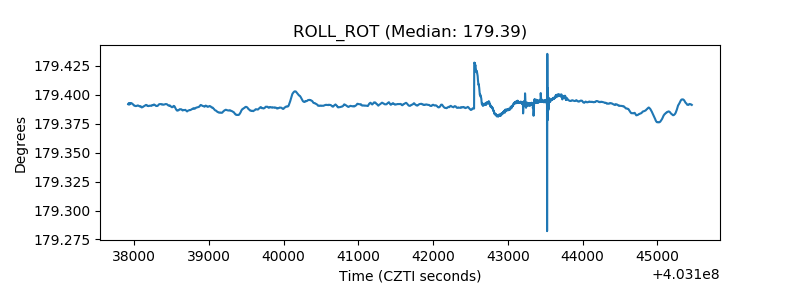 |
| _Roll_DEC | 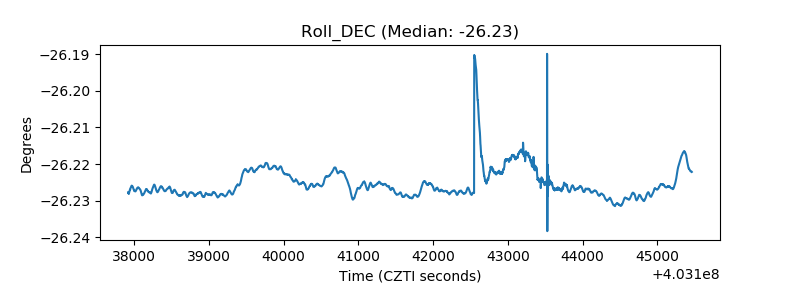 |
| _Roll_RA | 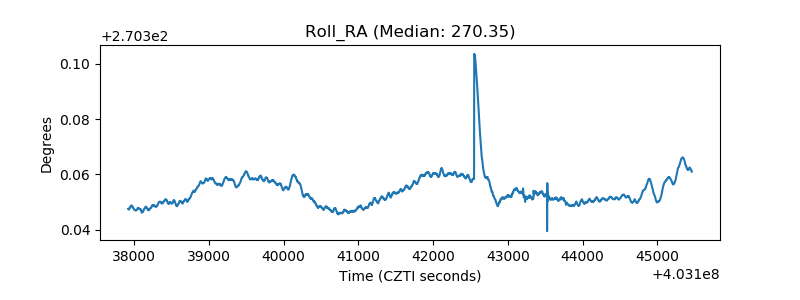 |
| Veto Counter | 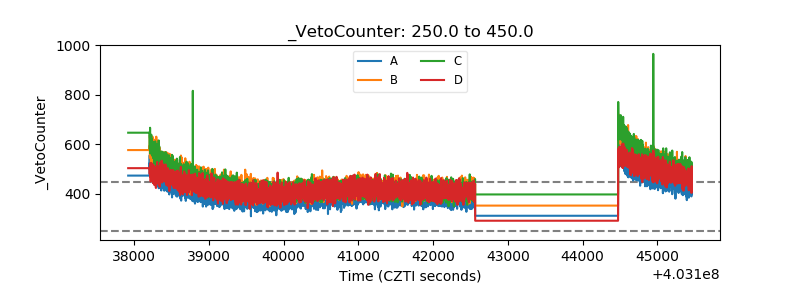 |