| Param | Original file | Final file |
|---|---|---|
| Filename | modeM0/AS1A11_024T01_9000005358_38041cztM0_level2.fits | modeM0/AS1A11_024T01_9000005358_38041cztM0_level2_quad_clean.evt |
| Size (bytes) | 357,978,240 | 103,927,680 |
| Size | 341.4 MB | 99.1 MB |
| Events in quadrant A | 3,205,176 | 714,642 |
| Events in quadrant B | 3,483,506 | 730,566 |
| Events in quadrant C | 2,987,590 | 701,708 |
| Events in quadrant D | 3,165,300 | 631,832 |
| Mode M9 | |||
|---|---|---|---|
| Quadrant | BADHDUFLAG | Total packets | Discarded packets |
| A | 0 | 28 | 0 |
| B | 0 | 28 | 0 |
| C | 0 | 28 | 0 |
| D | 0 | 29 | 0 |
| Mode SS | |||
|---|---|---|---|
| Quadrant | BADHDUFLAG | Total packets | Discarded packets |
| A | 0 | 106 | 0 |
| B | 0 | 106 | 0 |
| C | 0 | 106 | 0 |
| D | 0 | 106 | 0 |
| Mode M0 | |||
|---|---|---|---|
| Quadrant | BADHDUFLAG | Total packets | Discarded packets |
| A | 0 | 12755 | 3 |
| B | 0 | 13587 | 2 |
| C | 0 | 11779 | 2 |
| D | 0 | 12529 | 2 |
| Quadrant | Total seconds | Saturated seconds | Saturation percentage |
|---|---|---|---|
| A | 5266 | 22 | 0.417774% |
| B | 5266 | 174 | 3.304216% |
| C | 5266 | 18 | 0.341815% |
| D | 5266 | 76 | 1.443221% |
Noise dominated data is calculated using 1-second bins in cleaned event files. If a bin has >2000 counts, and if more than 50% of those come from <1% of pixels, then it is considered to be noise-dominated and hence unusable.
| Quadrant | # 1 sec bins | Bins with >0 counts | Bins with >2000 counts | High rate bins dominated by noise | Noise dominated (total time) | Noise dominated (detector-on time) | Marked lightcurve |
|---|---|---|---|---|---|---|---|
| A | 7299 | 5267 | 6 | 6 | 0.08% | 0.11% | 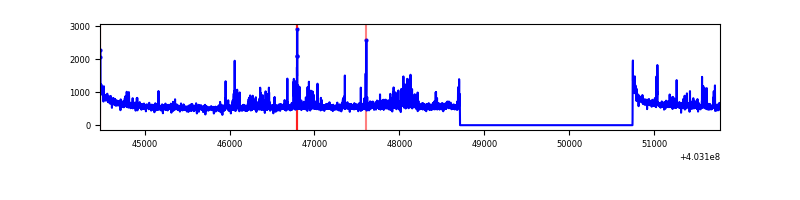 |
| B | 7299 | 5267 | 103 | 103 | 1.41% | 1.96% | 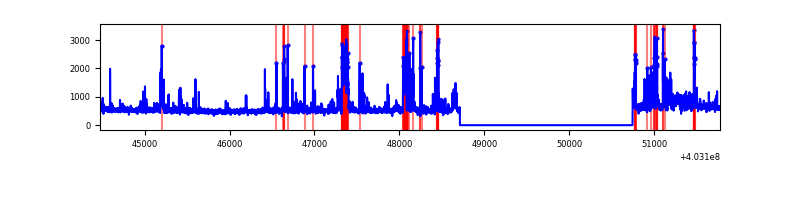 |
| C | 7299 | 5267 | 10 | 10 | 0.14% | 0.19% | 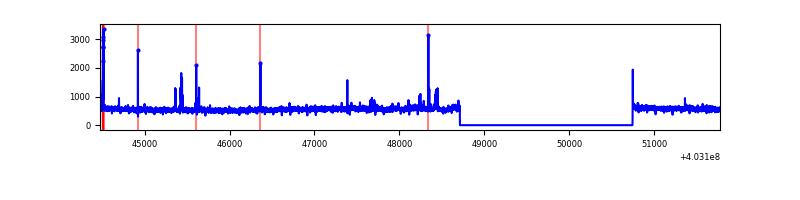 |
| D | 7299 | 5267 | 65 | 65 | 0.89% | 1.23% | 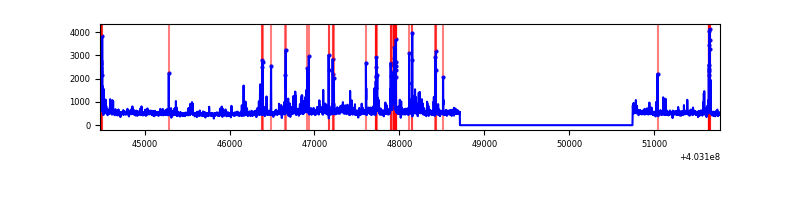 |
Top three noisy pixels from each quadrant. If the there are fewer than three noisy pixels in the level2.evt file, extra rows are filled as -1
| Pixel properties | Quadrant properties | ||||||
|---|---|---|---|---|---|---|---|
| Quadrant | DetID | PixID | Counts | Sigma | Mean | Median | Sigma |
| A | 10 | 83 | 362660 | 2666.17 | 675 | 664 | 135.8 |
| A | 12 | 227 | 98849 | 723.15 | 675 | 664 | 135.8 |
| A | 12 | 16 | 72976 | 532.59 | 675 | 664 | 135.8 |
| B | 5 | 184 | 326031 | 2579.56 | 671 | 658 | 126.1 |
| B | 4 | 171 | 304134 | 2405.96 | 671 | 658 | 126.1 |
| B | 5 | 255 | 120795 | 952.45 | 671 | 658 | 126.1 |
| C | 15 | 214 | 224770 | 1485.76 | 660 | 666 | 150.8 |
| C | 3 | 233 | 88617 | 583.09 | 660 | 666 | 150.8 |
| C | 1 | 23 | 84921 | 558.59 | 660 | 666 | 150.8 |
| D | 12 | 227 | 160679 | 1015.31 | 652 | 633 | 157.6 |
| D | 7 | 223 | 126667 | 799.54 | 652 | 633 | 157.6 |
| D | 2 | 250 | 86344 | 543.74 | 652 | 633 | 157.6 |
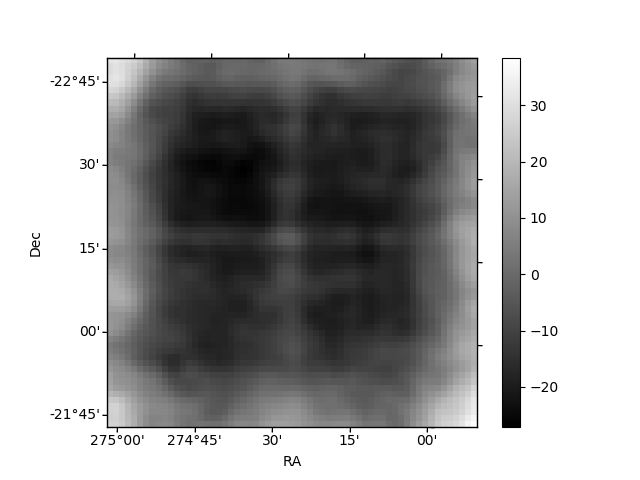
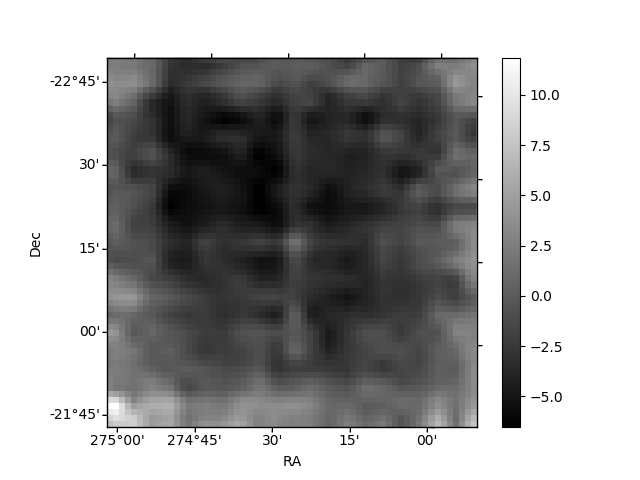
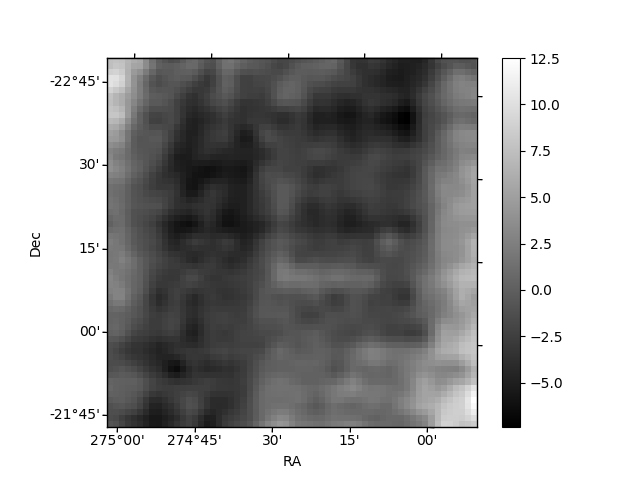
Histogram calculated using DETX and DETY for each event in the final _common_clean file
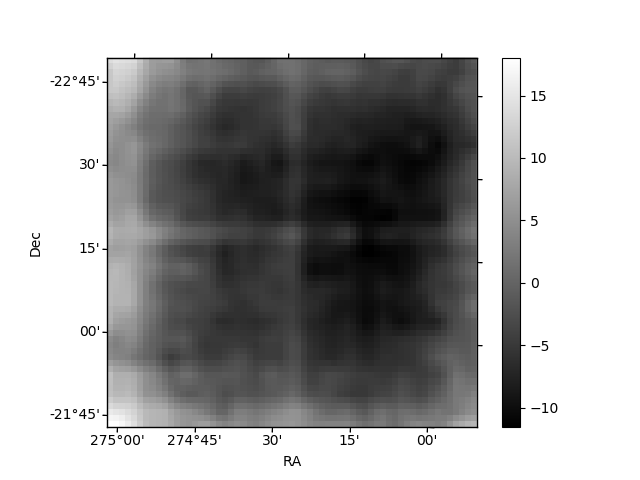
| Quadrant A | 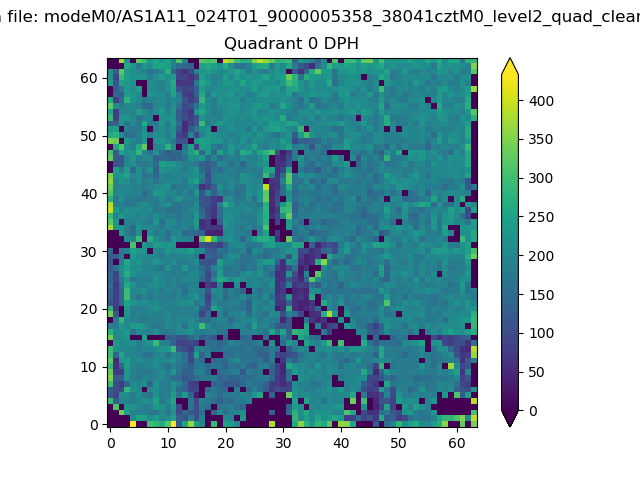 |
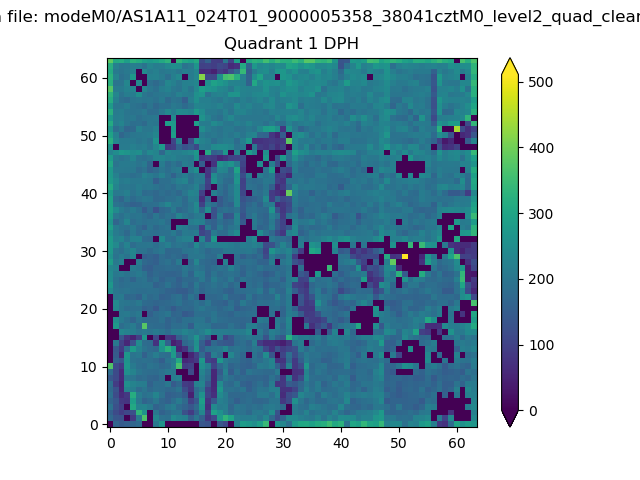 |
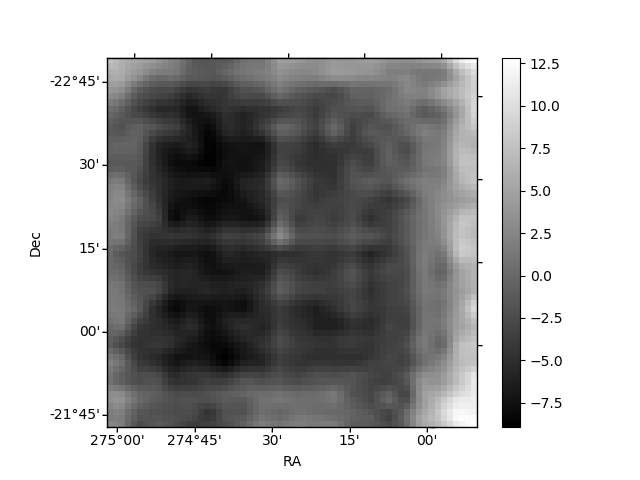
Quadrant B |
|---|---|---|---|
| Quadrant D | 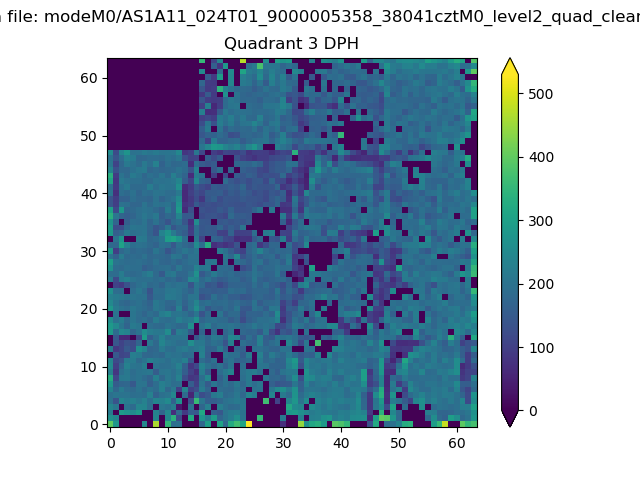 |
 |
Quadrant C |
| Plot type | Count rate plots | Images |
|---|---|---|
| Comparison with Poisson distribution Blue bars denote a histogram of data divided into 1 sec bins. Red curve is a Poisson curve with rate = median count rate of data. |
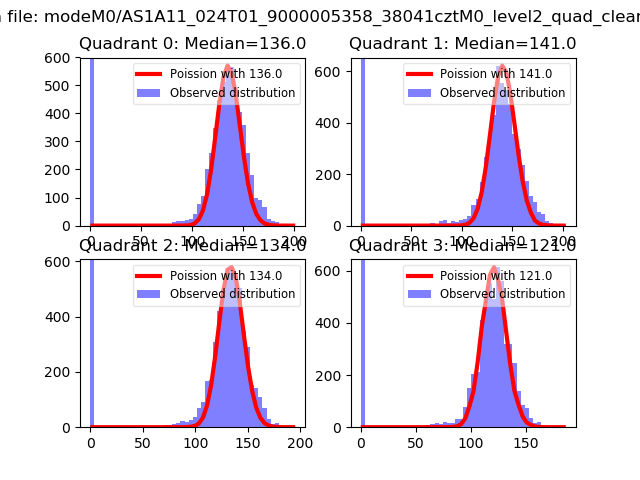 |
 |
| Quadrant-wise count rates Data is divided into 100 sec bins |
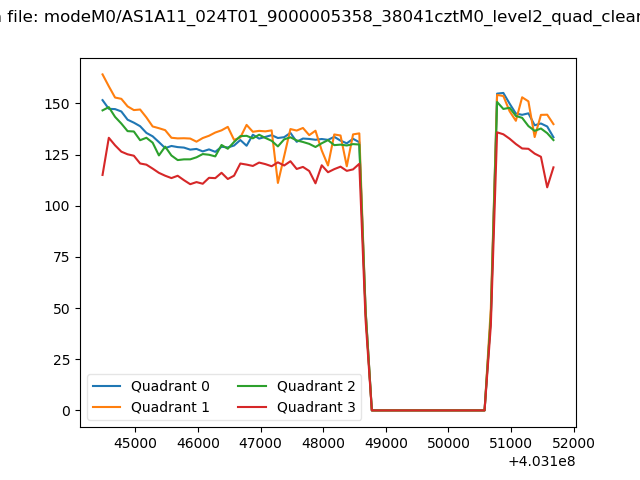 |
|
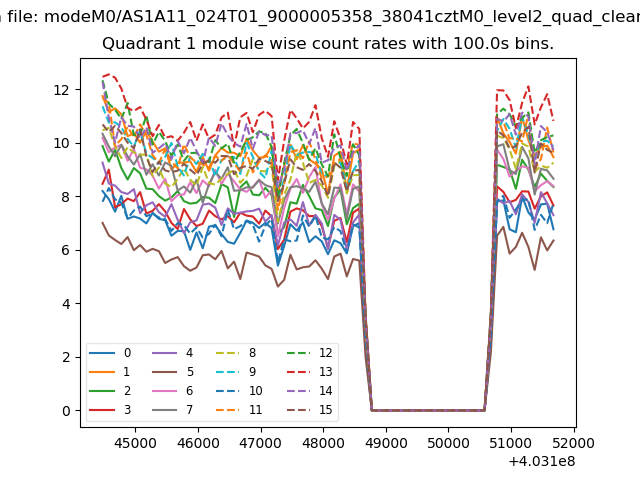
| Module-wise count rates for Quadrant A Data is divided into 100 sec bins |
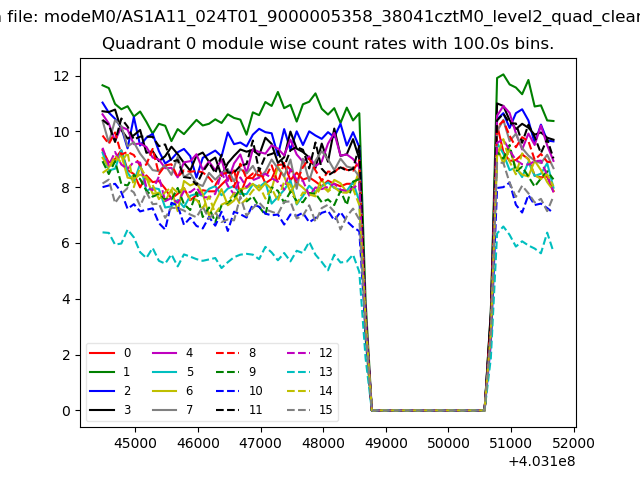 |
 |
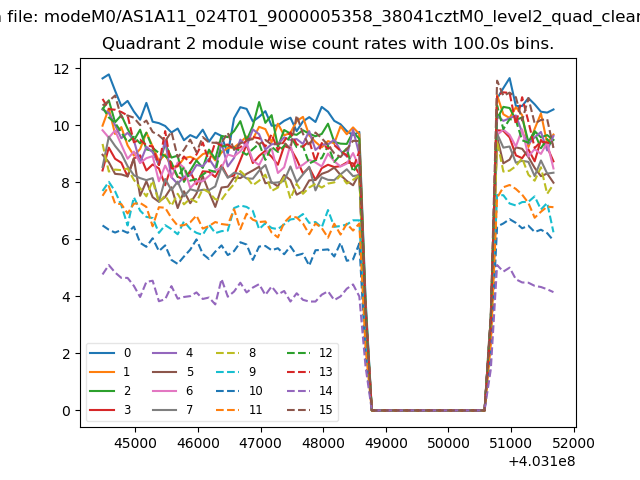
| Module-wise count rates for Quadrant B Data is divided into 100 sec bins |
 |
 |
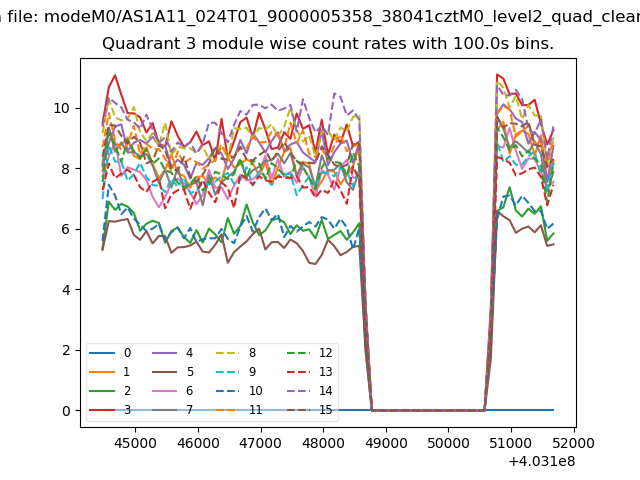
| Module-wise count rates for Quadrant C Data is divided into 100 sec bins |
 |
 |
| Module-wise count rates for Quadrant D Data is divided into 100 sec bins |
 |
 |
| Parameter | Plot |
|---|---|
| CZT HV Monitor | 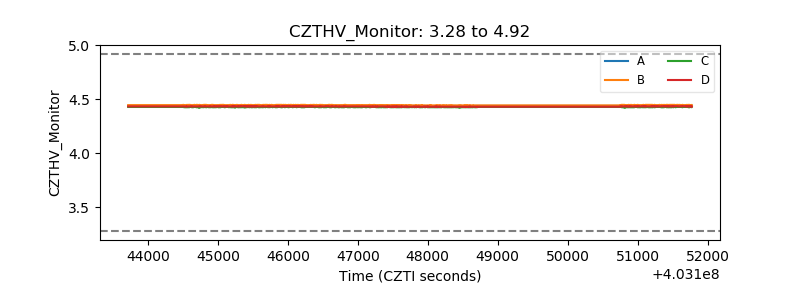 |
| D_VDD | 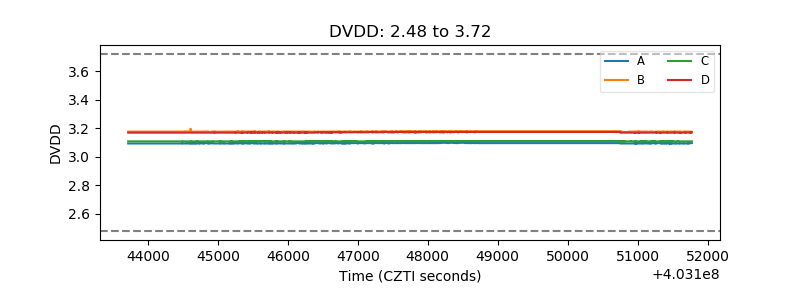 |
| Temperature 1 | 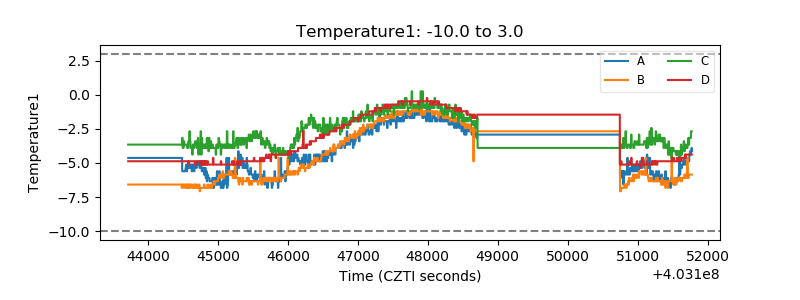 |
| Veto HV Monitor | 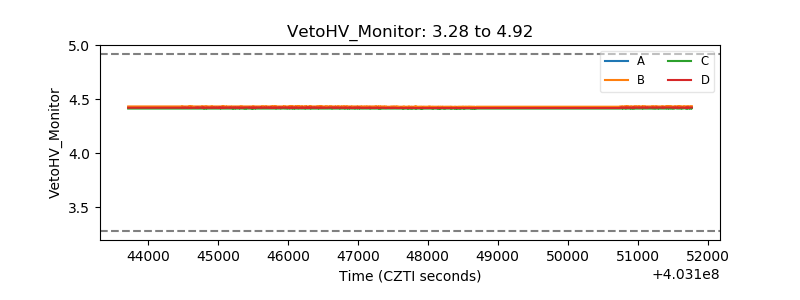 |
| Veto LLD | 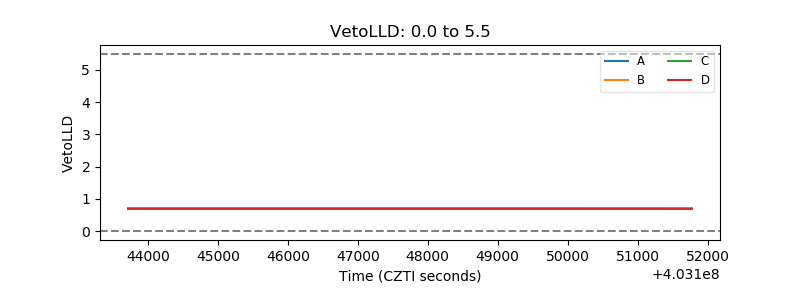 |
| Alpha Counter | 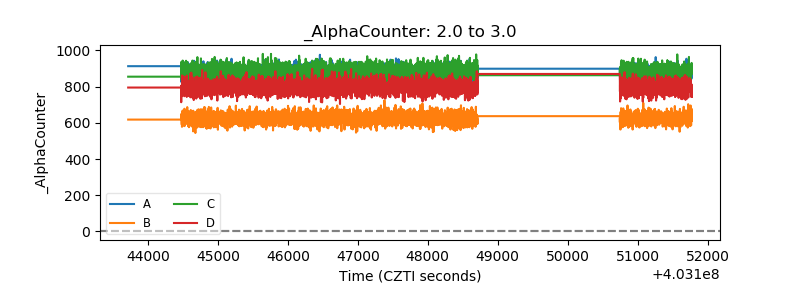 |
| _CPM_Rate | 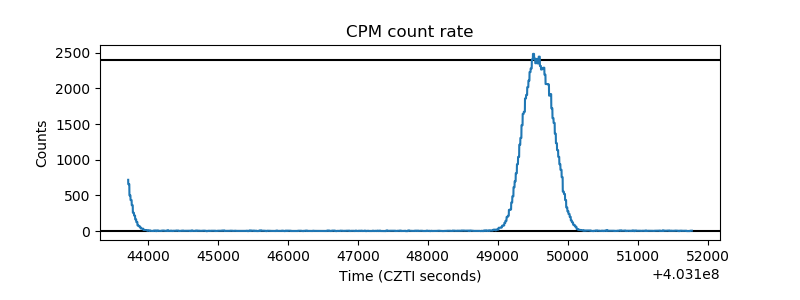 |
| CZT Counter | 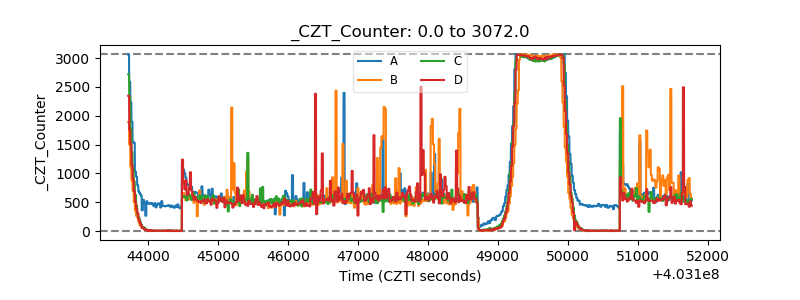 |
| +2.5 Volts monitor |  |
| +5 Volts monitor | 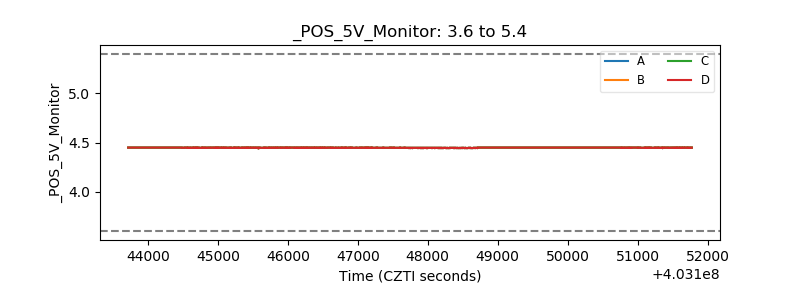 |
| _ROLL_ROT | 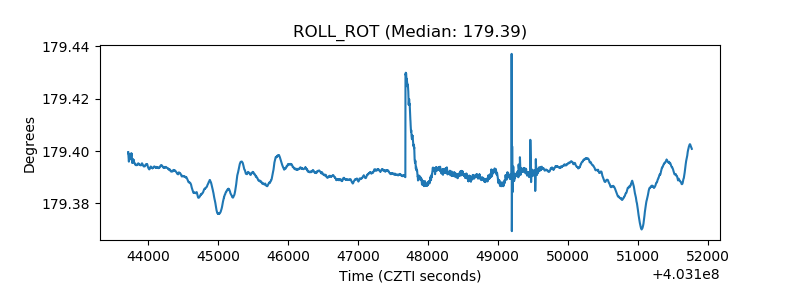 |
| _Roll_DEC | 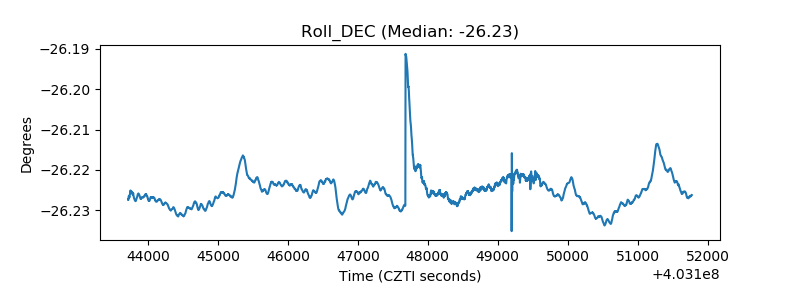 |
| _Roll_RA | 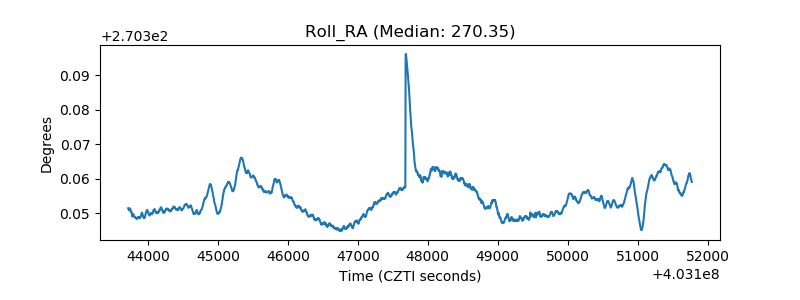 |
| Veto Counter | 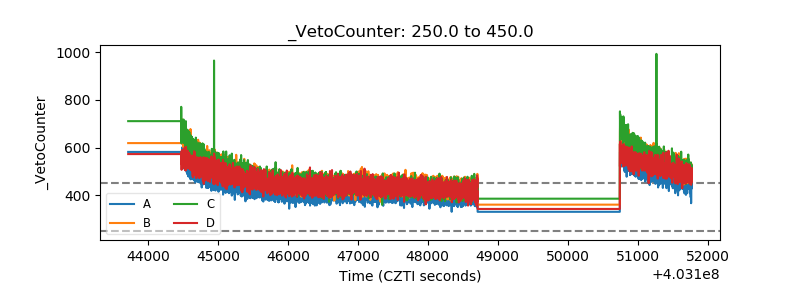 |