| Param | Original file | Final file |
|---|---|---|
| Filename | modeM0/AS1A11_024T01_9000005358_38042cztM0_level2.fits | modeM0/AS1A11_024T01_9000005358_38042cztM0_level2_quad_clean.evt |
| Size (bytes) | 356,463,360 | 98,444,160 |
| Size | 339.9 MB | 93.9 MB |
| Events in quadrant A | 2,918,478 | 679,744 |
| Events in quadrant B | 3,769,154 | 687,170 |
| Events in quadrant C | 2,790,427 | 670,082 |
| Events in quadrant D | 3,333,218 | 597,920 |
| Mode M9 | |||
|---|---|---|---|
| Quadrant | BADHDUFLAG | Total packets | Discarded packets |
| A | 0 | 20 | 0 |
| B | 0 | 20 | 0 |
| C | 0 | 20 | 0 |
| D | 0 | 20 | 0 |
| Mode SS | |||
|---|---|---|---|
| Quadrant | BADHDUFLAG | Total packets | Discarded packets |
| A | 0 | 102 | 0 |
| B | 0 | 102 | 0 |
| C | 0 | 102 | 0 |
| D | 0 | 102 | 0 |
| Mode M0 | |||
|---|---|---|---|
| Quadrant | BADHDUFLAG | Total packets | Discarded packets |
| A | 0 | 11545 | 3 |
| B | 0 | 14432 | 2 |
| C | 0 | 11019 | 2 |
| D | 0 | 12859 | 2 |
| Quadrant | Total seconds | Saturated seconds | Saturation percentage |
|---|---|---|---|
| A | 4934 | 21 | 0.425618% |
| B | 4934 | 219 | 4.438589% |
| C | 4934 | 6 | 0.121605% |
| D | 4934 | 142 | 2.877989% |
Noise dominated data is calculated using 1-second bins in cleaned event files. If a bin has >2000 counts, and if more than 50% of those come from <1% of pixels, then it is considered to be noise-dominated and hence unusable.
| Quadrant | # 1 sec bins | Bins with >0 counts | Bins with >2000 counts | High rate bins dominated by noise | Noise dominated (total time) | Noise dominated (detector-on time) | Marked lightcurve |
|---|---|---|---|---|---|---|---|
| A | 7027 | 4935 | 4 | 4 | 0.06% | 0.08% | 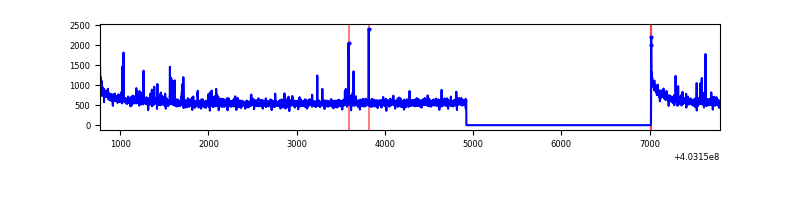 |
| B | 7027 | 4935 | 127 | 127 | 1.81% | 2.57% | 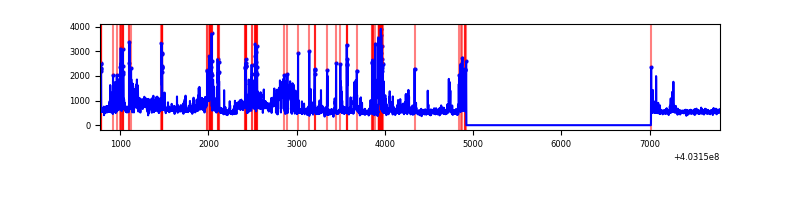 |
| C | 7027 | 4935 | 4 | 4 | 0.06% | 0.08% | 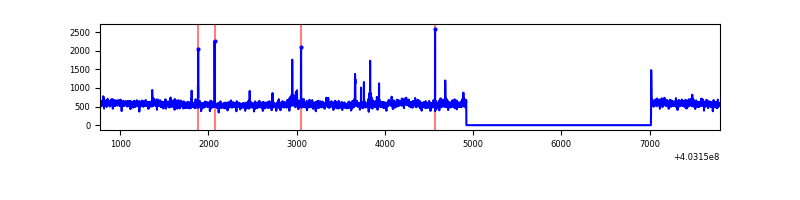 |
| D | 7027 | 4935 | 113 | 113 | 1.61% | 2.29% | 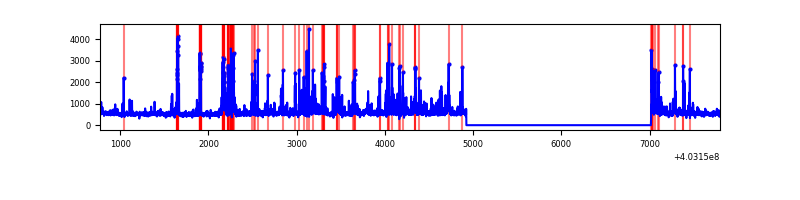 |
Top three noisy pixels from each quadrant. If the there are fewer than three noisy pixels in the level2.evt file, extra rows are filled as -1
| Pixel properties | Quadrant properties | ||||||
|---|---|---|---|---|---|---|---|
| Quadrant | DetID | PixID | Counts | Sigma | Mean | Median | Sigma |
| A | 10 | 83 | 348654 | 2705.74 | 641 | 632 | 128.6 |
| A | 12 | 227 | 51956 | 399.02 | 641 | 632 | 128.6 |
| A | 12 | 16 | 16891 | 126.41 | 641 | 632 | 128.6 |
| B | 5 | 184 | 605971 | 5118.75 | 629 | 615 | 118.3 |
| B | 4 | 171 | 358631 | 3027.3 | 629 | 615 | 118.3 |
| B | 5 | 255 | 154826 | 1303.97 | 629 | 615 | 118.3 |
| C | 15 | 214 | 211848 | 1478.23 | 624 | 631 | 142.9 |
| C | 3 | 233 | 85984 | 597.35 | 624 | 631 | 142.9 |
| C | 1 | 23 | 47725 | 329.59 | 624 | 631 | 142.9 |
| D | 1 | 47 | 356164 | 2363.32 | 618 | 602 | 150.5 |
| D | 2 | 250 | 134538 | 890.23 | 618 | 602 | 150.5 |
| D | 7 | 223 | 110426 | 729.97 | 618 | 602 | 150.5 |
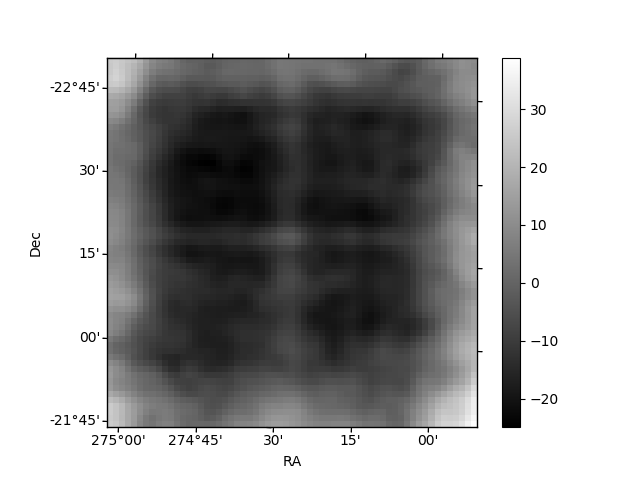
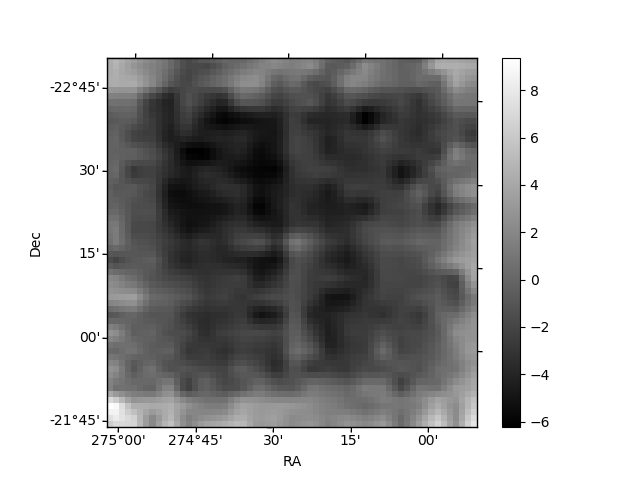
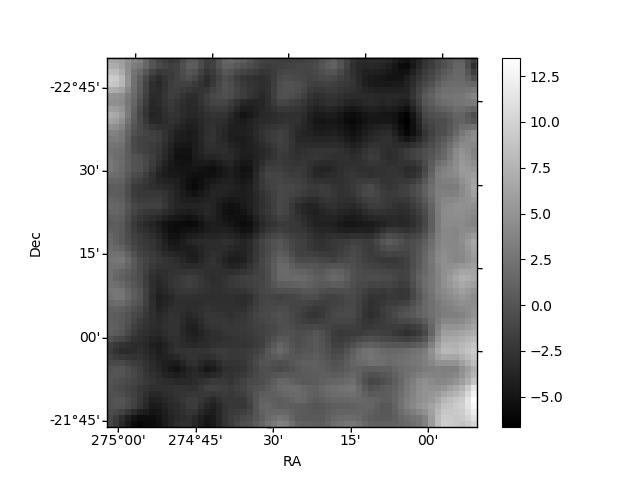
Histogram calculated using DETX and DETY for each event in the final _common_clean file
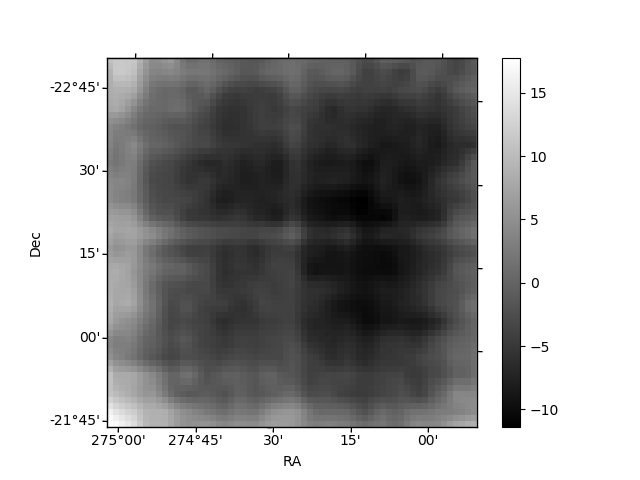
| Quadrant A | 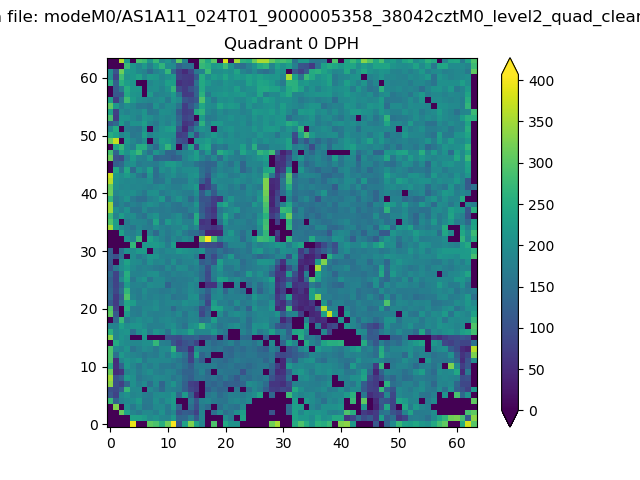 |
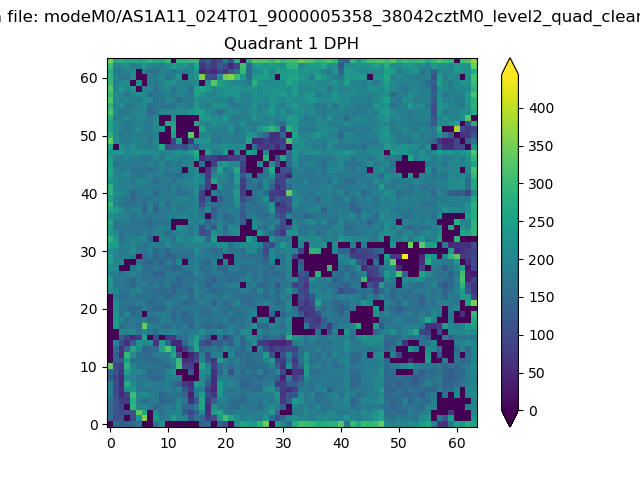 |
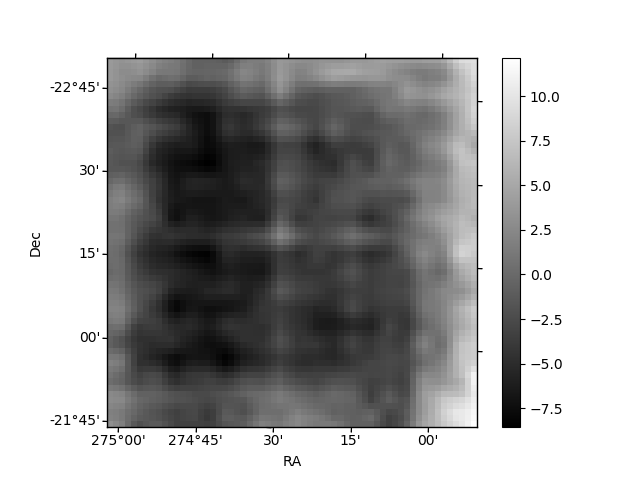
Quadrant B |
|---|---|---|---|
| Quadrant D | 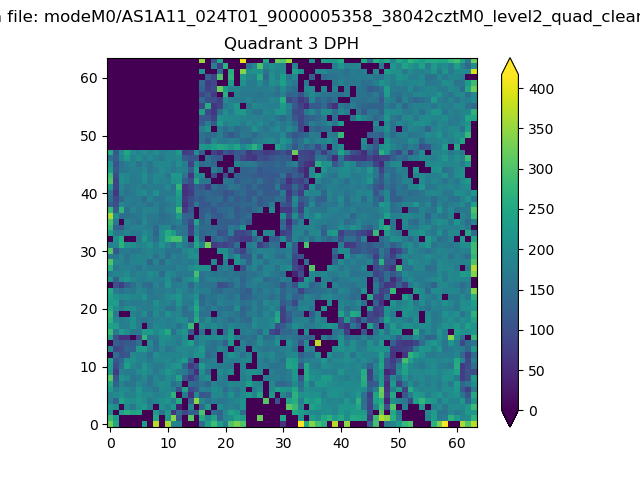 |
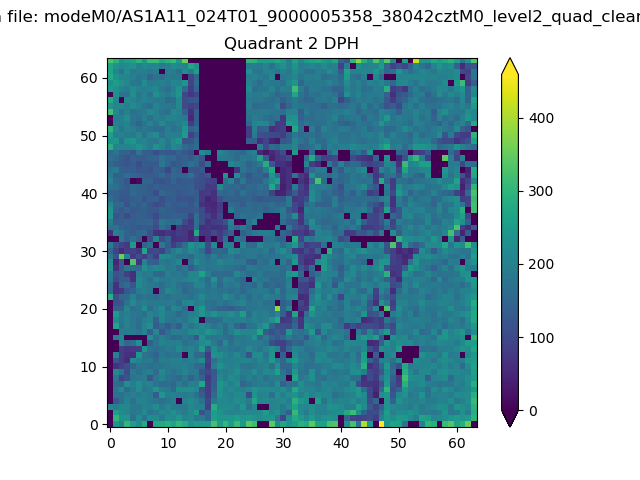 |
Quadrant C |
| Plot type | Count rate plots | Images |
|---|---|---|
| Comparison with Poisson distribution Blue bars denote a histogram of data divided into 1 sec bins. Red curve is a Poisson curve with rate = median count rate of data. |
 |
 |
| Quadrant-wise count rates Data is divided into 100 sec bins |
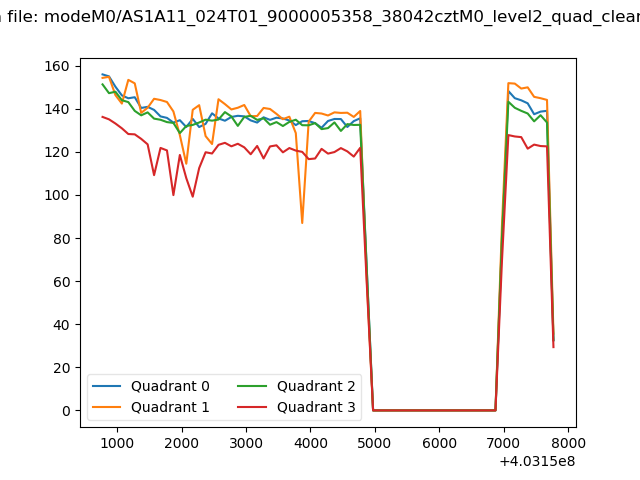 |
|
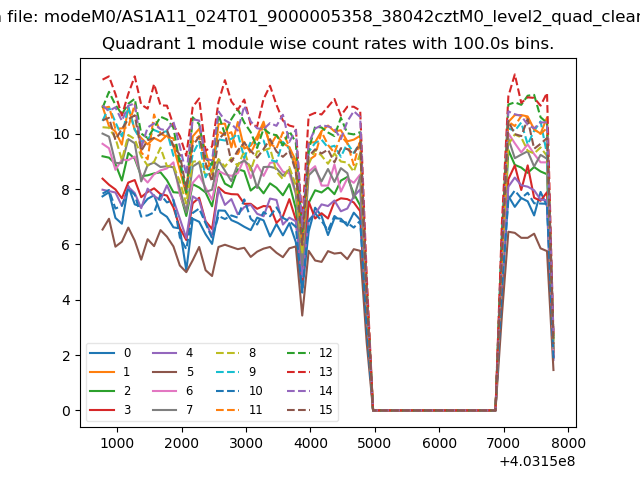
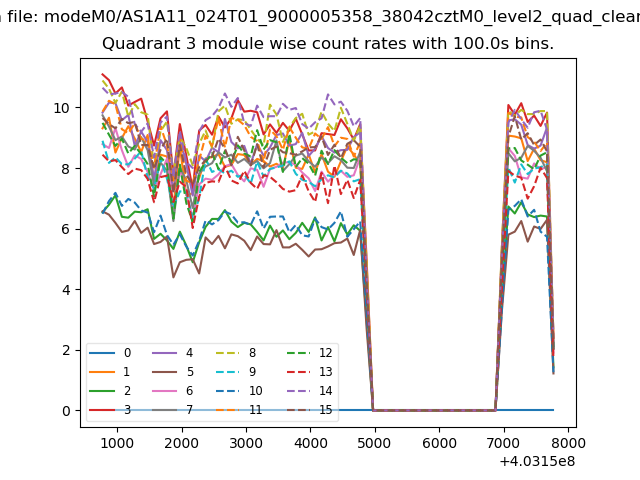
| Module-wise count rates for Quadrant A Data is divided into 100 sec bins |
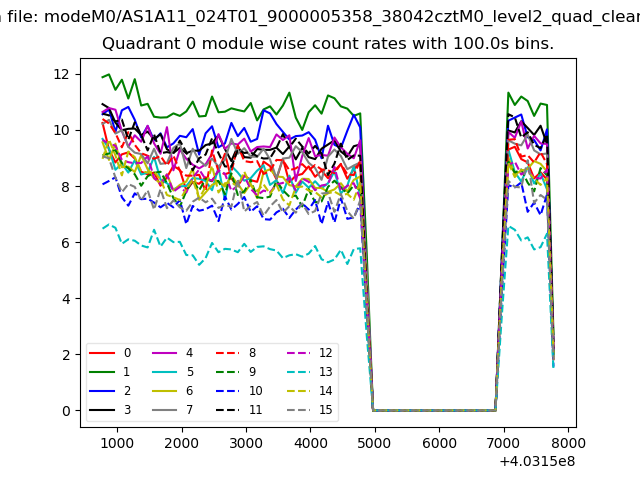 |
 |
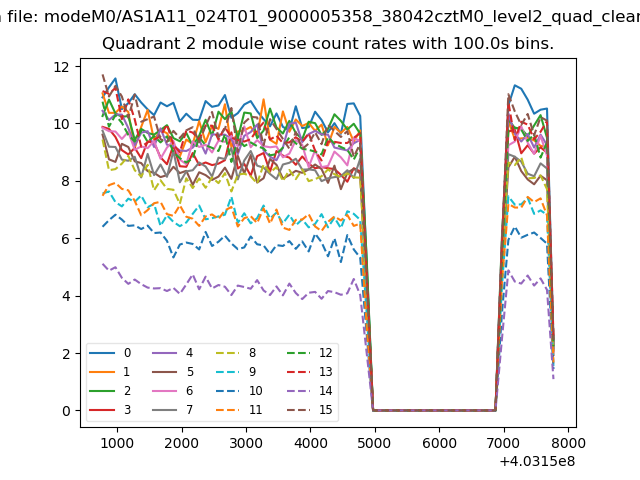
| Module-wise count rates for Quadrant B Data is divided into 100 sec bins |
 |
 |
| Module-wise count rates for Quadrant C Data is divided into 100 sec bins |
 |
 |
| Module-wise count rates for Quadrant D Data is divided into 100 sec bins |
 |
 |
| Parameter | Plot |
|---|---|
| CZT HV Monitor | 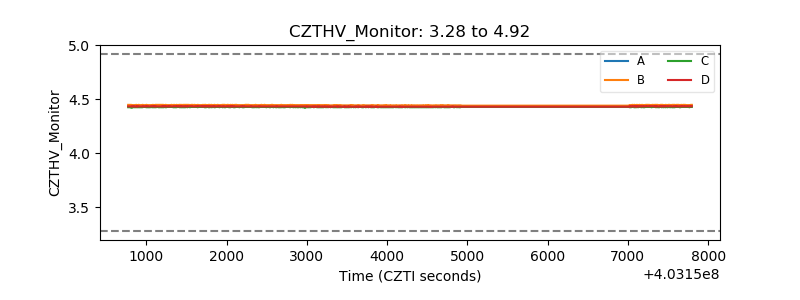 |
| D_VDD | 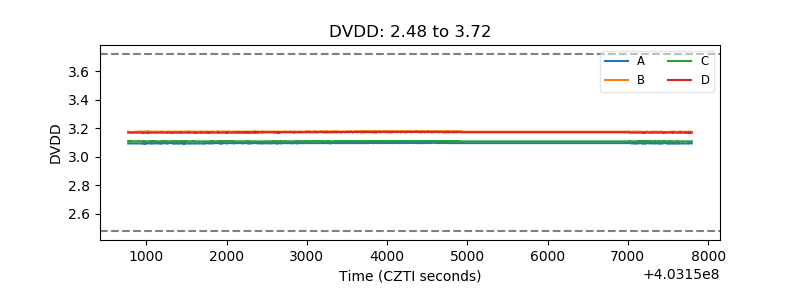 |
| Temperature 1 | 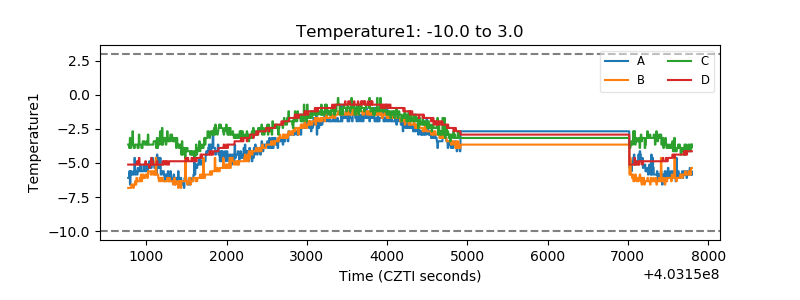 |
| Veto HV Monitor | 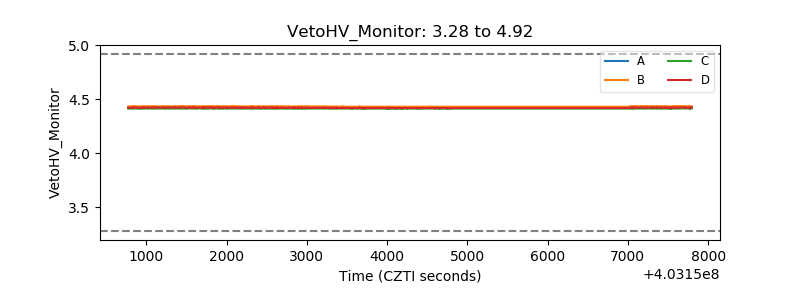 |
| Veto LLD | 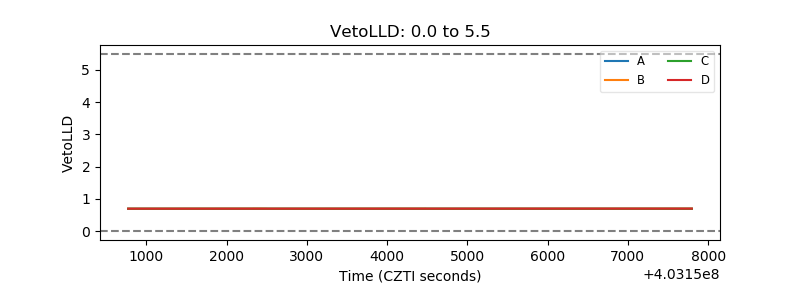 |
| Alpha Counter | 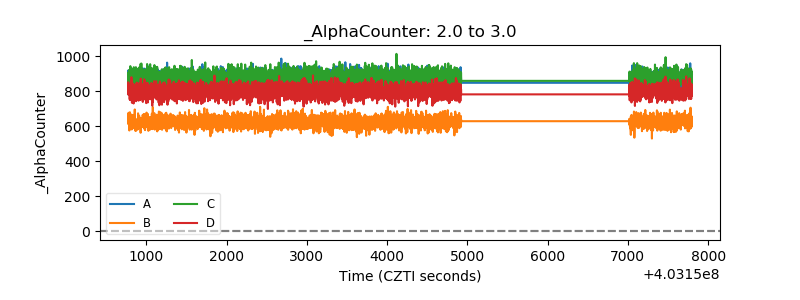 |
| _CPM_Rate | 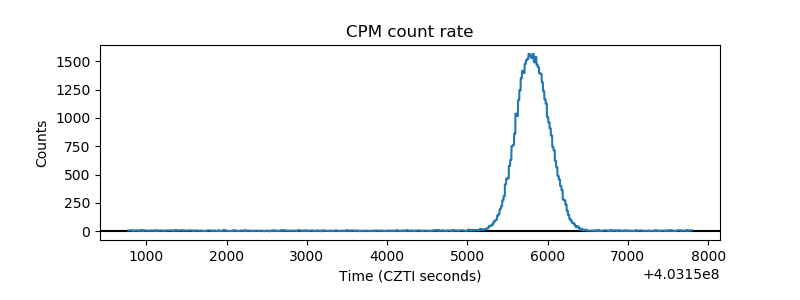 |
| CZT Counter | 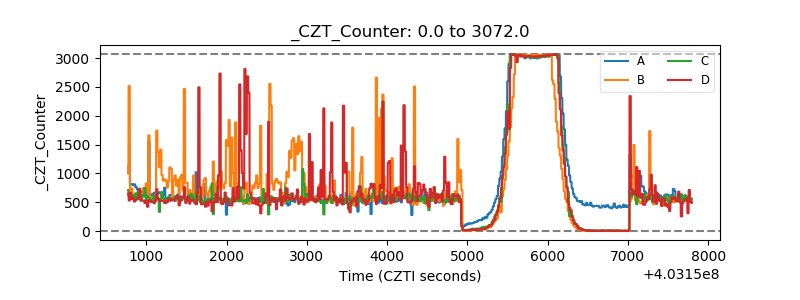 |
| +2.5 Volts monitor | 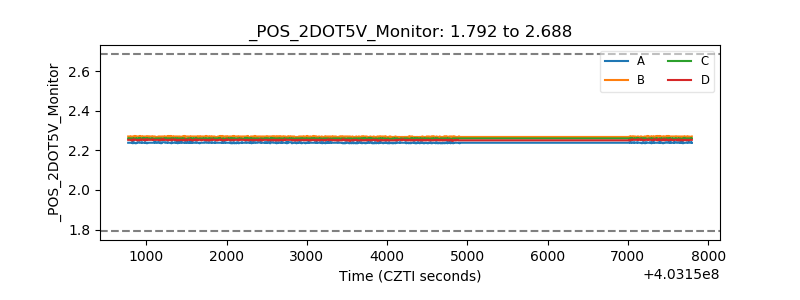 |
| +5 Volts monitor | 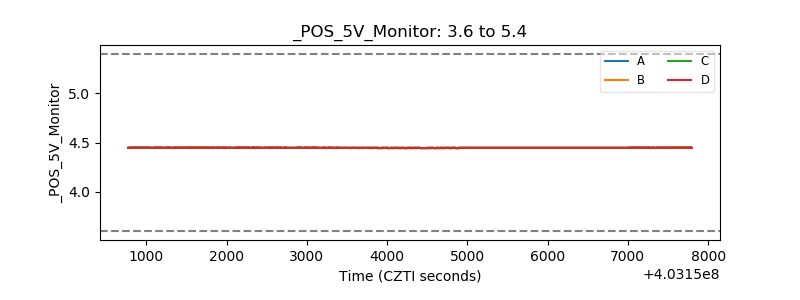 |
| _ROLL_ROT | 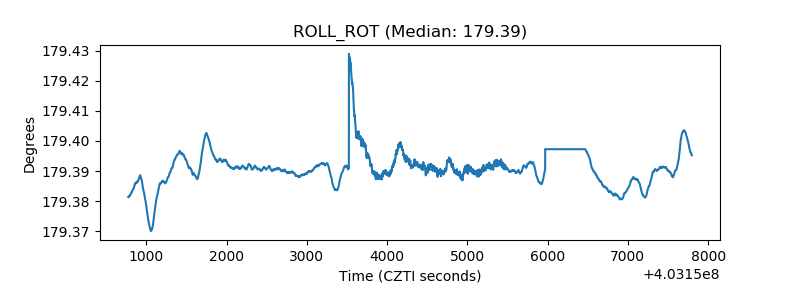 |
| _Roll_DEC | 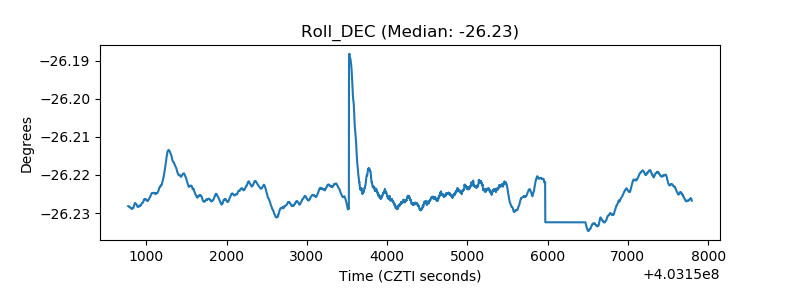 |
| _Roll_RA | 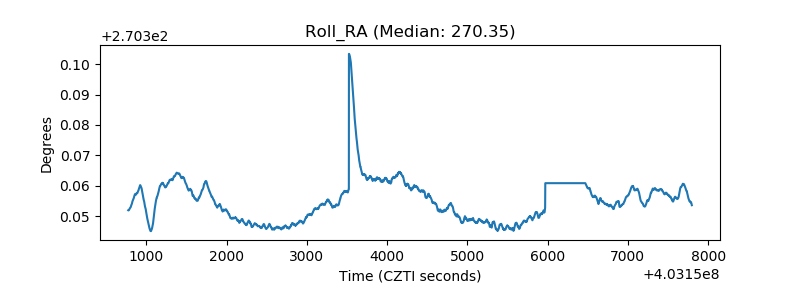 |
| Veto Counter | 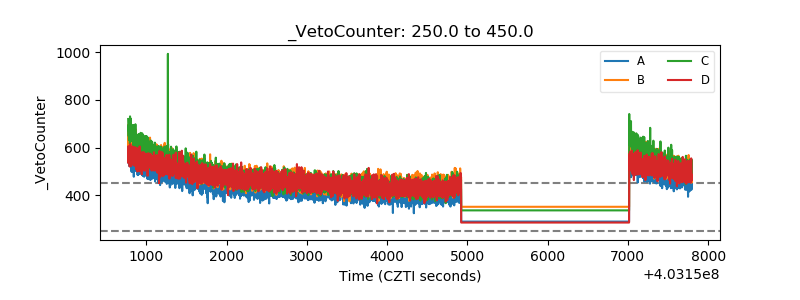 |