| Param | Original file | Final file |
|---|---|---|
| Filename | modeM0/AS1A11_024T01_9000005358_38043cztM0_level2.fits | modeM0/AS1A11_024T01_9000005358_38043cztM0_level2_quad_clean.evt |
| Size (bytes) | 317,260,800 | 95,889,600 |
| Size | 302.6 MB | 91.4 MB |
| Events in quadrant A | 2,862,022 | 654,774 |
| Events in quadrant B | 2,741,132 | 677,219 |
| Events in quadrant C | 2,670,808 | 647,522 |
| Events in quadrant D | 3,089,219 | 581,014 |
| Mode M9 | |||
|---|---|---|---|
| Quadrant | BADHDUFLAG | Total packets | Discarded packets |
| A | 0 | 25 | 0 |
| B | 0 | 25 | 0 |
| C | 0 | 25 | 0 |
| D | 0 | 26 | 0 |
| Mode SS | |||
|---|---|---|---|
| Quadrant | BADHDUFLAG | Total packets | Discarded packets |
| A | 0 | 102 | 0 |
| B | 0 | 102 | 0 |
| C | 0 | 102 | 0 |
| D | 0 | 102 | 0 |
| Mode M0 | |||
|---|---|---|---|
| Quadrant | BADHDUFLAG | Total packets | Discarded packets |
| A | 0 | 11322 | 3 |
| B | 0 | 10857 | 2 |
| C | 0 | 10481 | 2 |
| D | 0 | 11991 | 2 |
| Quadrant | Total seconds | Saturated seconds | Saturation percentage |
|---|---|---|---|
| A | 4888 | 24 | 0.490998% |
| B | 4888 | 36 | 0.736498% |
| C | 4888 | 6 | 0.122750% |
| D | 4888 | 106 | 2.168576% |
Noise dominated data is calculated using 1-second bins in cleaned event files. If a bin has >2000 counts, and if more than 50% of those come from <1% of pixels, then it is considered to be noise-dominated and hence unusable.
| Quadrant | # 1 sec bins | Bins with >0 counts | Bins with >2000 counts | High rate bins dominated by noise | Noise dominated (total time) | Noise dominated (detector-on time) | Marked lightcurve |
|---|---|---|---|---|---|---|---|
| A | 7009 | 4889 | 7 | 7 | 0.10% | 0.14% | 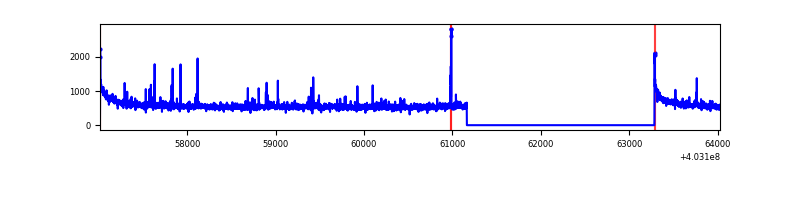 |
| B | 7009 | 4889 | 18 | 18 | 0.26% | 0.37% | 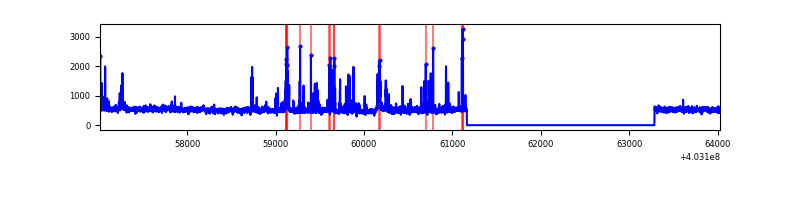 |
| C | 7009 | 4889 | 1 | 1 | 0.01% | 0.02% | 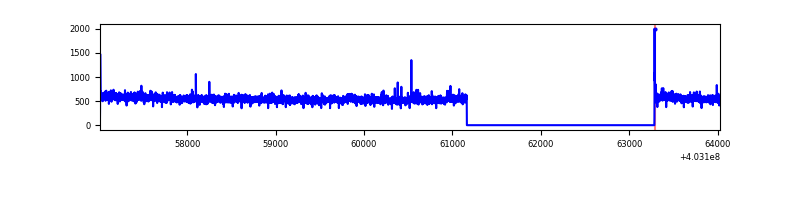 |
| D | 7009 | 4889 | 96 | 96 | 1.37% | 1.96% | 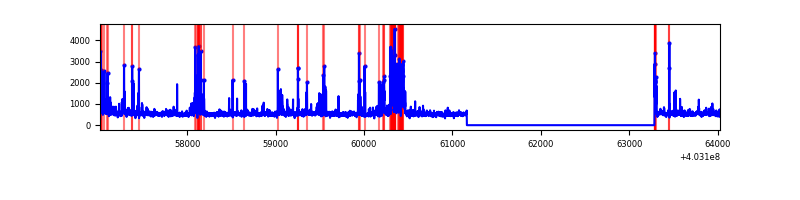 |
Top three noisy pixels from each quadrant. If the there are fewer than three noisy pixels in the level2.evt file, extra rows are filled as -1
| Pixel properties | Quadrant properties | ||||||
|---|---|---|---|---|---|---|---|
| Quadrant | DetID | PixID | Counts | Sigma | Mean | Median | Sigma |
| A | 10 | 83 | 352021 | 2800.82 | 623 | 614 | 125.5 |
| A | 12 | 227 | 56570 | 445.99 | 623 | 614 | 125.5 |
| A | 12 | 189 | 15998 | 122.62 | 623 | 614 | 125.5 |
| B | 5 | 172 | 115614 | 987.93 | 617 | 604 | 116.4 |
| B | 5 | 255 | 61843 | 526.04 | 617 | 604 | 116.4 |
| B | 4 | 171 | 53087 | 450.83 | 617 | 604 | 116.4 |
| C | 15 | 214 | 212274 | 1517.98 | 604 | 611 | 139.4 |
| C | 3 | 233 | 68543 | 487.19 | 604 | 611 | 139.4 |
| C | 1 | 23 | 16751 | 115.75 | 604 | 611 | 139.4 |
| D | 12 | 233 | 270418 | 1844.67 | 601 | 587 | 146.3 |
| D | 1 | 47 | 143717 | 978.49 | 601 | 587 | 146.3 |
| D | 7 | 223 | 118258 | 804.45 | 601 | 587 | 146.3 |
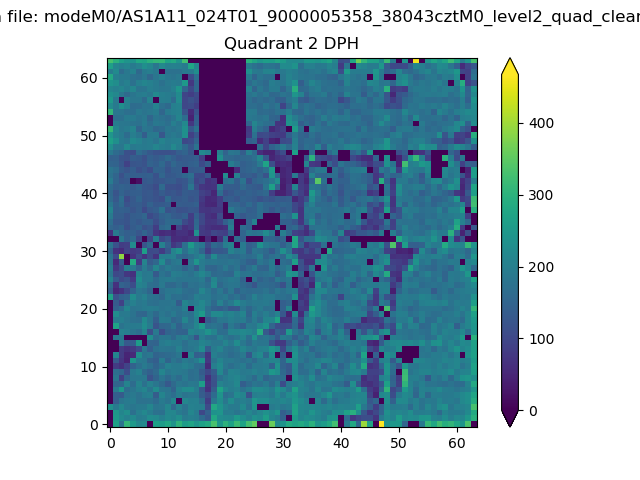
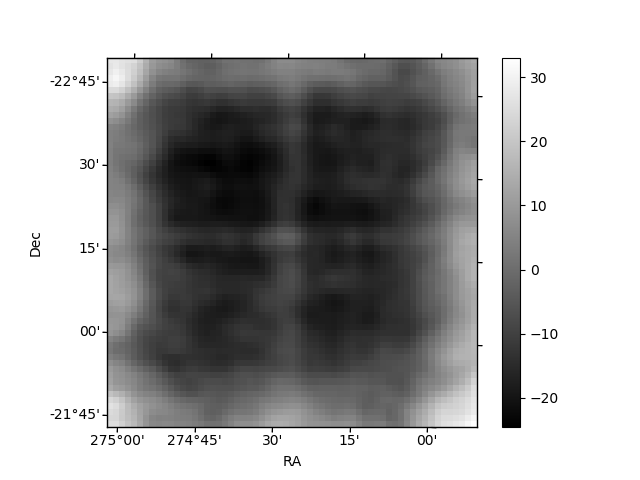
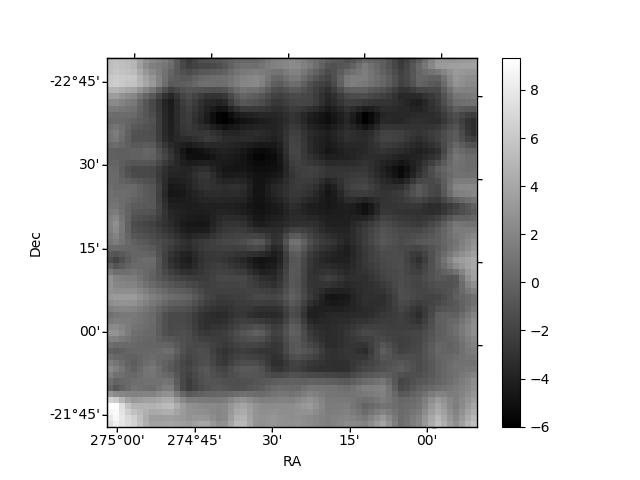
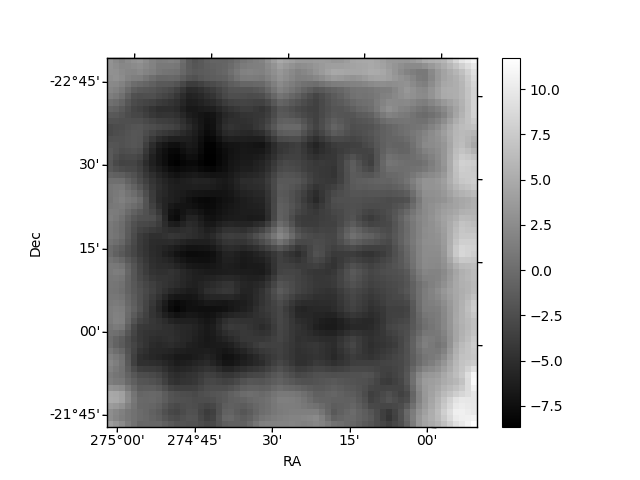
Histogram calculated using DETX and DETY for each event in the final _common_clean file
| Quadrant A | 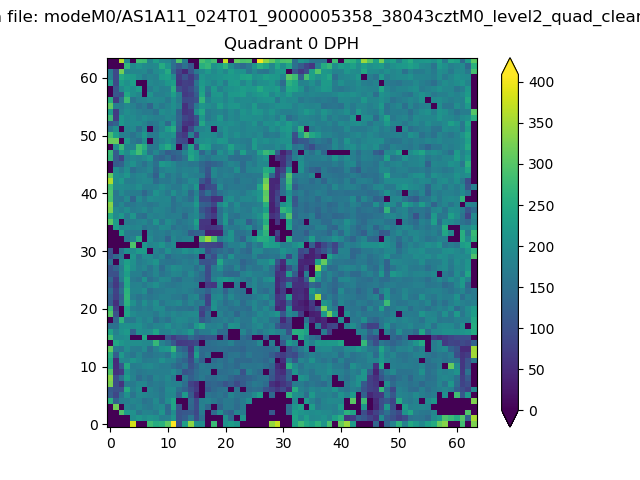 |
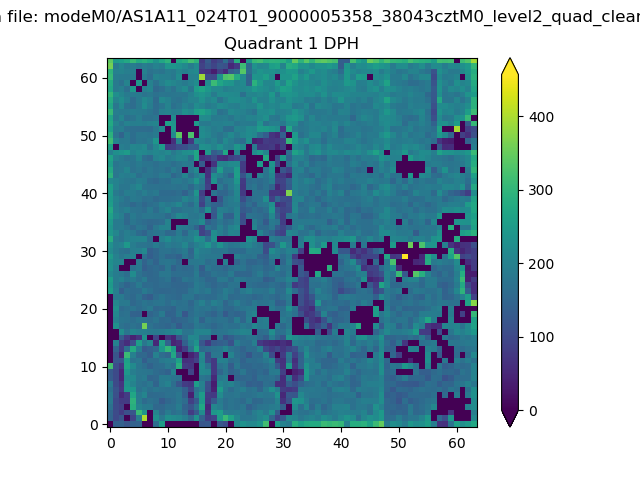 |
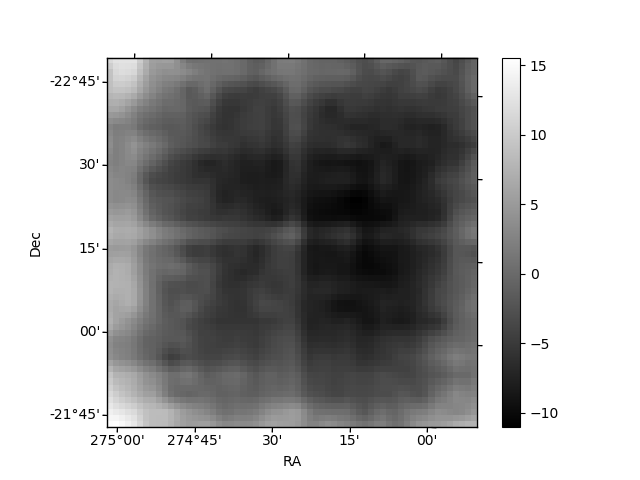
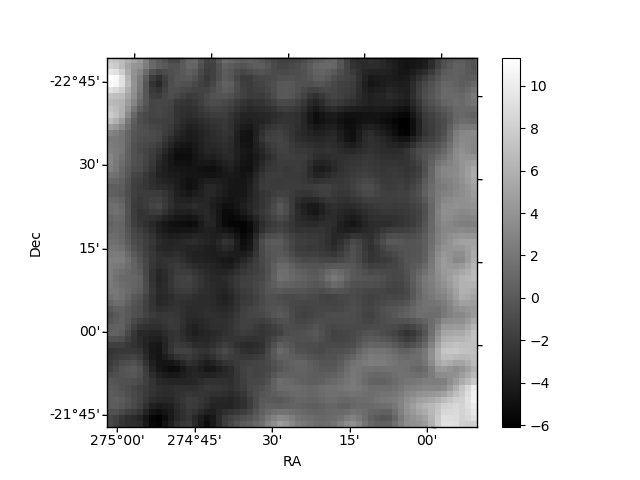
Quadrant B |
|---|---|---|---|
| Quadrant D | 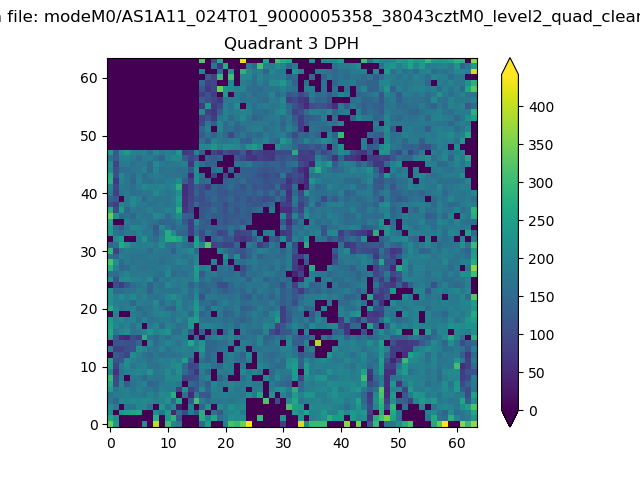 |
 |
Quadrant C |
| Plot type | Count rate plots | Images |
|---|---|---|
| Comparison with Poisson distribution Blue bars denote a histogram of data divided into 1 sec bins. Red curve is a Poisson curve with rate = median count rate of data. |
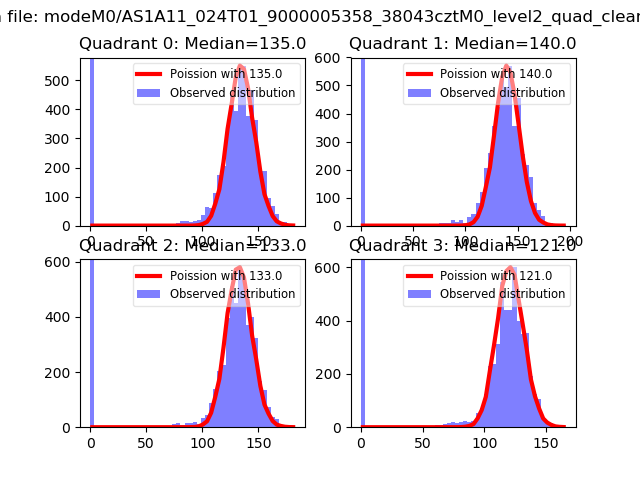 |
 |
| Quadrant-wise count rates Data is divided into 100 sec bins |
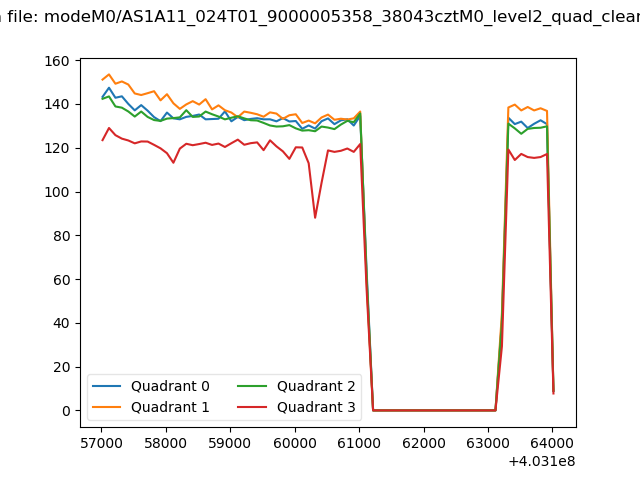 |
|
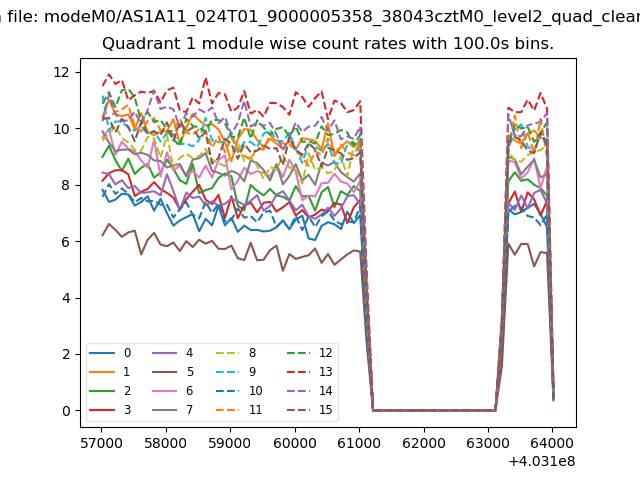
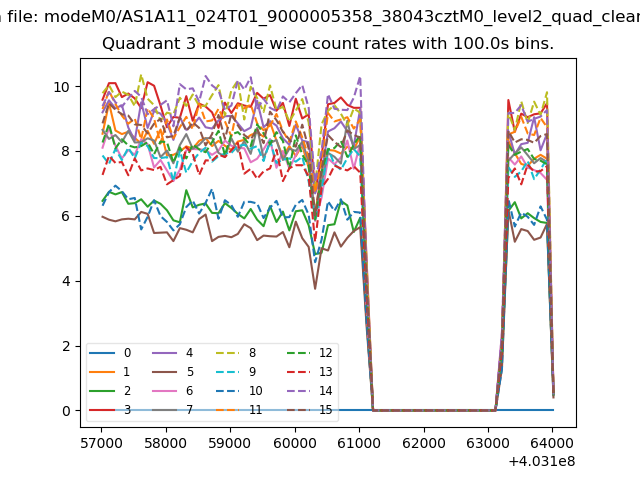
| Module-wise count rates for Quadrant A Data is divided into 100 sec bins |
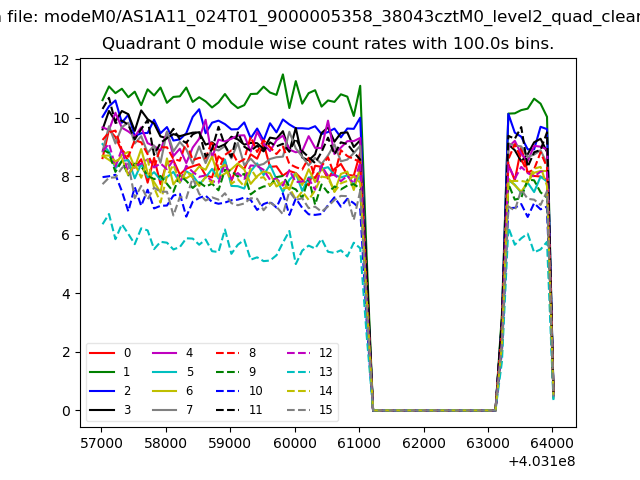 |
 |
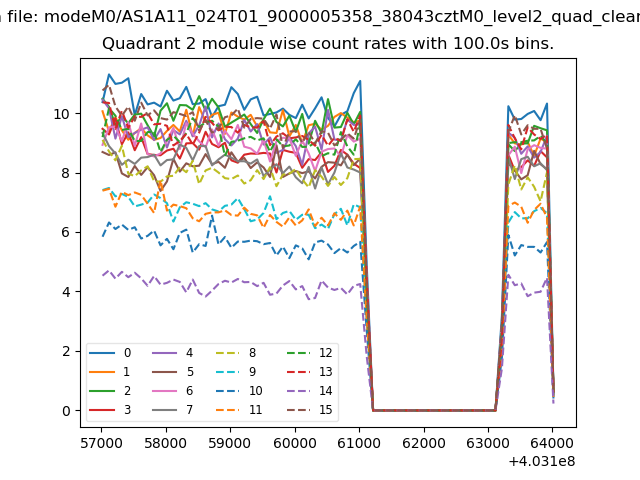
| Module-wise count rates for Quadrant B Data is divided into 100 sec bins |
 |
 |
| Module-wise count rates for Quadrant C Data is divided into 100 sec bins |
 |
 |
| Module-wise count rates for Quadrant D Data is divided into 100 sec bins |
 |
 |
| Parameter | Plot |
|---|---|
| CZT HV Monitor | 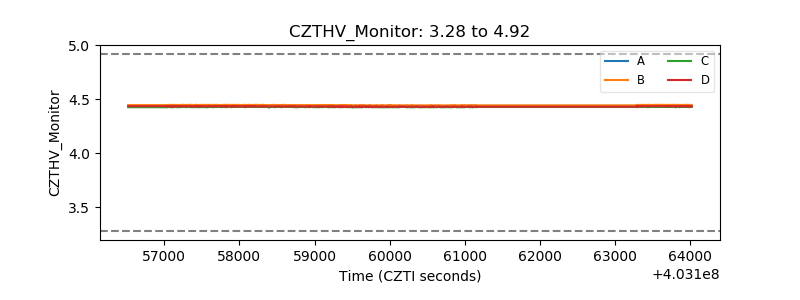 |
| D_VDD | 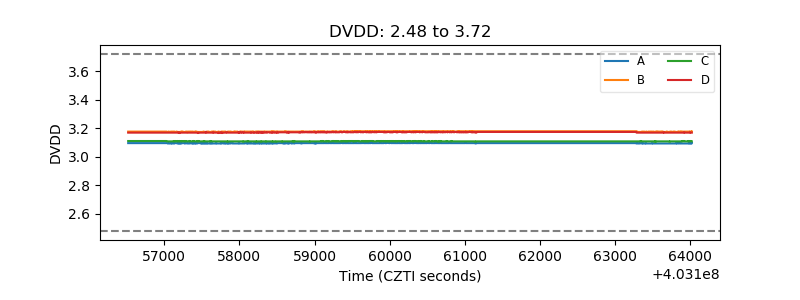 |
| Temperature 1 | 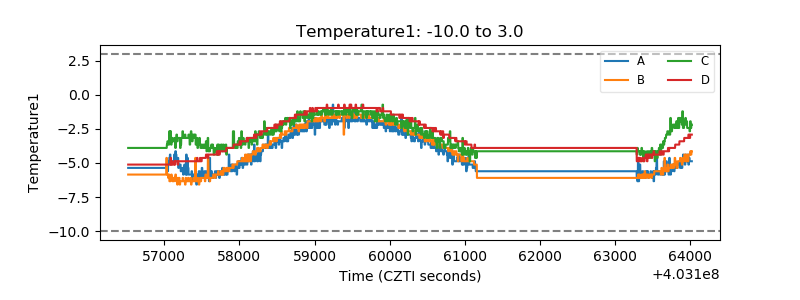 |
| Veto HV Monitor | 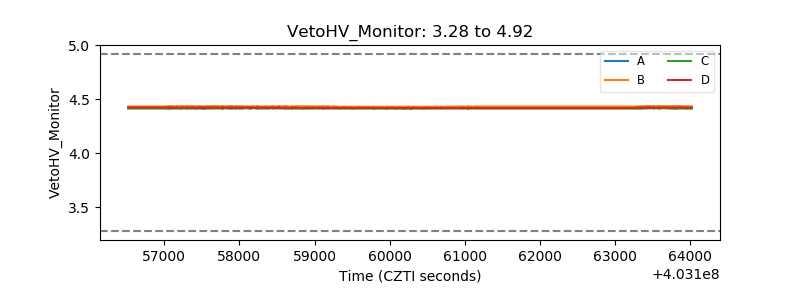 |
| Veto LLD | 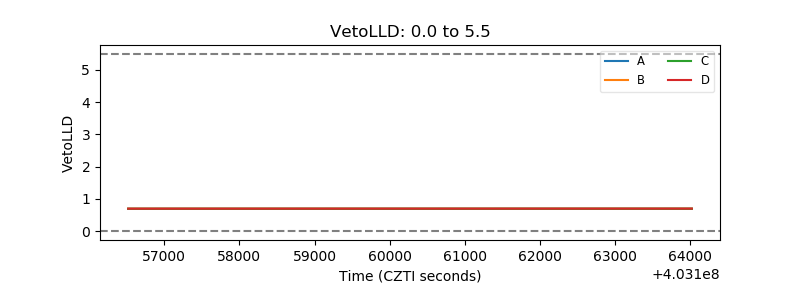 |
| Alpha Counter | 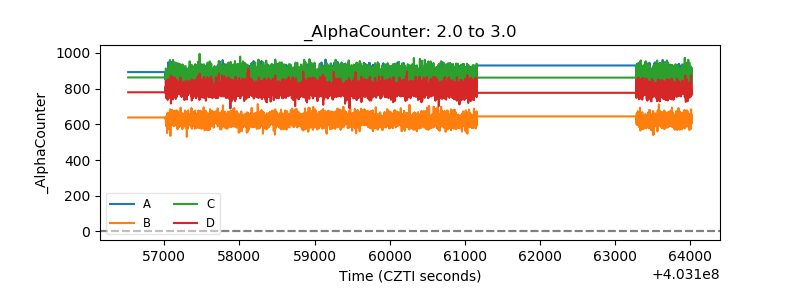 |
| _CPM_Rate | 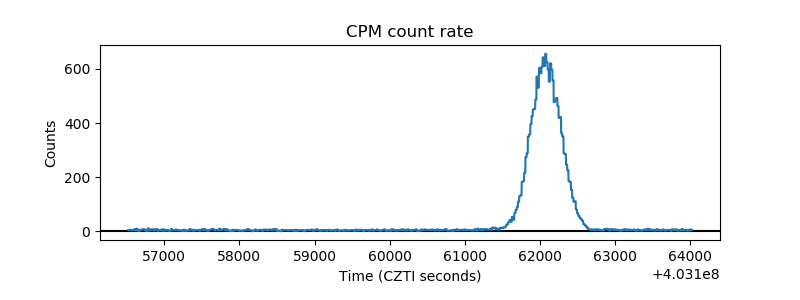 |
| CZT Counter | 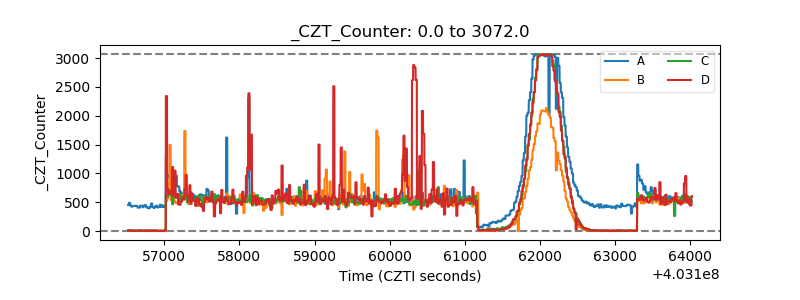 |
| +2.5 Volts monitor | 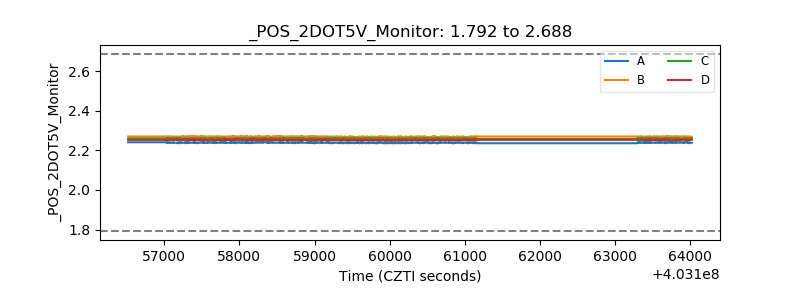 |
| +5 Volts monitor | 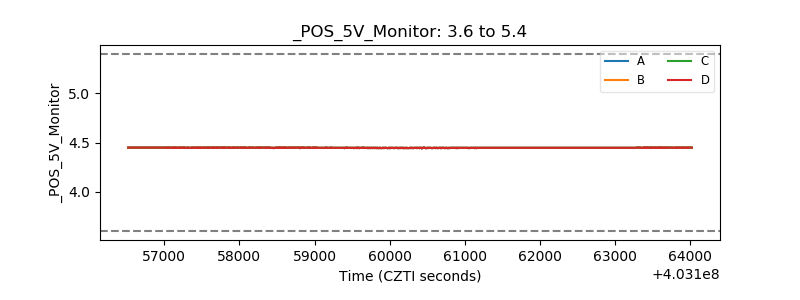 |
| _ROLL_ROT | 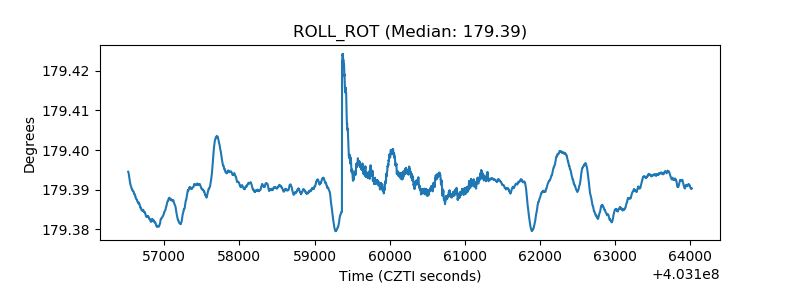 |
| _Roll_DEC | 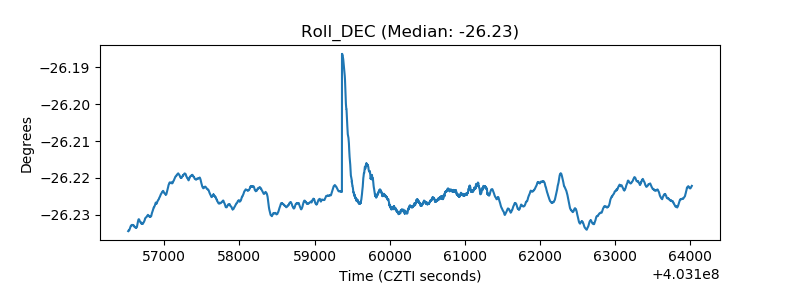 |
| _Roll_RA | 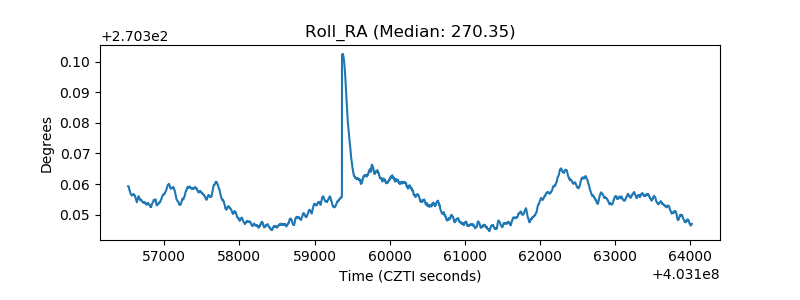 |
| Veto Counter | 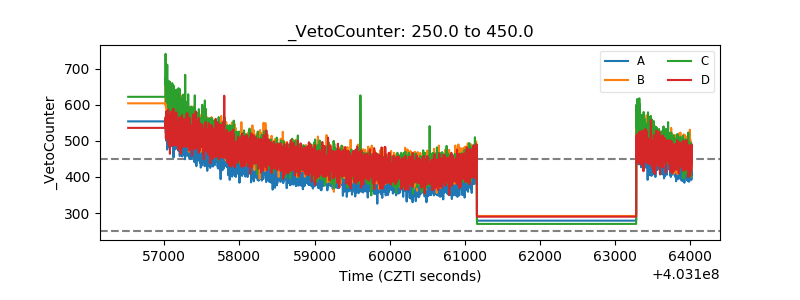 |