| Param | Original file | Final file |
|---|---|---|
| Filename | modeM0/AS1A11_024T01_9000005358_38044cztM0_level2.fits | modeM0/AS1A11_024T01_9000005358_38044cztM0_level2_quad_clean.evt |
| Size (bytes) | 68,411,520 | 18,336,960 |
| Size | 65.2 MB | 17.5 MB |
| Events in quadrant A | 676,543 | 117,959 |
| Events in quadrant B | 569,510 | 127,184 |
| Events in quadrant C | 601,145 | 118,003 |
| Events in quadrant D | 598,209 | 101,826 |
| Mode M9 | |||
|---|---|---|---|
| Quadrant | BADHDUFLAG | Total packets | Discarded packets |
| A | 0 | 28 | 10 |
| B | 0 | 26 | 3 |
| C | 0 | 23 | 5 |
| D | 0 | 27 | 7 |
| Mode SS | |||
|---|---|---|---|
| Quadrant | BADHDUFLAG | Total packets | Discarded packets |
| A | 0 | 140195035691048 | 140192027508782 |
| B | 0 | -1 | -1 |
| C | 0 | -1 | -1 |
| D | 0 | -1 | -1 |
| Mode M0 | |||
|---|---|---|---|
| Quadrant | BADHDUFLAG | Total packets | Discarded packets |
| A | 0 | 9035 | 6360 |
| B | 0 | 8873 | 6643 |
| C | 0 | 8469 | 6133 |
| D | 0 | 10417 | 8084 |
| Quadrant | Total seconds | Saturated seconds | Saturation percentage |
|---|---|---|---|
| A | 1069 | 12 | 1.122544% |
| B | 1087 | 4 | 0.367985% |
| C | 1087 | 5 | 0.459982% |
| D | 1034 | 15 | 1.450677% |
Noise dominated data is calculated using 1-second bins in cleaned event files. If a bin has >2000 counts, and if more than 50% of those come from <1% of pixels, then it is considered to be noise-dominated and hence unusable.
| Quadrant | # 1 sec bins | Bins with >0 counts | Bins with >2000 counts | High rate bins dominated by noise | Noise dominated (total time) | Noise dominated (detector-on time) | Marked lightcurve |
|---|---|---|---|---|---|---|---|
| A | 7086 | 1363 | 1 | 1 | 0.01% | 0.07% | 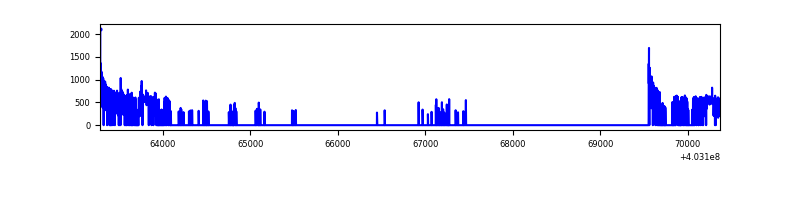 |
| B | 7084 | 1370 | 0 | 0 | 0.00% | 0.00% | 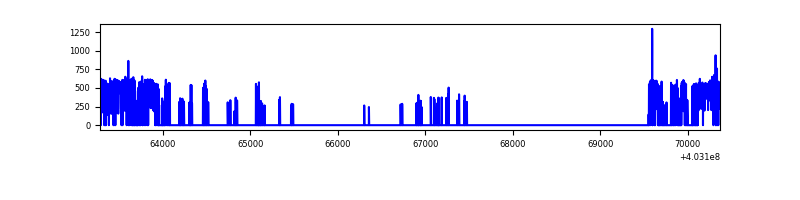 |
| C | 7086 | 1394 | 1 | 1 | 0.01% | 0.07% |  |
| D | 7086 | 1310 | 8 | 8 | 0.11% | 0.61% | 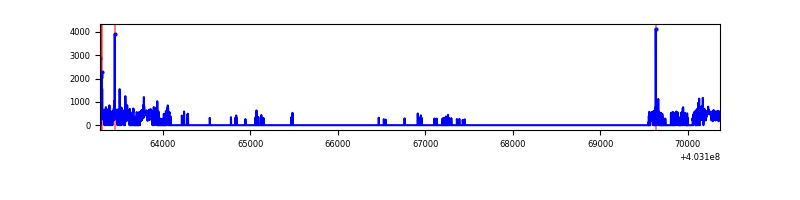 |
Top three noisy pixels from each quadrant. If the there are fewer than three noisy pixels in the level2.evt file, extra rows are filled as -1
| Pixel properties | Quadrant properties | ||||||
|---|---|---|---|---|---|---|---|
| Quadrant | DetID | PixID | Counts | Sigma | Mean | Median | Sigma |
| A | 10 | 83 | 135362 | 4573.31 | 137 | 134 | 29.6 |
| A | 9 | 143 | 3405 | 110.62 | 137 | 134 | 29.6 |
| A | 10 | 67 | 2672 | 85.83 | 137 | 134 | 29.6 |
| B | 12 | 18 | 4714 | 159.41 | 139 | 136 | 28.7 |
| B | 5 | 184 | 3775 | 126.72 | 139 | 136 | 28.7 |
| B | 12 | 111 | 3387 | 113.21 | 139 | 136 | 28.7 |
| C | 15 | 214 | 51541 | 1538.79 | 136 | 137 | 33.4 |
| C | 14 | 254 | 4818 | 140.13 | 136 | 137 | 33.4 |
| C | 0 | 10 | 4746 | 137.97 | 136 | 137 | 33.4 |
| D | 1 | 47 | 38298 | 1134.23 | 130 | 126 | 33.7 |
| D | 7 | 223 | 13522 | 398.04 | 130 | 126 | 33.7 |
| D | 13 | 249 | 11501 | 337.99 | 130 | 126 | 33.7 |
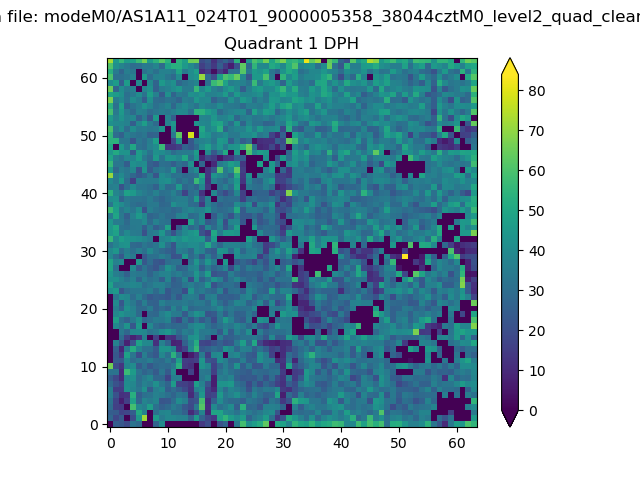
Histogram calculated using DETX and DETY for each event in the final _common_clean file
| Quadrant A | 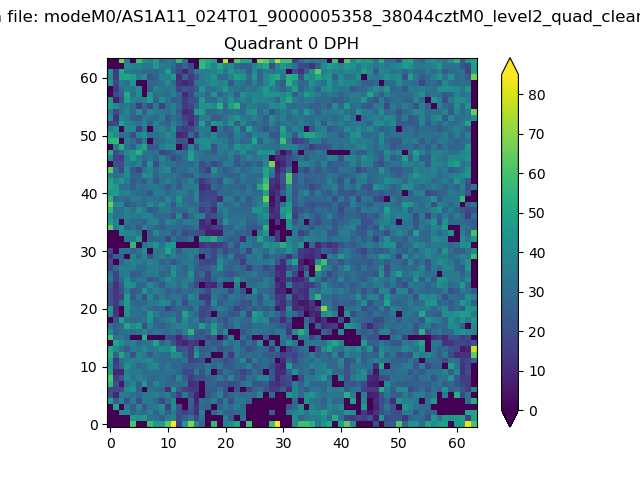 |
 |
Quadrant B |
|---|---|---|---|
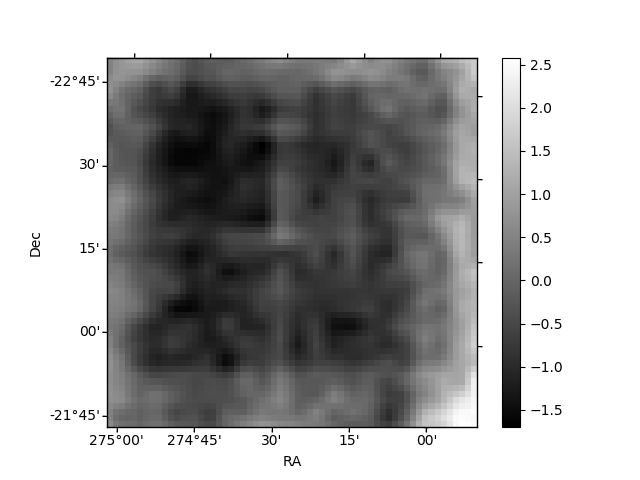
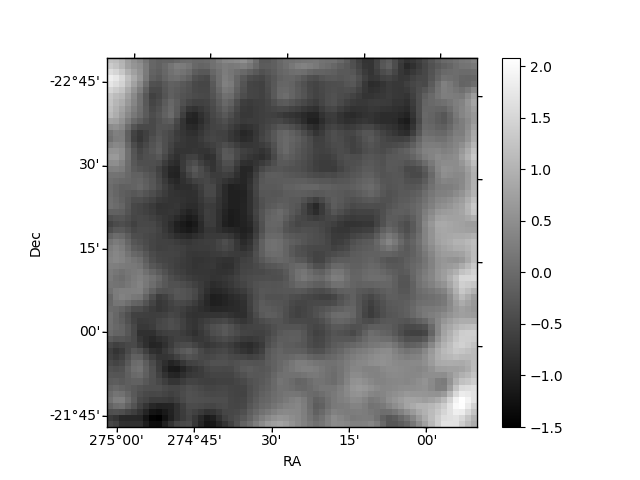
| Quadrant D | 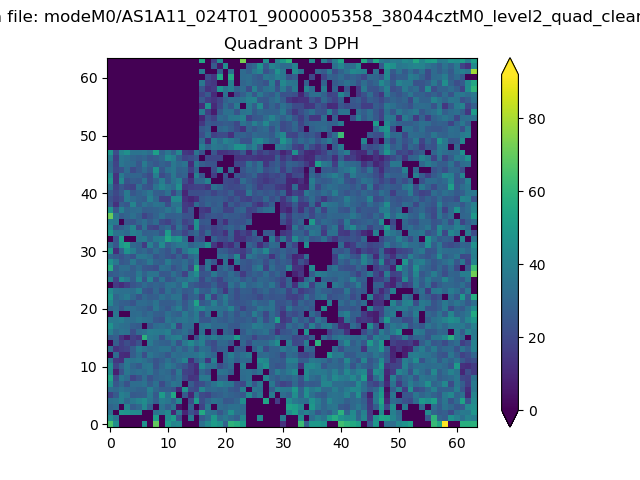 |
 |
Quadrant C |
| Plot type | Count rate plots | Images |
|---|---|---|
| Comparison with Poisson distribution Blue bars denote a histogram of data divided into 1 sec bins. Red curve is a Poisson curve with rate = median count rate of data. |
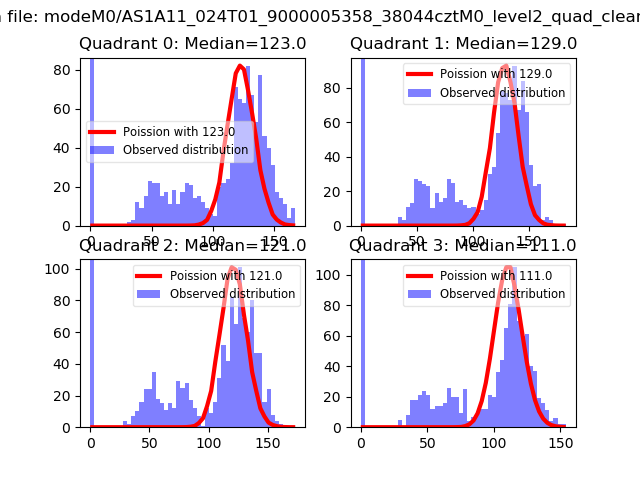 |
 |
| Quadrant-wise count rates Data is divided into 100 sec bins |
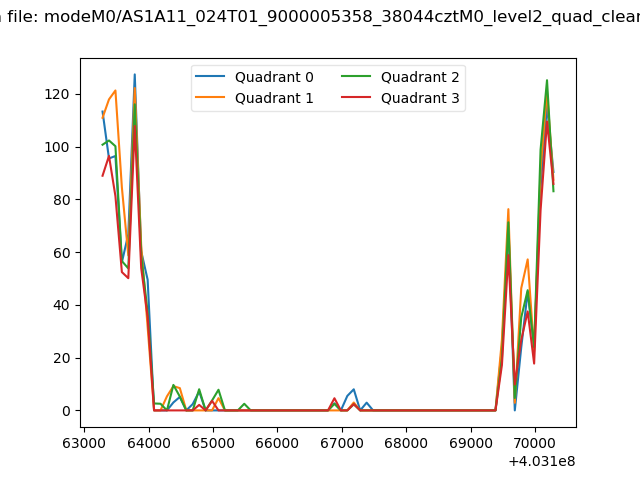 |
|
| Module-wise count rates for Quadrant A Data is divided into 100 sec bins |
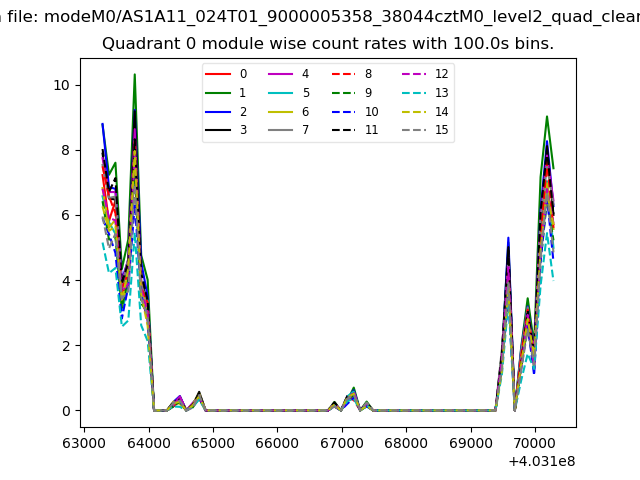 |
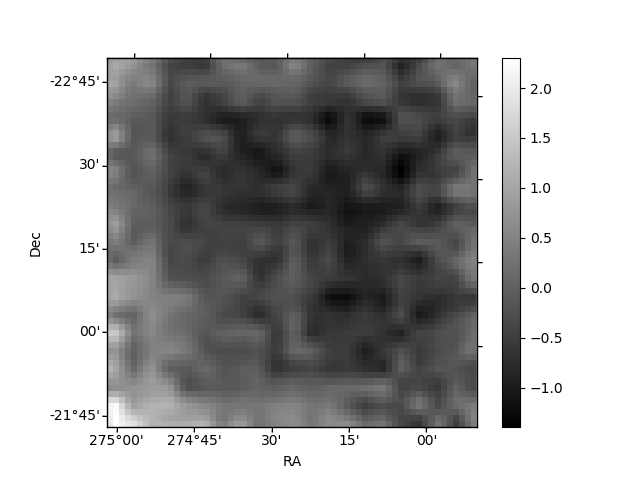 |
| Module-wise count rates for Quadrant B Data is divided into 100 sec bins |
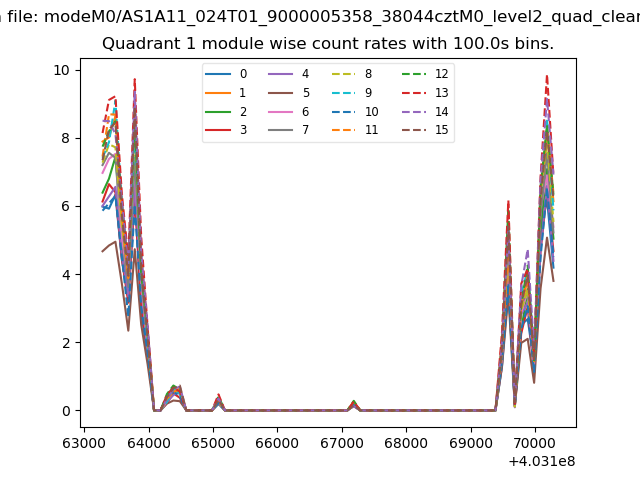 |
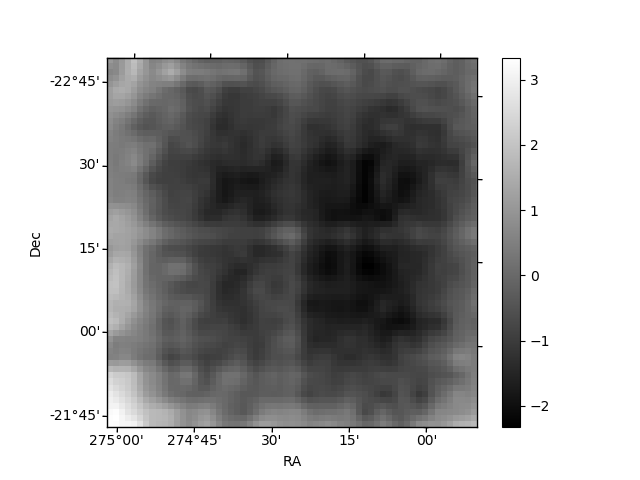 |
| Module-wise count rates for Quadrant C Data is divided into 100 sec bins |
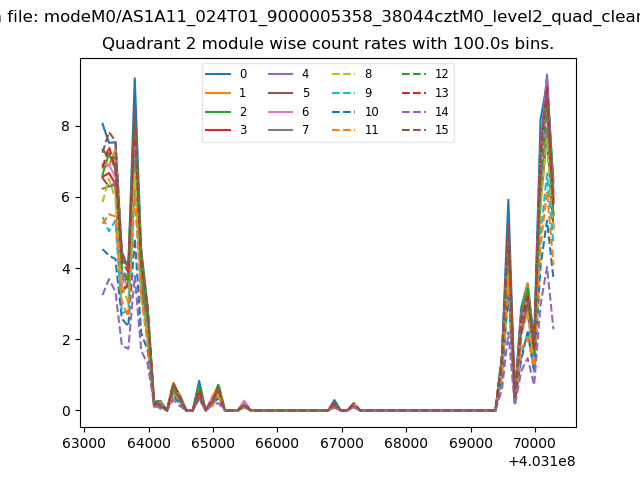 |
 |
| Module-wise count rates for Quadrant D Data is divided into 100 sec bins |
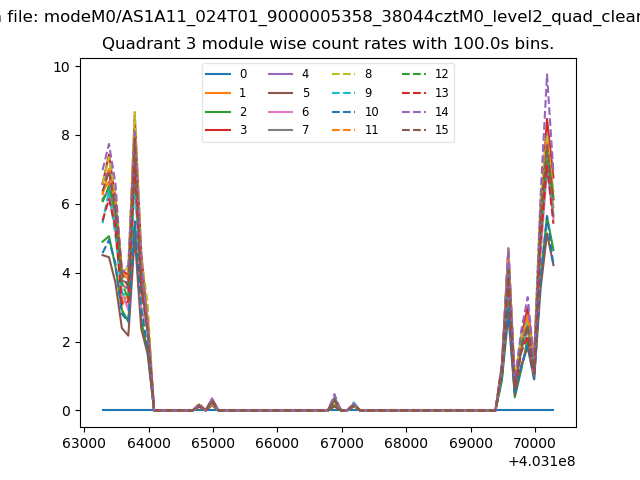 |
 |
| Parameter | Plot |
|---|---|
| CZT HV Monitor | 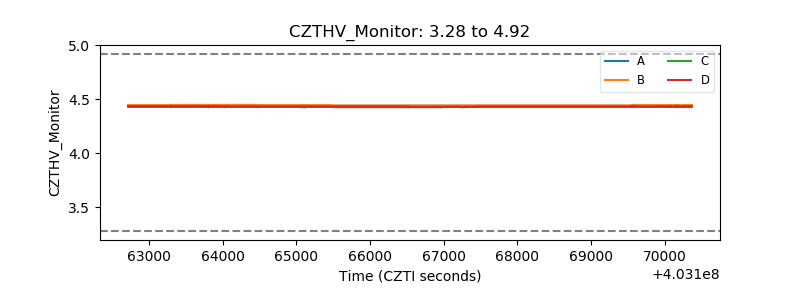 |
| D_VDD |  |
| Temperature 1 | 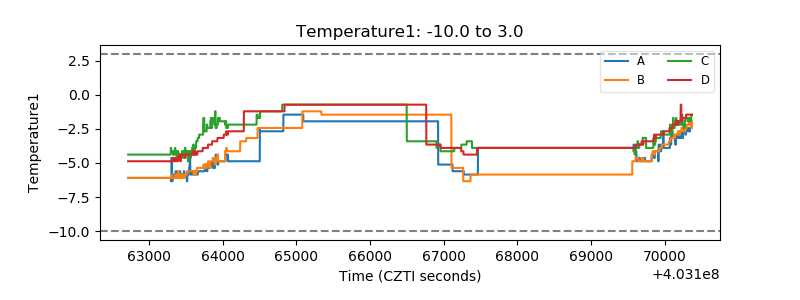 |
| Veto HV Monitor |  |
| Veto LLD | 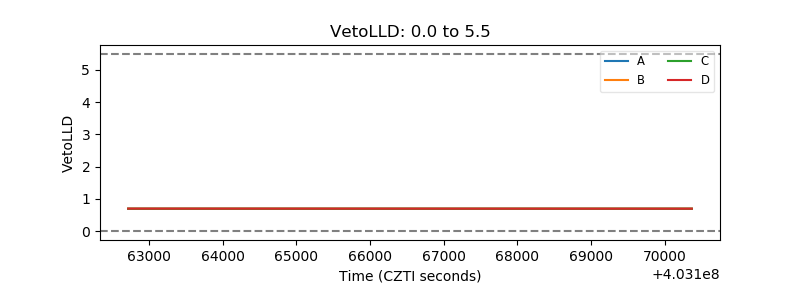 |
| Alpha Counter | 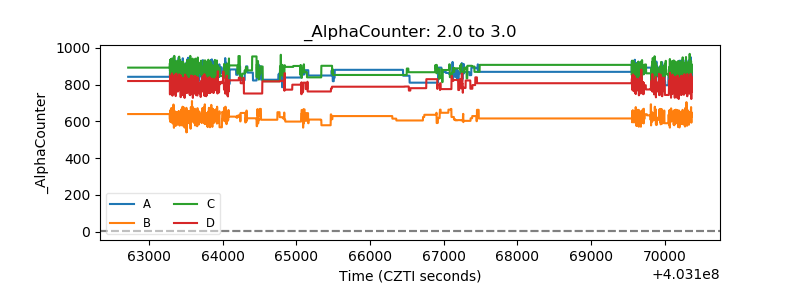 |
| _CPM_Rate | 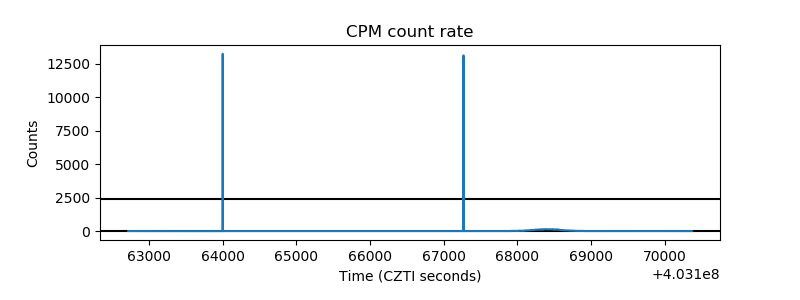 |
| CZT Counter |  |
| +2.5 Volts monitor | 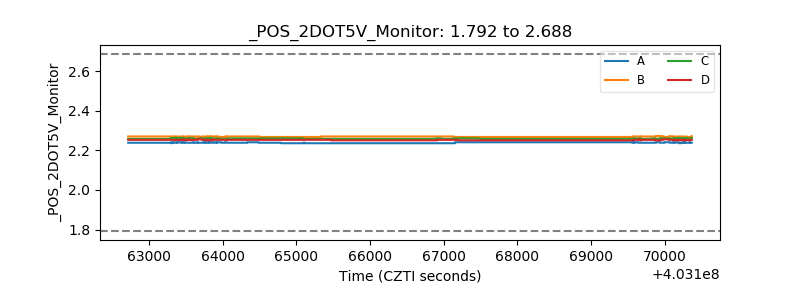 |
| +5 Volts monitor | 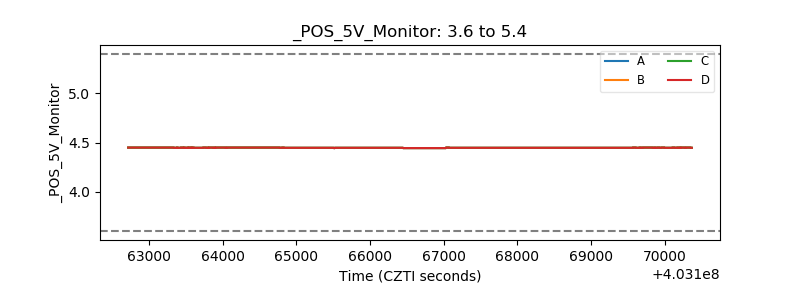 |
| _ROLL_ROT | 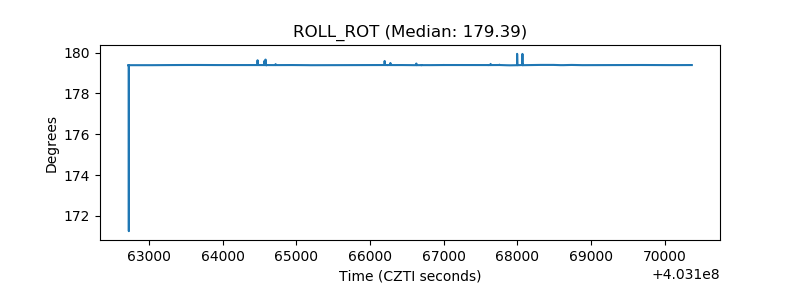 |
| _Roll_DEC | 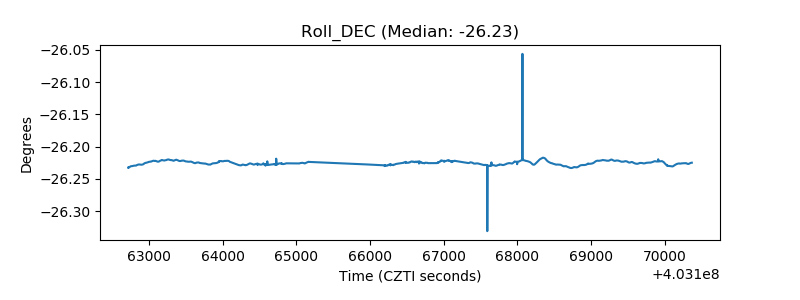 |
| _Roll_RA |  |
| Veto Counter | 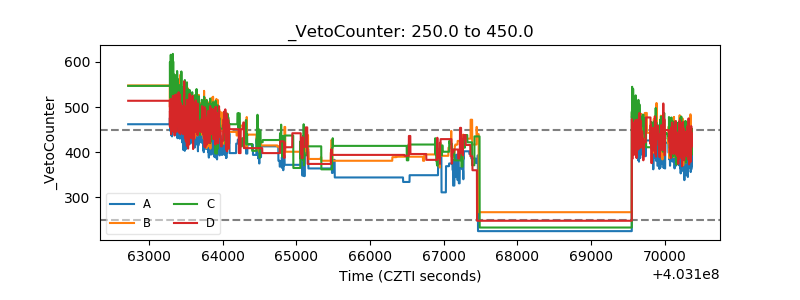 |