| Param | Original file | Final file |
|---|---|---|
| Filename | modeM0/AS1A11_024T01_9000005358_38045cztM0_level2.fits | modeM0/AS1A11_024T01_9000005358_38045cztM0_level2_quad_clean.evt |
| Size (bytes) | 604,661,760 | 174,075,840 |
| Size | 576.7 MB | 166.0 MB |
| Events in quadrant A | 5,153,948 | 1,184,693 |
| Events in quadrant B | 5,240,719 | 1,205,258 |
| Events in quadrant C | 4,888,015 | 1,172,772 |
| Events in quadrant D | 6,360,953 | 1,048,455 |
| Mode M9 | |||
|---|---|---|---|
| Quadrant | BADHDUFLAG | Total packets | Discarded packets |
| A | 0 | 45 | 0 |
| B | 0 | 45 | 0 |
| C | 0 | 45 | 0 |
| D | 0 | 46 | 0 |
| Mode SS | |||
|---|---|---|---|
| Quadrant | BADHDUFLAG | Total packets | Discarded packets |
| A | 0 | 192 | 0 |
| B | 0 | 192 | 0 |
| C | 0 | 192 | 0 |
| D | 0 | 192 | 0 |
| Mode M0 | |||
|---|---|---|---|
| Quadrant | BADHDUFLAG | Total packets | Discarded packets |
| A | 0 | 20666 | 4 |
| B | 0 | 21208 | 3 |
| C | 0 | 19791 | 3 |
| D | 0 | 24722 | 3 |
| Quadrant | Total seconds | Saturated seconds | Saturation percentage |
|---|---|---|---|
| A | 9528 | 25 | 0.262385% |
| B | 9528 | 150 | 1.574307% |
| C | 9528 | 9 | 0.094458% |
| D | 9528 | 296 | 3.106633% |
Noise dominated data is calculated using 1-second bins in cleaned event files. If a bin has >2000 counts, and if more than 50% of those come from <1% of pixels, then it is considered to be noise-dominated and hence unusable.
| Quadrant | # 1 sec bins | Bins with >0 counts | Bins with >2000 counts | High rate bins dominated by noise | Noise dominated (total time) | Noise dominated (detector-on time) | Marked lightcurve |
|---|---|---|---|---|---|---|---|
| A | 13413 | 9530 | 4 | 4 | 0.03% | 0.04% | 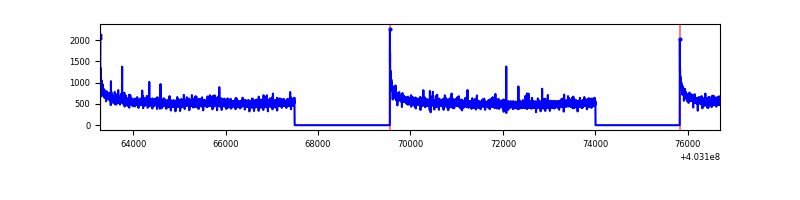 |
| B | 13413 | 9530 | 105 | 105 | 0.78% | 1.10% | 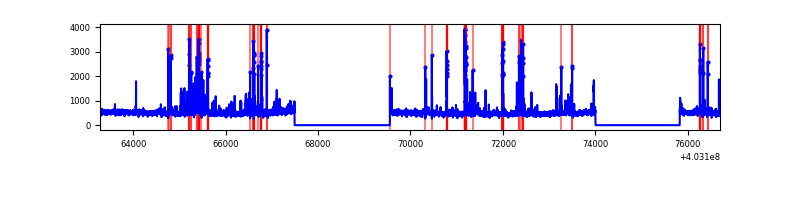 |
| C | 13413 | 9530 | 5 | 5 | 0.04% | 0.05% | 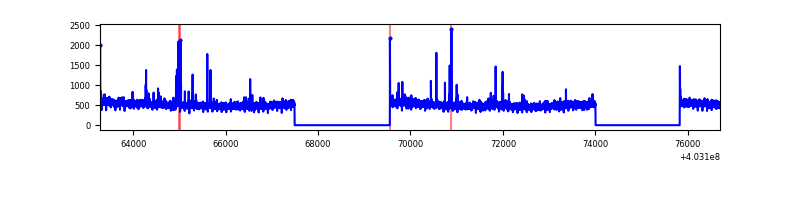 |
| D | 13413 | 9530 | 261 | 261 | 1.95% | 2.74% | 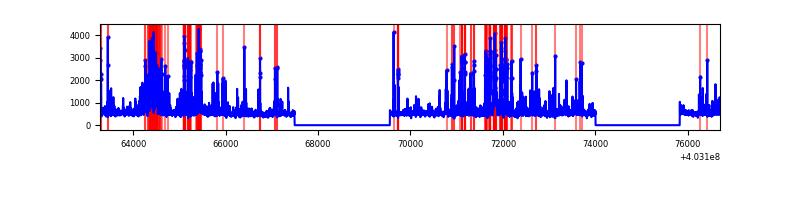 |
Top three noisy pixels from each quadrant. If the there are fewer than three noisy pixels in the level2.evt file, extra rows are filled as -1
| Pixel properties | Quadrant properties | ||||||
|---|---|---|---|---|---|---|---|
| Quadrant | DetID | PixID | Counts | Sigma | Mean | Median | Sigma |
| A | 10 | 83 | 646710 | 2795.13 | 1145 | 1125 | 231.0 |
| A | 12 | 16 | 33594 | 140.58 | 1145 | 1125 | 231.0 |
| A | 13 | 6 | 20609 | 84.36 | 1145 | 1125 | 231.0 |
| B | 5 | 255 | 220799 | 1015.29 | 1132 | 1105 | 216.4 |
| B | 5 | 172 | 146515 | 671.99 | 1132 | 1105 | 216.4 |
| B | 5 | 184 | 89098 | 406.65 | 1132 | 1105 | 216.4 |
| C | 15 | 214 | 409713 | 1583.7 | 1107 | 1115 | 258.0 |
| C | 1 | 23 | 67023 | 255.45 | 1107 | 1115 | 258.0 |
| C | 3 | 233 | 49469 | 187.42 | 1107 | 1115 | 258.0 |
| D | 10 | 199 | 513310 | 1892.53 | 1100 | 1071 | 270.7 |
| D | 12 | 227 | 361511 | 1331.69 | 1100 | 1071 | 270.7 |
| D | 1 | 52 | 319777 | 1177.5 | 1100 | 1071 | 270.7 |
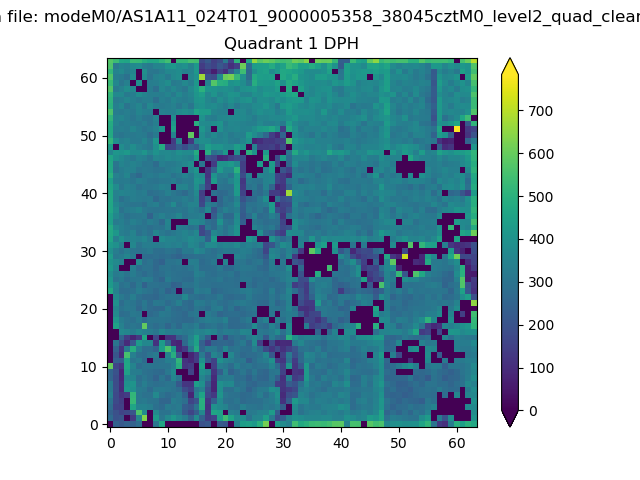
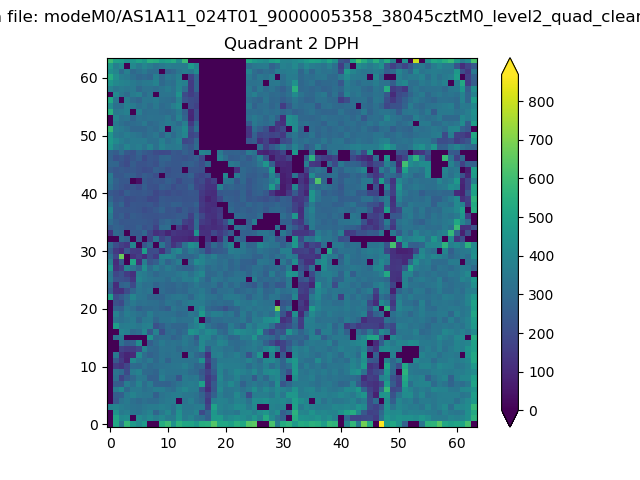
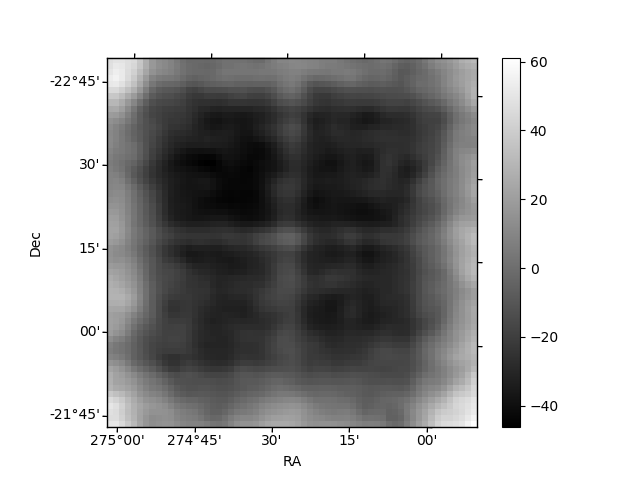
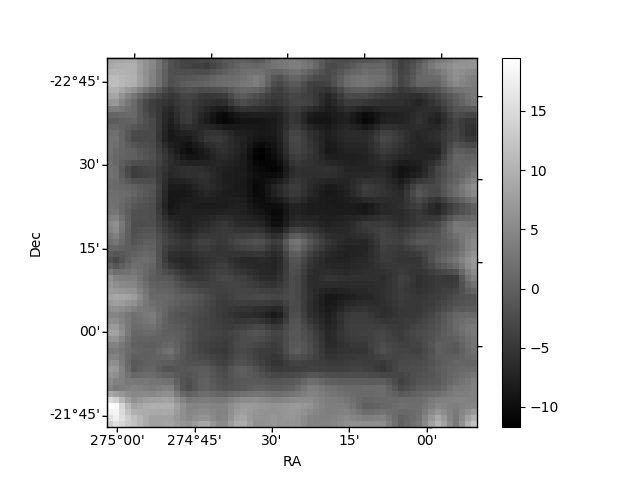
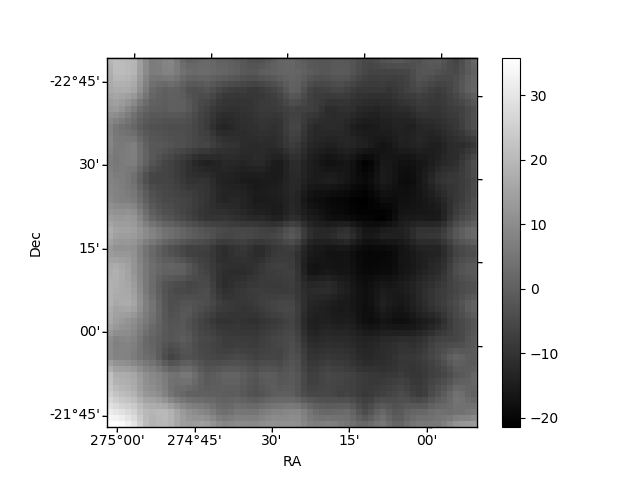
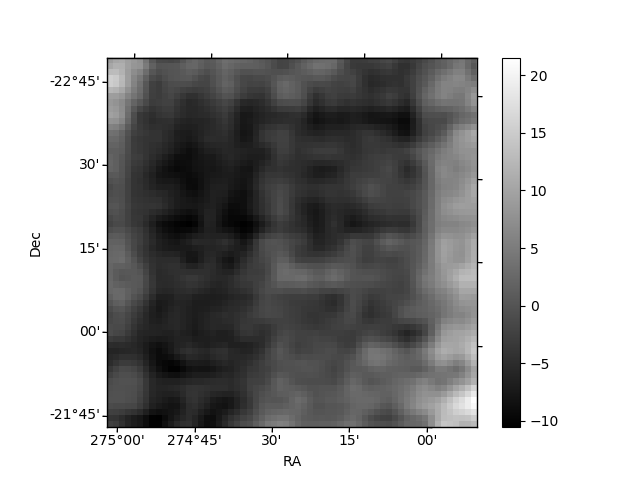
Histogram calculated using DETX and DETY for each event in the final _common_clean file
| Quadrant A |  |
 |
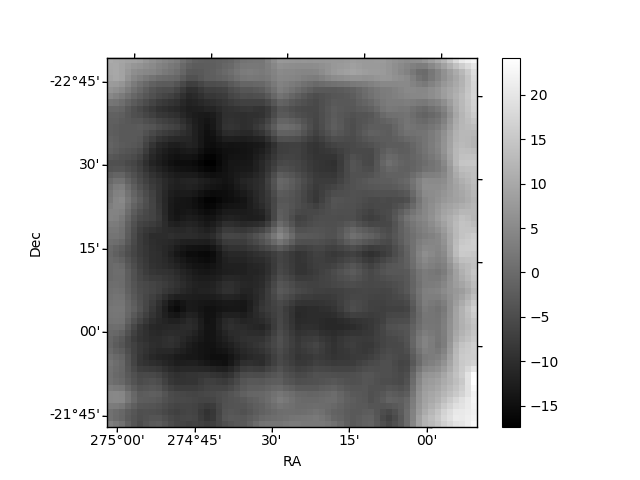
Quadrant B |
|---|---|---|---|
| Quadrant D | 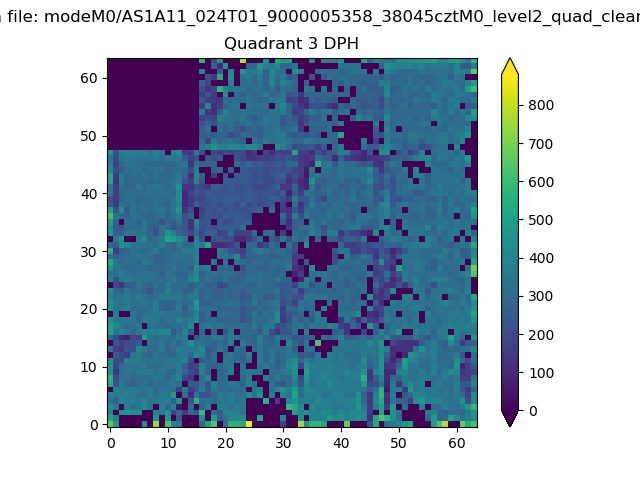 |
 |
Quadrant C |
| Plot type | Count rate plots | Images |
|---|---|---|
| Comparison with Poisson distribution Blue bars denote a histogram of data divided into 1 sec bins. Red curve is a Poisson curve with rate = median count rate of data. |
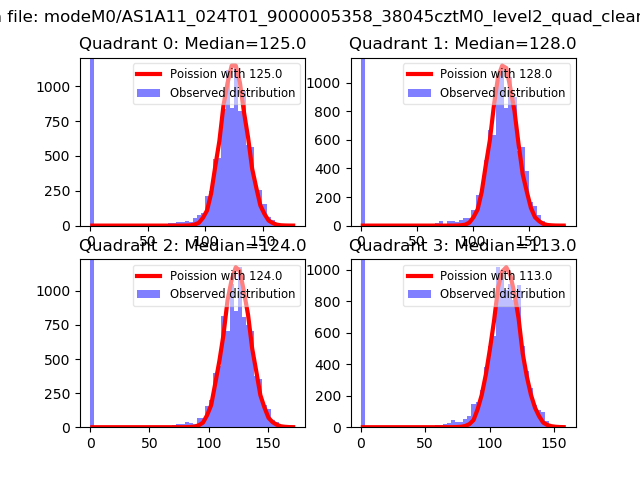 |
 |
| Quadrant-wise count rates Data is divided into 100 sec bins |
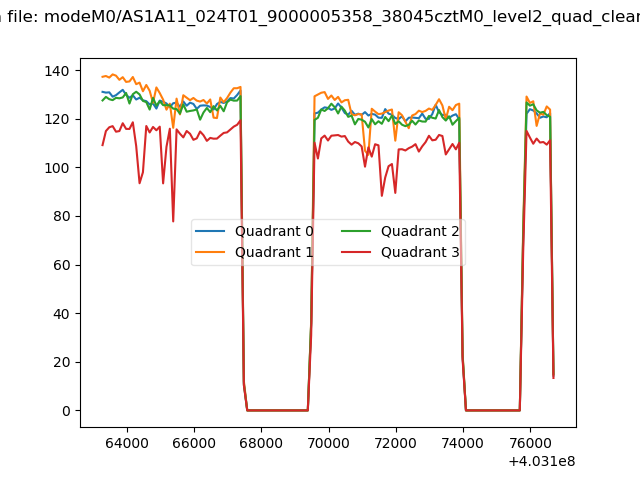 |
|
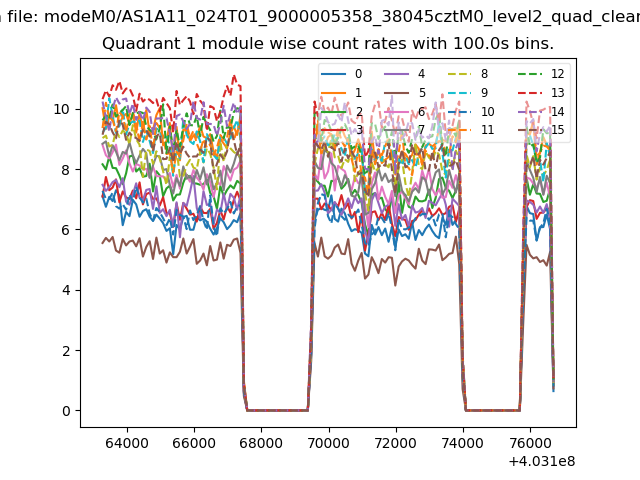
| Module-wise count rates for Quadrant A Data is divided into 100 sec bins |
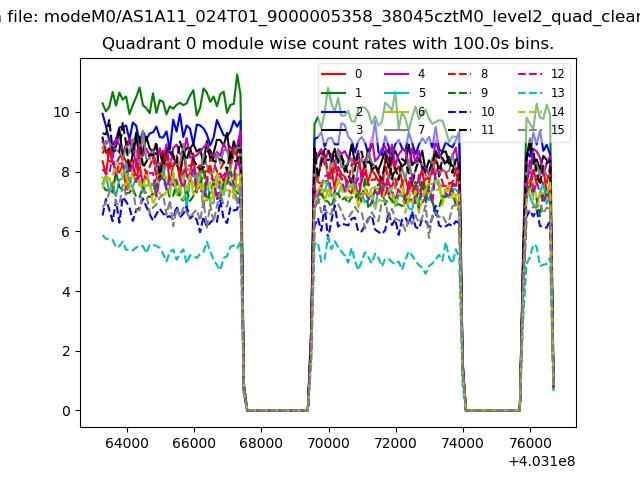 |
 |
| Module-wise count rates for Quadrant B Data is divided into 100 sec bins |
 |
 |
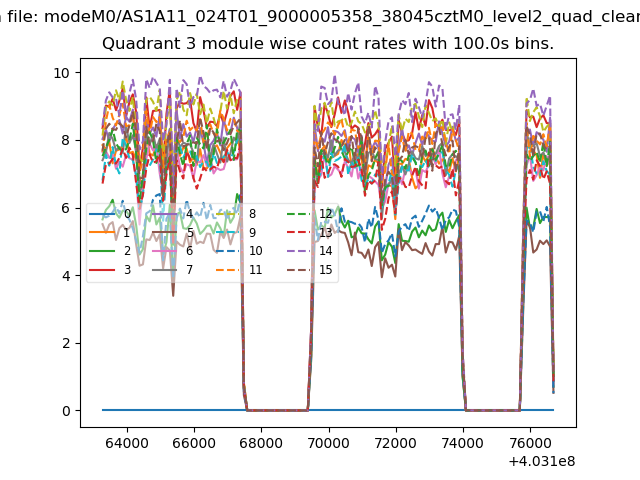
| Module-wise count rates for Quadrant C Data is divided into 100 sec bins |
 |
 |
| Module-wise count rates for Quadrant D Data is divided into 100 sec bins |
 |
 |
| Parameter | Plot |
|---|---|
| CZT HV Monitor | 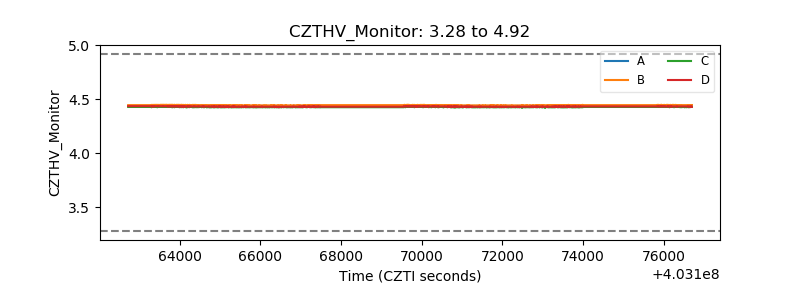 |
| D_VDD | 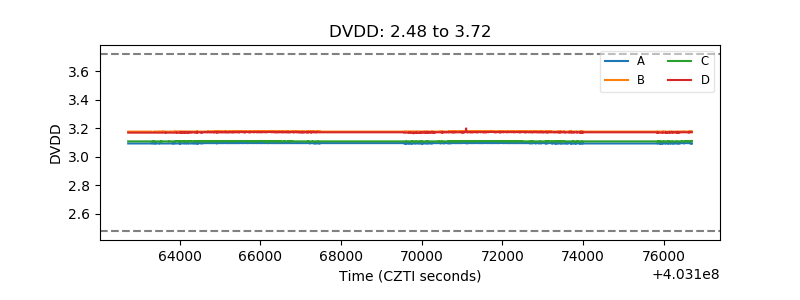 |
| Temperature 1 | 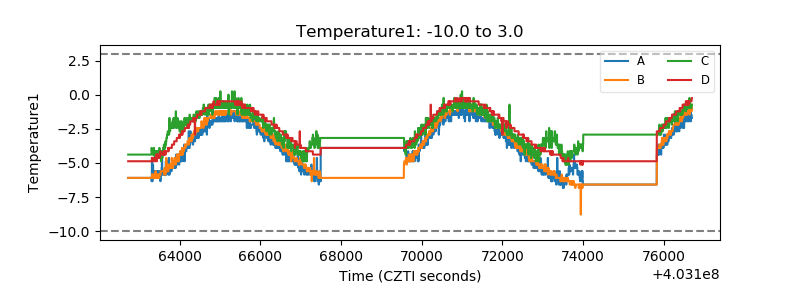 |
| Veto HV Monitor |  |
| Veto LLD | 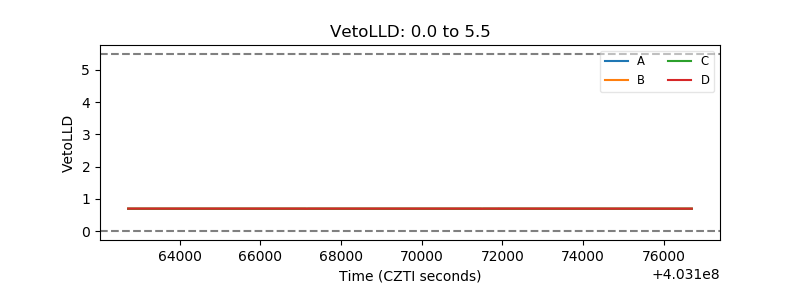 |
| Alpha Counter | 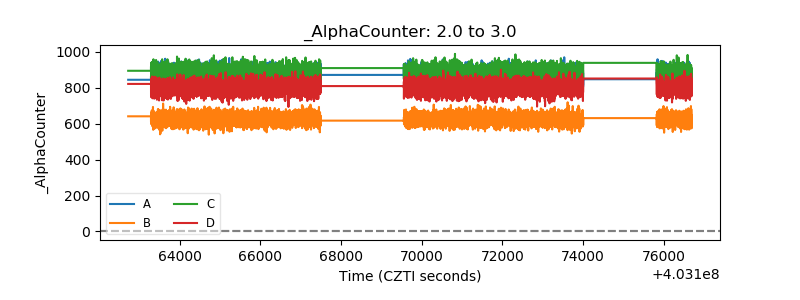 |
| _CPM_Rate | 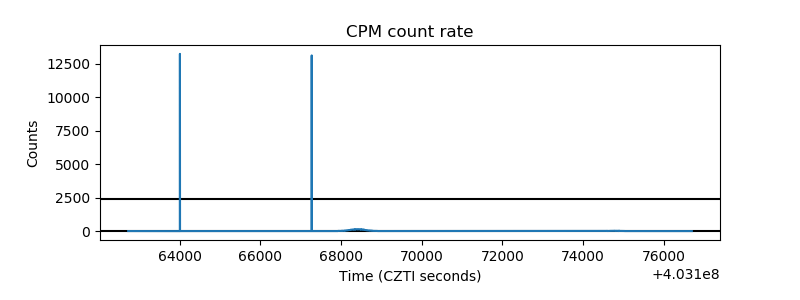 |
| CZT Counter | 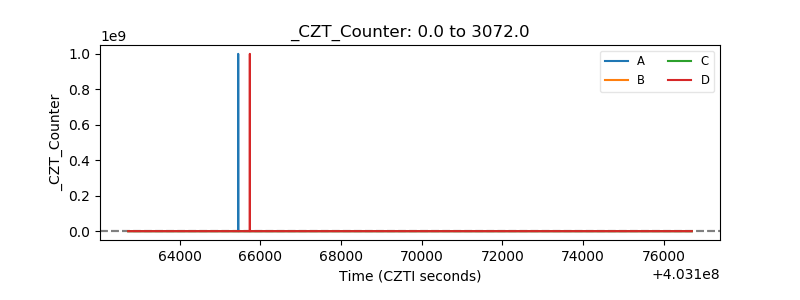 |
| +2.5 Volts monitor | 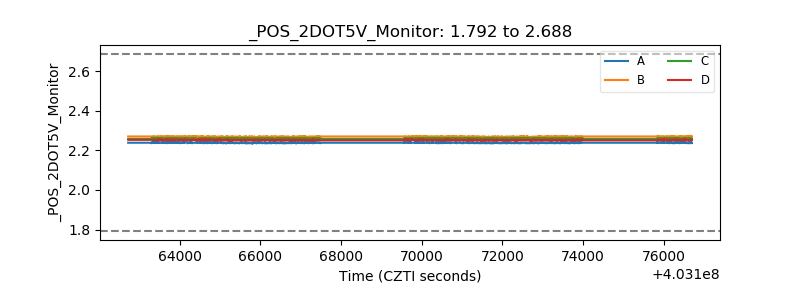 |
| +5 Volts monitor | 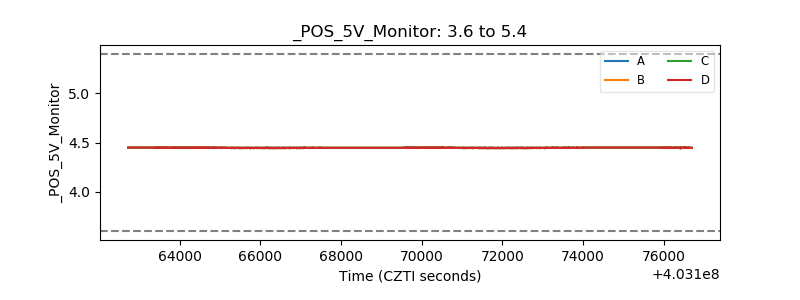 |
| _ROLL_ROT | 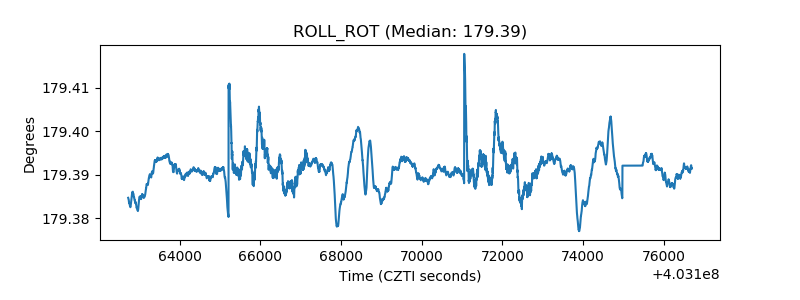 |
| _Roll_DEC | 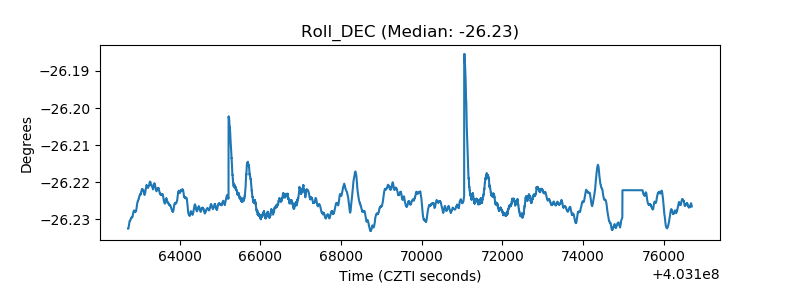 |
| _Roll_RA | 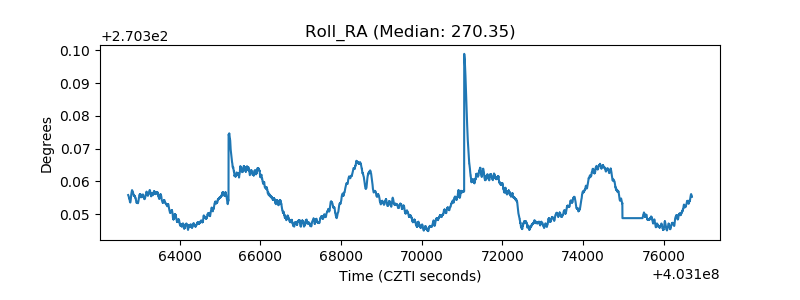 |
| Veto Counter | 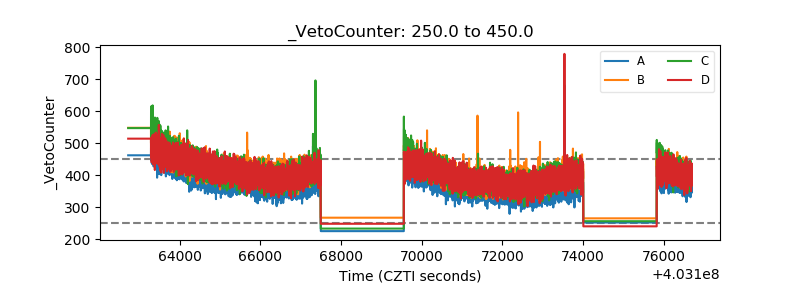 |