| Param | Original file | Final file |
|---|---|---|
| Filename | modeM0/AS1A11_024T01_9000005358_38046cztM0_level2.fits | modeM0/AS1A11_024T01_9000005358_38046cztM0_level2_quad_clean.evt |
| Size (bytes) | 358,041,600 | 99,740,160 |
| Size | 341.5 MB | 95.1 MB |
| Events in quadrant A | 3,043,206 | 676,299 |
| Events in quadrant B | 3,527,579 | 676,455 |
| Events in quadrant C | 2,815,259 | 667,284 |
| Events in quadrant D | 3,425,740 | 603,646 |
| Mode M9 | |||
|---|---|---|---|
| Quadrant | BADHDUFLAG | Total packets | Discarded packets |
| A | 0 | 17 | 0 |
| B | 0 | 17 | 0 |
| C | 0 | 17 | 0 |
| D | 0 | 18 | 0 |
| Mode SS | |||
|---|---|---|---|
| Quadrant | BADHDUFLAG | Total packets | Discarded packets |
| A | 0 | 114 | 0 |
| B | 0 | 114 | 0 |
| C | 0 | 114 | 0 |
| D | 0 | 114 | 0 |
| Mode M0 | |||
|---|---|---|---|
| Quadrant | BADHDUFLAG | Total packets | Discarded packets |
| A | 0 | 12379 | 3 |
| B | 0 | 14068 | 2 |
| C | 0 | 11641 | 2 |
| D | 0 | 13683 | 2 |
| Quadrant | Total seconds | Saturated seconds | Saturation percentage |
|---|---|---|---|
| A | 5673 | 10 | 0.176274% |
| B | 5673 | 185 | 3.261061% |
| C | 5673 | 6 | 0.105764% |
| D | 5673 | 108 | 1.903755% |
Noise dominated data is calculated using 1-second bins in cleaned event files. If a bin has >2000 counts, and if more than 50% of those come from <1% of pixels, then it is considered to be noise-dominated and hence unusable.
| Quadrant | # 1 sec bins | Bins with >0 counts | Bins with >2000 counts | High rate bins dominated by noise | Noise dominated (total time) | Noise dominated (detector-on time) | Marked lightcurve |
|---|---|---|---|---|---|---|---|
| A | 7166 | 5674 | 2 | 2 | 0.03% | 0.04% | 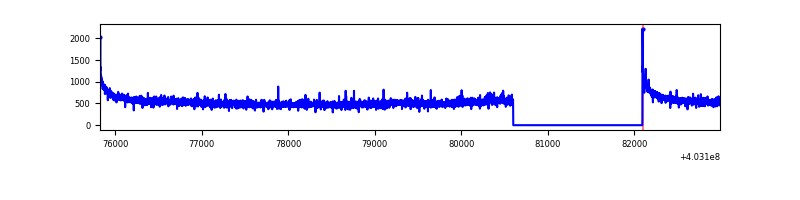 |
| B | 7166 | 5674 | 135 | 135 | 1.88% | 2.38% | 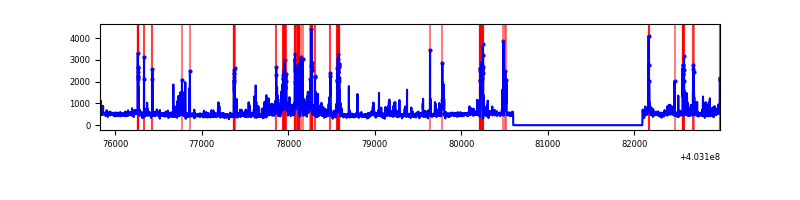 |
| C | 7166 | 5674 | 2 | 2 | 0.03% | 0.04% | 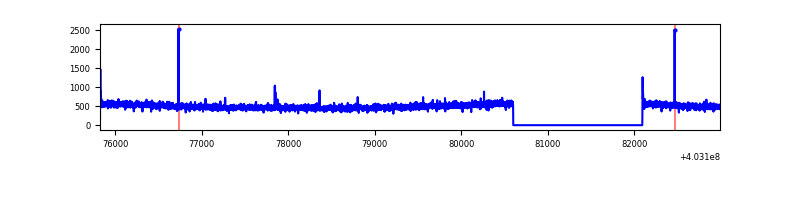 |
| D | 7166 | 5674 | 83 | 83 | 1.16% | 1.46% | 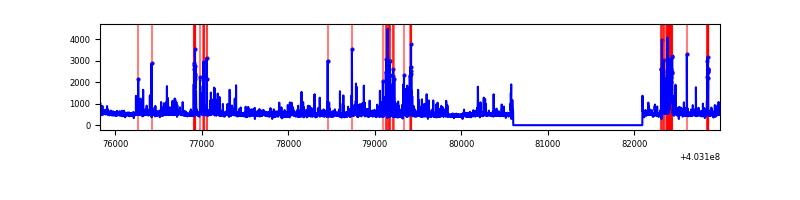 |
Top three noisy pixels from each quadrant. If the there are fewer than three noisy pixels in the level2.evt file, extra rows are filled as -1
| Pixel properties | Quadrant properties | ||||||
|---|---|---|---|---|---|---|---|
| Quadrant | DetID | PixID | Counts | Sigma | Mean | Median | Sigma |
| A | 10 | 83 | 403061 | 2965.69 | 665 | 653 | 135.7 |
| A | 12 | 16 | 22997 | 164.67 | 665 | 653 | 135.7 |
| A | 13 | 6 | 19408 | 138.22 | 665 | 653 | 135.7 |
| B | 5 | 172 | 249912 | 1959.42 | 655 | 637 | 127.2 |
| B | 5 | 184 | 193674 | 1517.36 | 655 | 637 | 127.2 |
| B | 4 | 171 | 180783 | 1416.03 | 655 | 637 | 127.2 |
| C | 15 | 214 | 242006 | 1583.37 | 645 | 651 | 152.4 |
| C | 3 | 233 | 28928 | 185.51 | 645 | 651 | 152.4 |
| C | 1 | 23 | 13340 | 83.24 | 645 | 651 | 152.4 |
| D | 1 | 52 | 283862 | 1790.23 | 641 | 625 | 158.2 |
| D | 10 | 199 | 198419 | 1250.18 | 641 | 625 | 158.2 |
| D | 13 | 249 | 123527 | 776.82 | 641 | 625 | 158.2 |
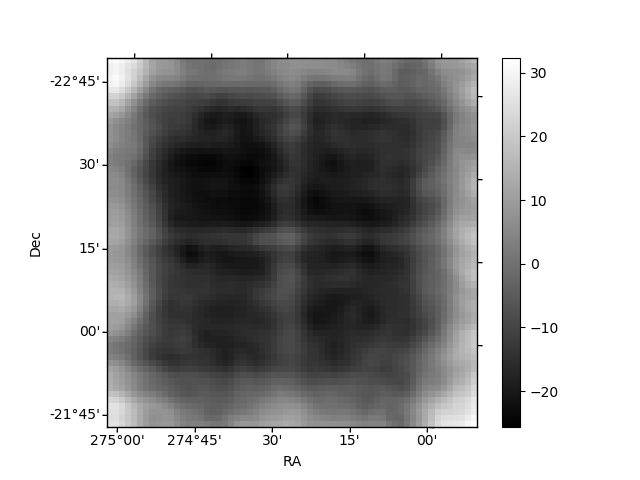
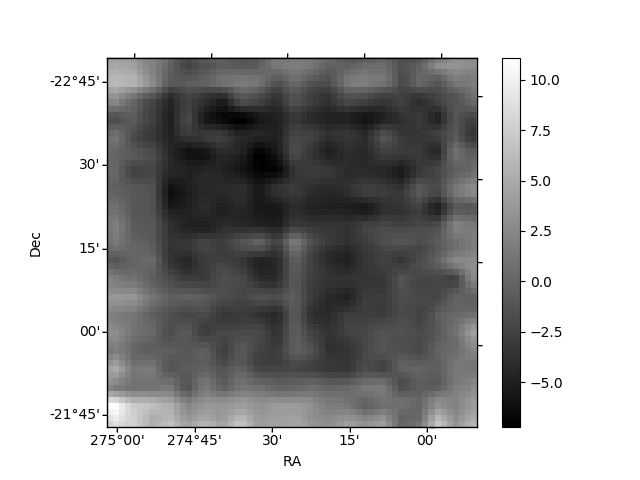
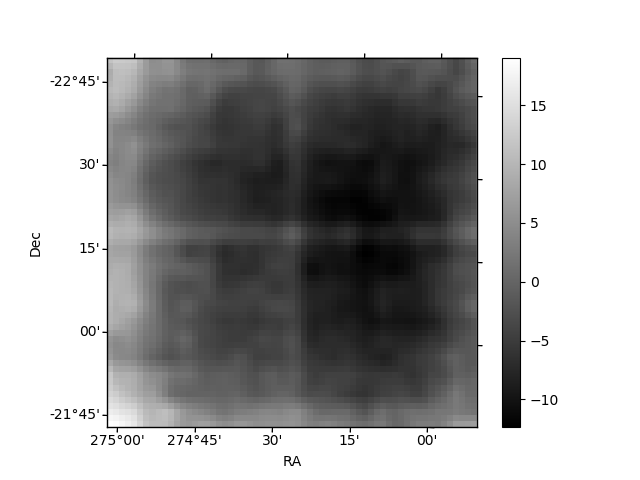
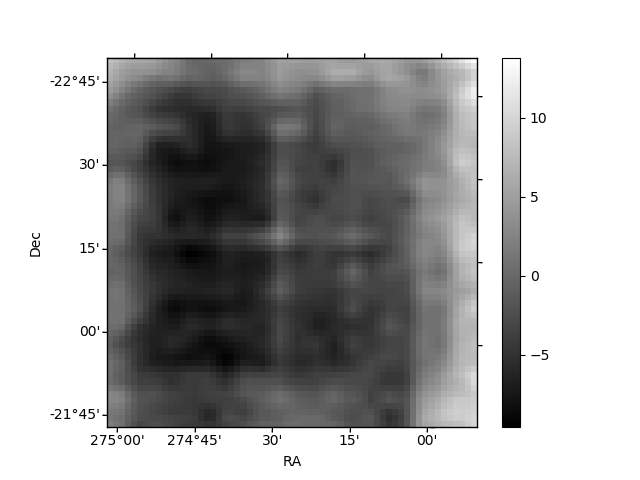
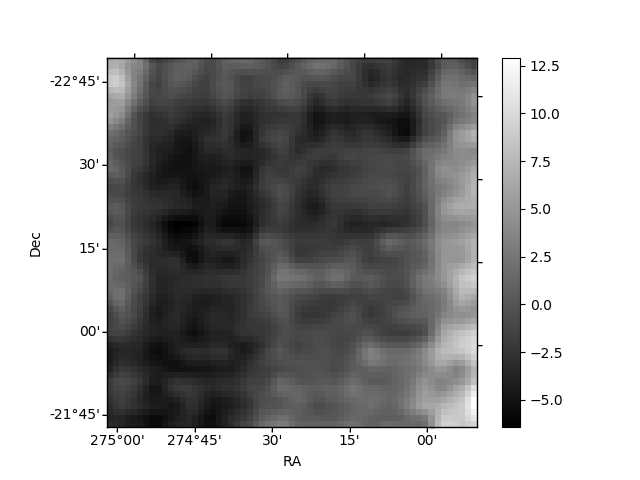
Histogram calculated using DETX and DETY for each event in the final _common_clean file
| Quadrant A | 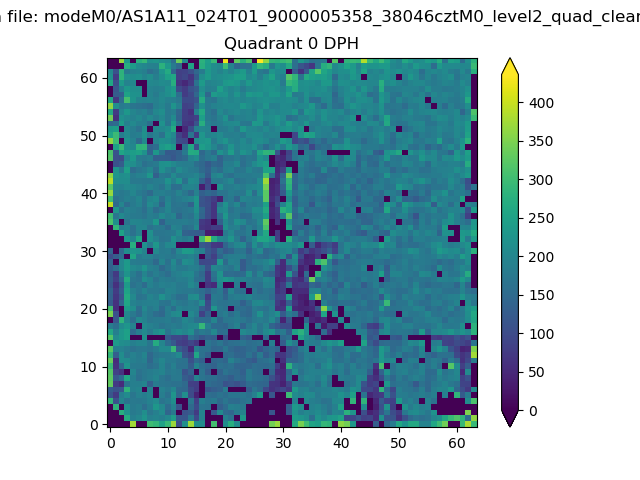 |
 |
Quadrant B |
|---|---|---|---|
| Quadrant D | 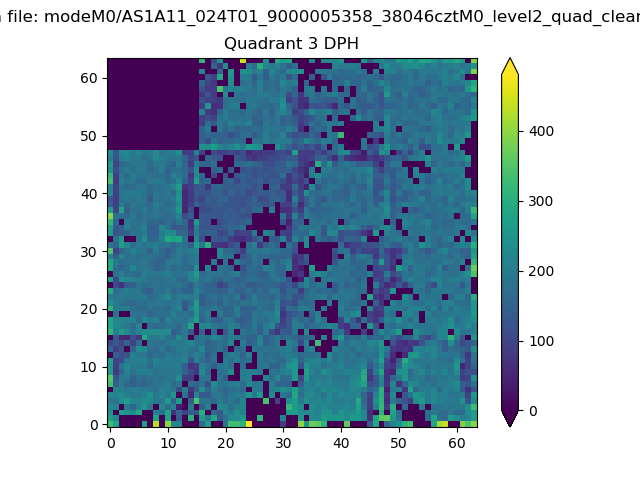 |
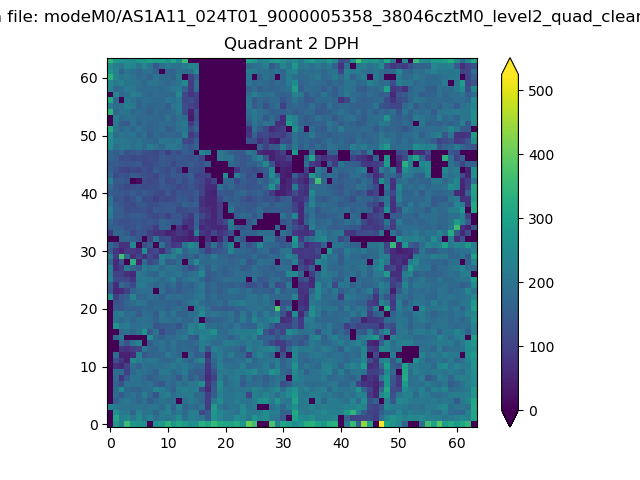 |
Quadrant C |
| Plot type | Count rate plots | Images |
|---|---|---|
| Comparison with Poisson distribution Blue bars denote a histogram of data divided into 1 sec bins. Red curve is a Poisson curve with rate = median count rate of data. |
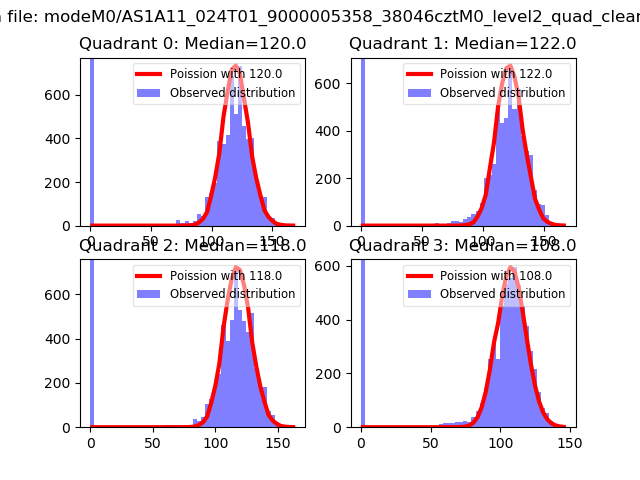 |
 |
| Quadrant-wise count rates Data is divided into 100 sec bins |
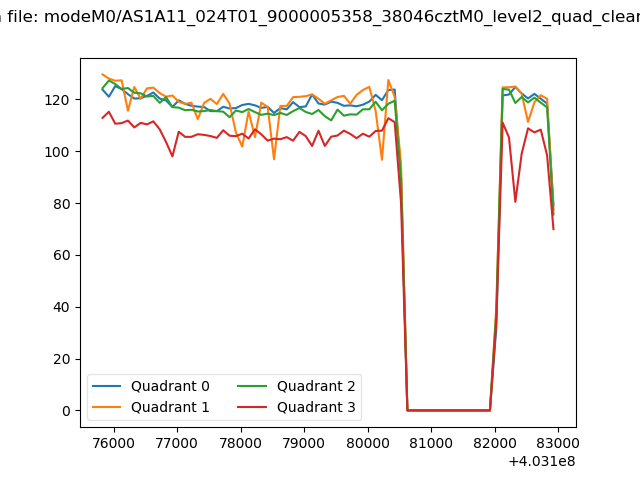 |
|
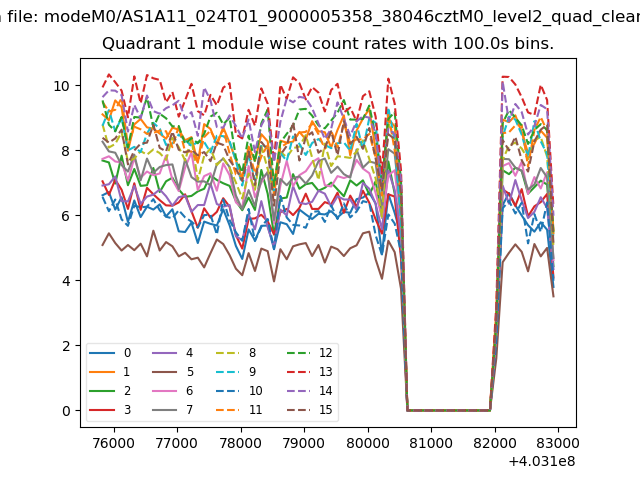
| Module-wise count rates for Quadrant A Data is divided into 100 sec bins |
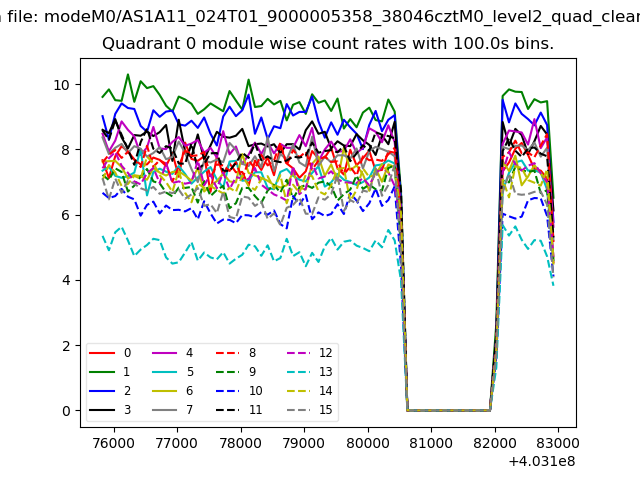 |
 |
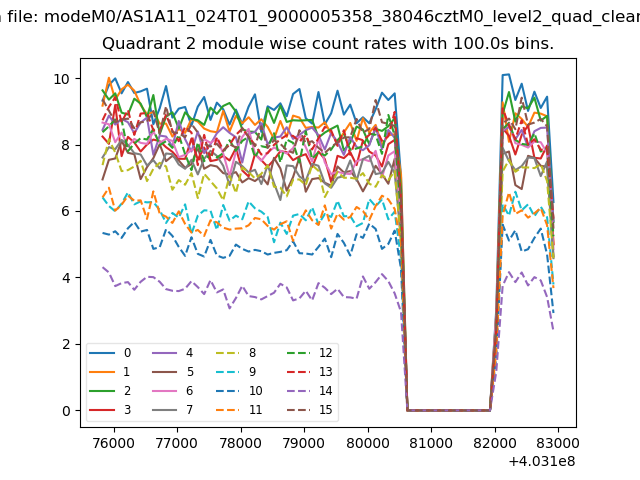
| Module-wise count rates for Quadrant B Data is divided into 100 sec bins |
 |
 |
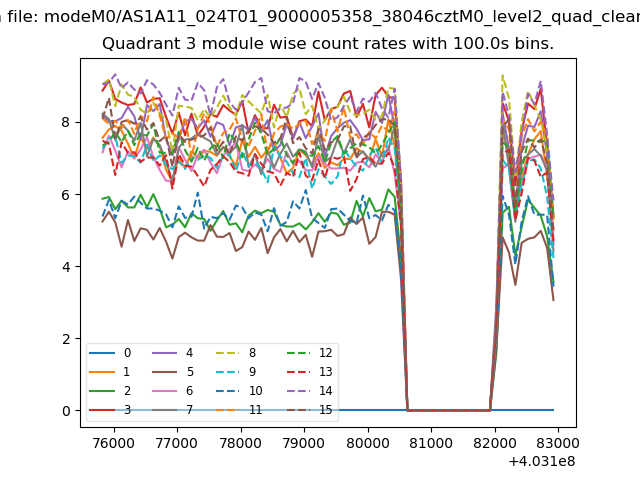
| Module-wise count rates for Quadrant C Data is divided into 100 sec bins |
 |
 |
| Module-wise count rates for Quadrant D Data is divided into 100 sec bins |
 |
 |
| Parameter | Plot |
|---|---|
| CZT HV Monitor | 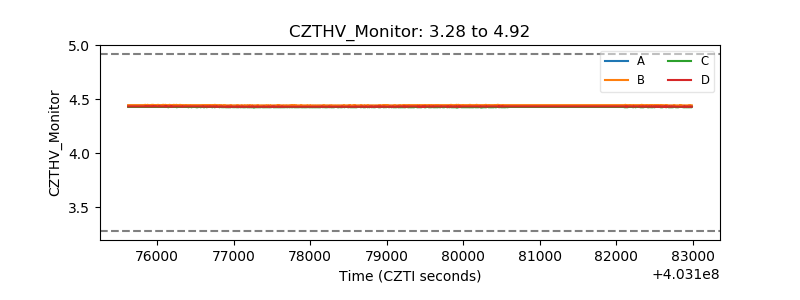 |
| D_VDD | 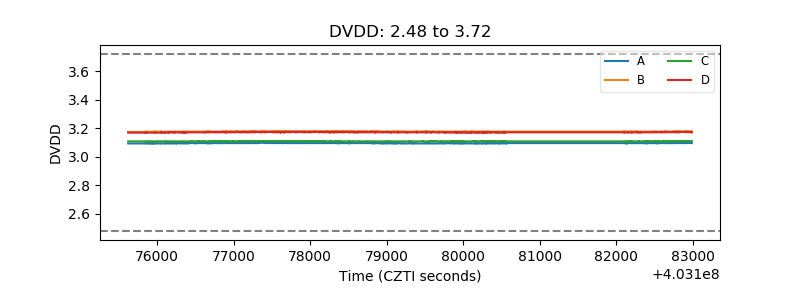 |
| Temperature 1 | 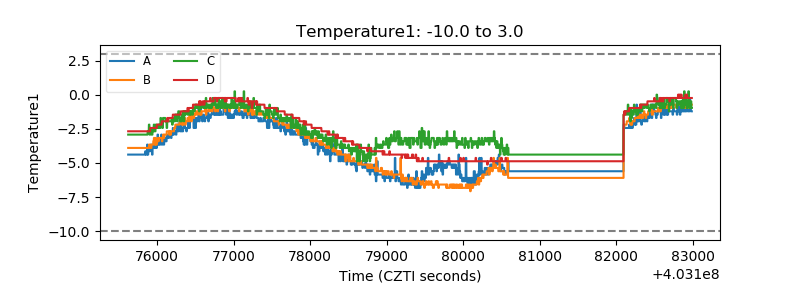 |
| Veto HV Monitor | 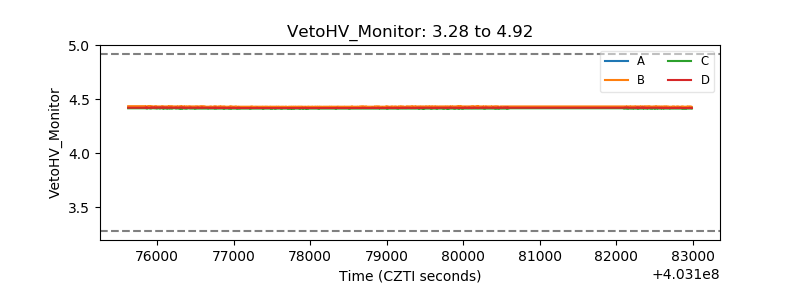 |
| Veto LLD | 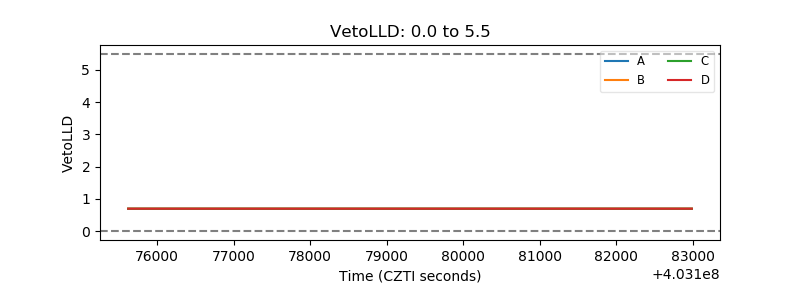 |
| Alpha Counter | 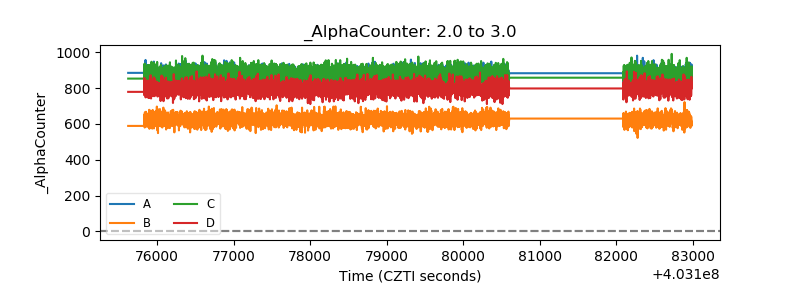 |
| _CPM_Rate | 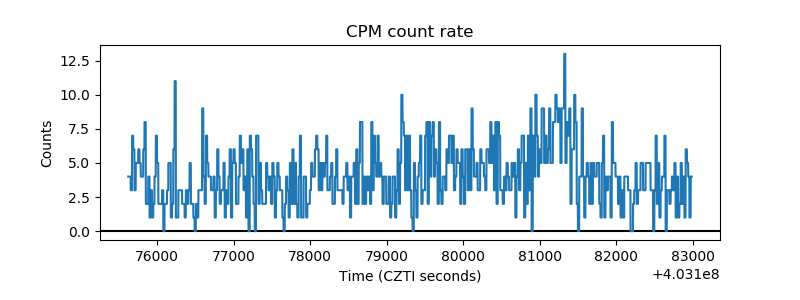 |
| CZT Counter | 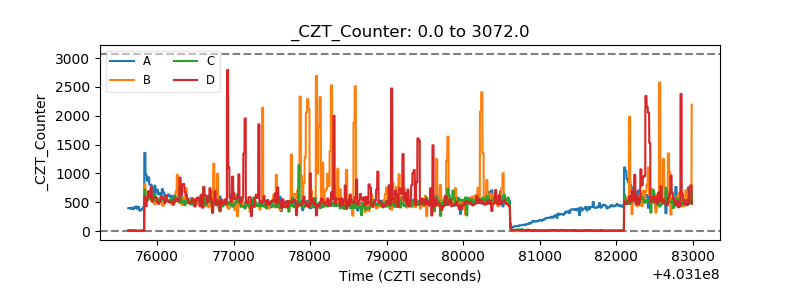 |
| +2.5 Volts monitor | 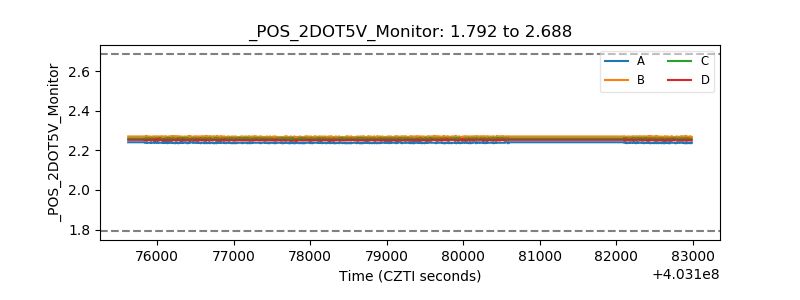 |
| +5 Volts monitor | 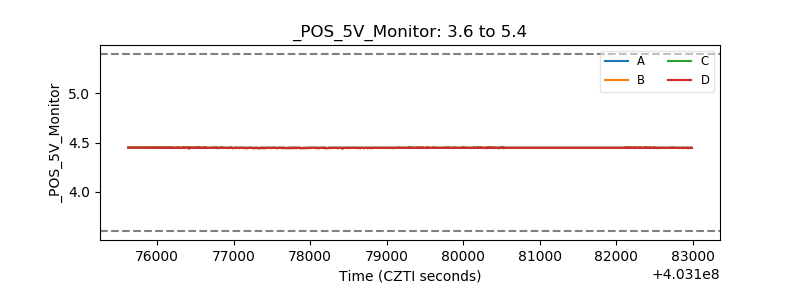 |
| _ROLL_ROT | 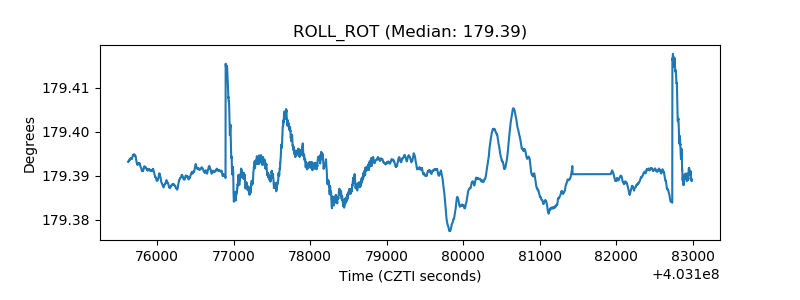 |
| _Roll_DEC | 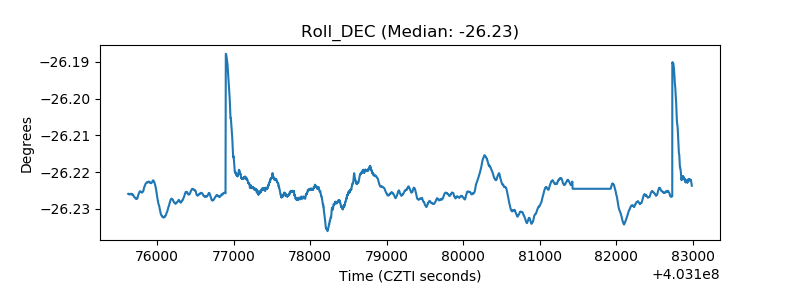 |
| _Roll_RA | 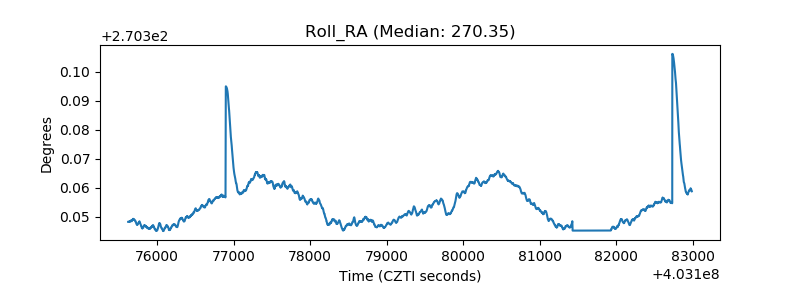 |
| Veto Counter | 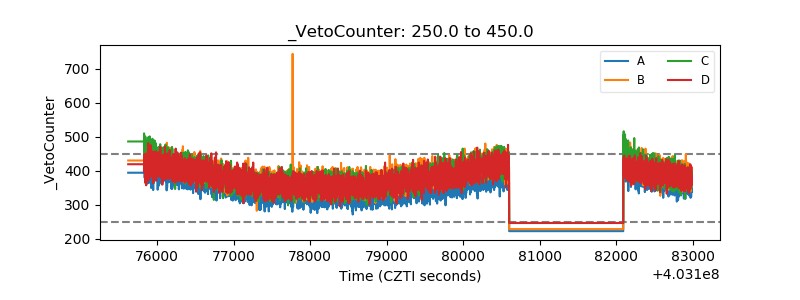 |