| Param | Original file | Final file |
|---|---|---|
| Filename | modeM0/AS1A11_024T01_9000005358_38047cztM0_level2.fits | modeM0/AS1A11_024T01_9000005358_38047cztM0_level2_quad_clean.evt |
| Size (bytes) | 87,966,720 | 23,192,640 |
| Size | 83.9 MB | 22.1 MB |
| Events in quadrant A | 776,692 | 156,620 |
| Events in quadrant B | 838,338 | 156,722 |
| Events in quadrant C | 661,416 | 155,039 |
| Events in quadrant D | 875,015 | 136,025 |
| Mode M9 | |||
|---|---|---|---|
| Quadrant | BADHDUFLAG | Total packets | Discarded packets |
| A | 1 | 140170566264872 | 140170552672302 |
| B | 1 | -1 | -1 |
| C | 1 | -1 | -1 |
| D | 1 | -1 | -1 |
| Mode SS | |||
|---|---|---|---|
| Quadrant | BADHDUFLAG | Total packets | Discarded packets |
| A | 0 | 26 | 0 |
| B | 0 | 26 | 0 |
| C | 0 | 26 | 0 |
| D | 0 | 26 | 0 |
| Mode M0 | |||
|---|---|---|---|
| Quadrant | BADHDUFLAG | Total packets | Discarded packets |
| A | 0 | 3103 | 1 |
| B | 0 | 3334 | 1 |
| C | 0 | 2702 | 1 |
| D | 0 | 3418 | 1 |
| Quadrant | Total seconds | Saturated seconds | Saturation percentage |
|---|---|---|---|
| A | 1308 | 6 | 0.458716% |
| B | 1308 | 36 | 2.752294% |
| C | 1308 | 2 | 0.152905% |
| D | 1308 | 65 | 4.969419% |
Noise dominated data is calculated using 1-second bins in cleaned event files. If a bin has >2000 counts, and if more than 50% of those come from <1% of pixels, then it is considered to be noise-dominated and hence unusable.
| Quadrant | # 1 sec bins | Bins with >0 counts | Bins with >2000 counts | High rate bins dominated by noise | Noise dominated (total time) | Noise dominated (detector-on time) | Marked lightcurve |
|---|---|---|---|---|---|---|---|
| A | 1308 | 1308 | 1 | 1 | 0.08% | 0.08% | 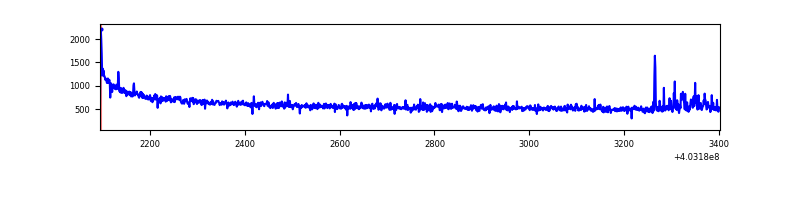 |
| B | 1308 | 1308 | 25 | 25 | 1.91% | 1.91% | 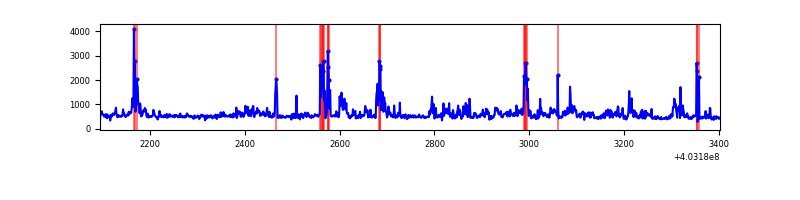 |
| C | 1308 | 1308 | 1 | 1 | 0.08% | 0.08% | 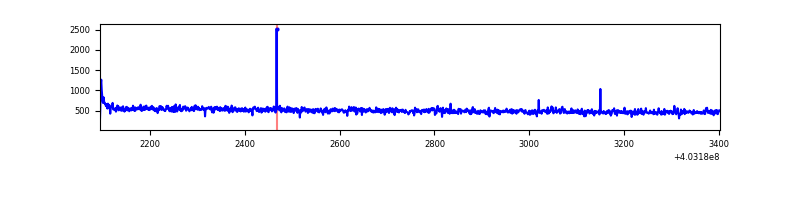 |
| D | 1308 | 1308 | 48 | 48 | 3.67% | 3.67% | 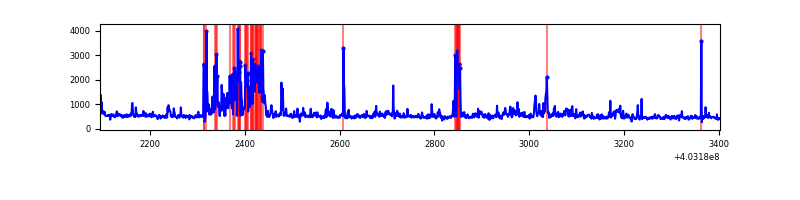 |
Top three noisy pixels from each quadrant. If the there are fewer than three noisy pixels in the level2.evt file, extra rows are filled as -1
| Pixel properties | Quadrant properties | ||||||
|---|---|---|---|---|---|---|---|
| Quadrant | DetID | PixID | Counts | Sigma | Mean | Median | Sigma |
| A | 10 | 83 | 140303 | 4101.85 | 157 | 154 | 34.2 |
| A | 12 | 16 | 14469 | 418.97 | 157 | 154 | 34.2 |
| A | 13 | 6 | 4210 | 118.71 | 157 | 154 | 34.2 |
| B | 0 | 213 | 47552 | 1524.26 | 152 | 149 | 31.1 |
| B | 4 | 171 | 42371 | 1357.66 | 152 | 149 | 31.1 |
| B | 0 | 186 | 29581 | 946.39 | 152 | 149 | 31.1 |
| C | 15 | 214 | 59087 | 1592.63 | 150 | 151 | 37.0 |
| C | 3 | 233 | 6721 | 177.54 | 150 | 151 | 37.0 |
| C | 1 | 23 | 4110 | 106.98 | 150 | 151 | 37.0 |
| D | 10 | 199 | 134381 | 3429.46 | 150 | 145 | 39.1 |
| D | 13 | 249 | 61989 | 1579.99 | 150 | 145 | 39.1 |
| D | 1 | 52 | 27225 | 691.84 | 150 | 145 | 39.1 |
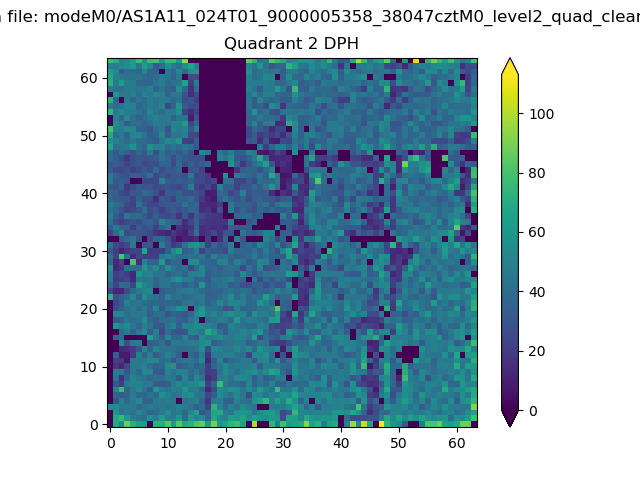
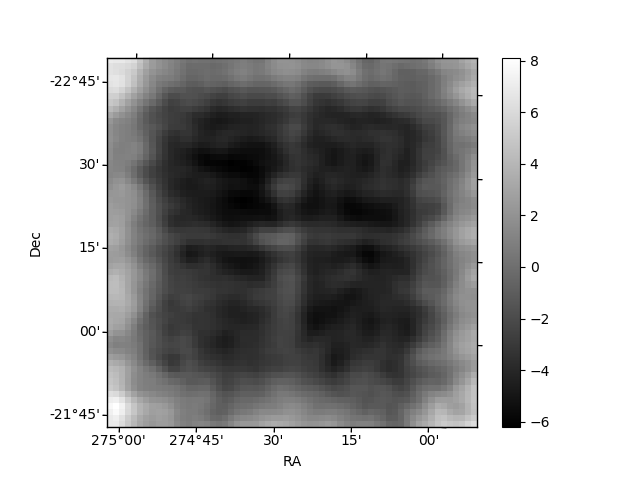
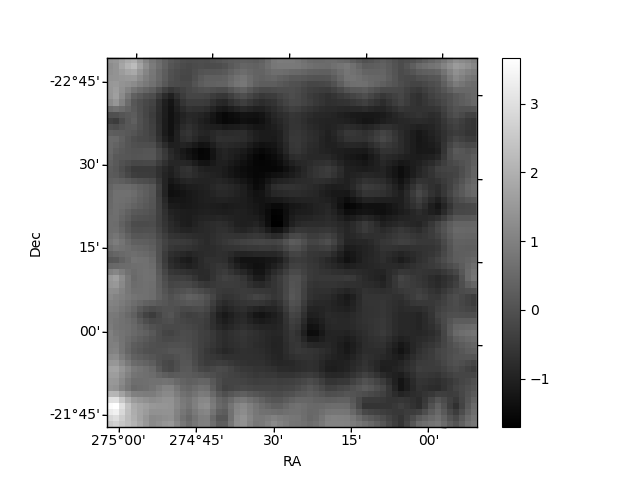
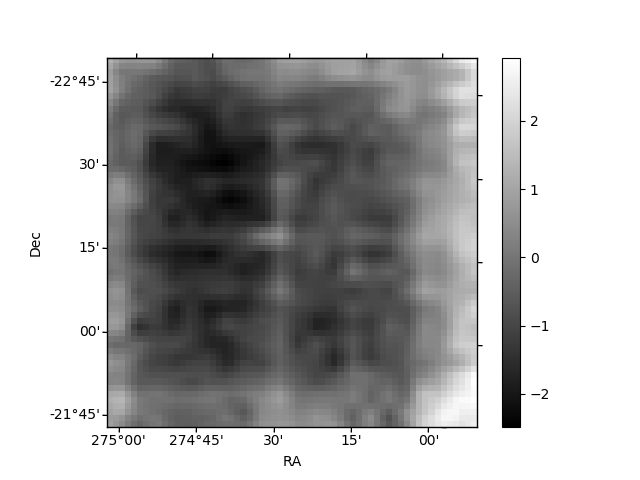
Histogram calculated using DETX and DETY for each event in the final _common_clean file
| Quadrant A | 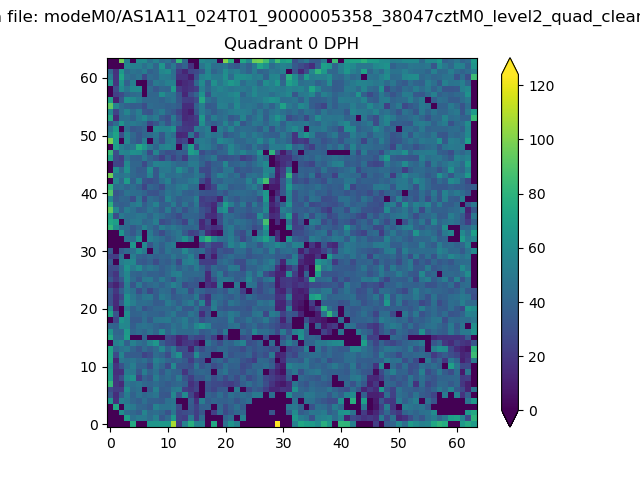 |
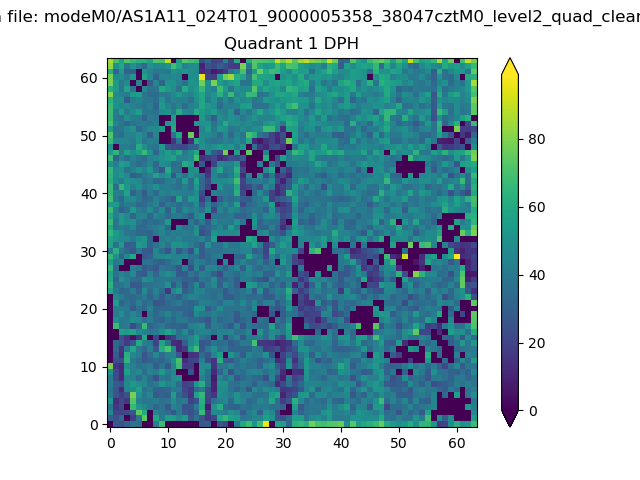 |
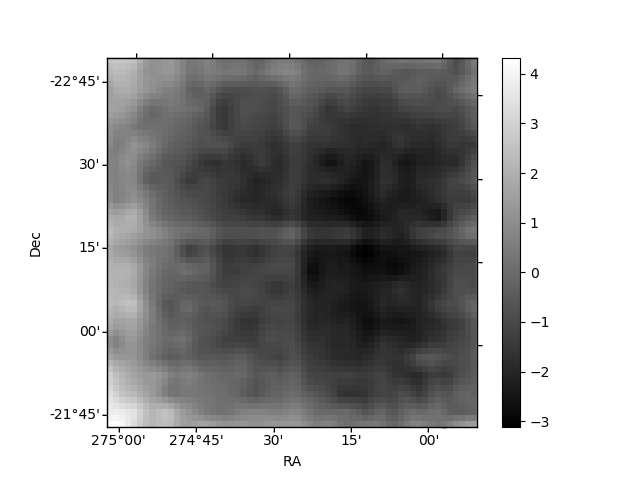
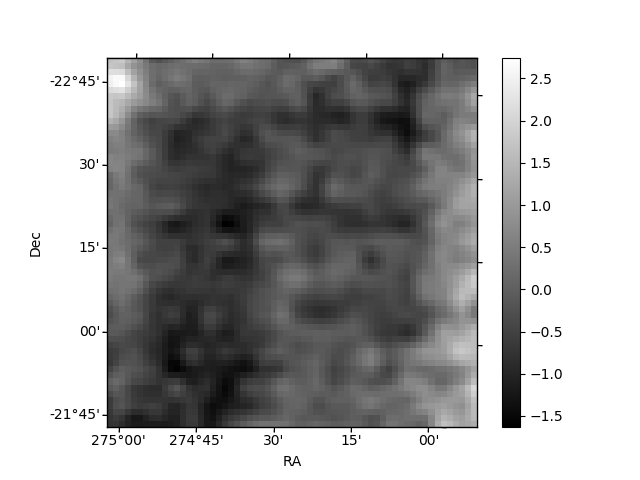
Quadrant B |
|---|---|---|---|
| Quadrant D | 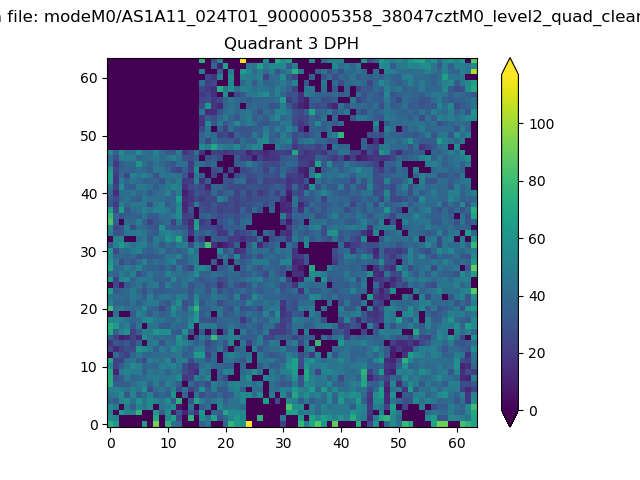 |
 |
Quadrant C |
| Plot type | Count rate plots | Images |
|---|---|---|
| Comparison with Poisson distribution Blue bars denote a histogram of data divided into 1 sec bins. Red curve is a Poisson curve with rate = median count rate of data. |
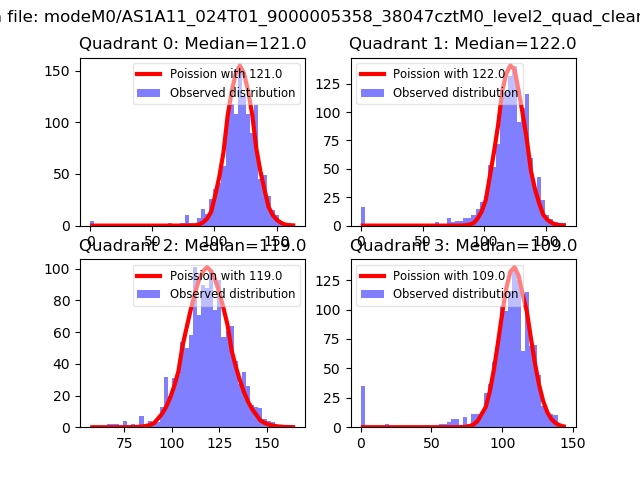 |
 |
| Quadrant-wise count rates Data is divided into 100 sec bins |
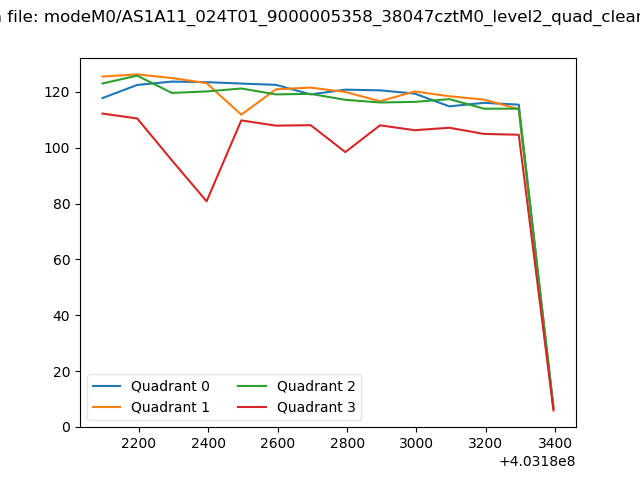 |
|
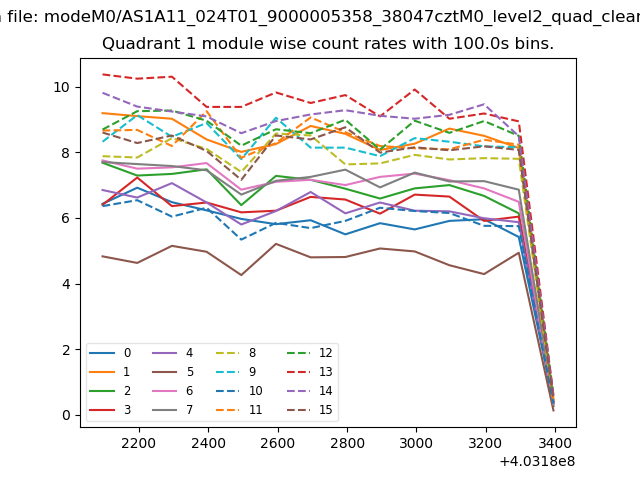
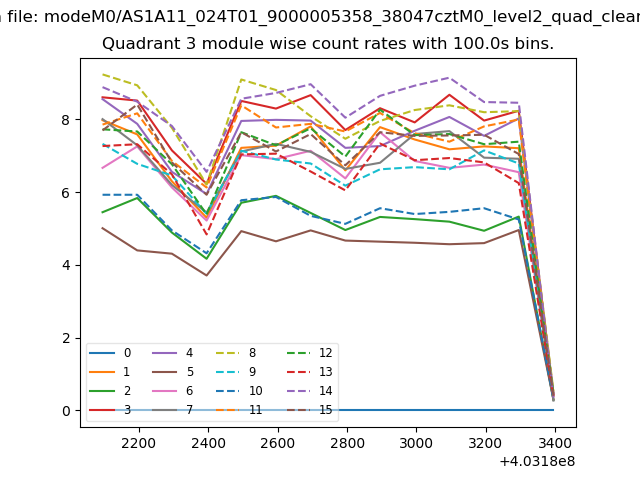
| Module-wise count rates for Quadrant A Data is divided into 100 sec bins |
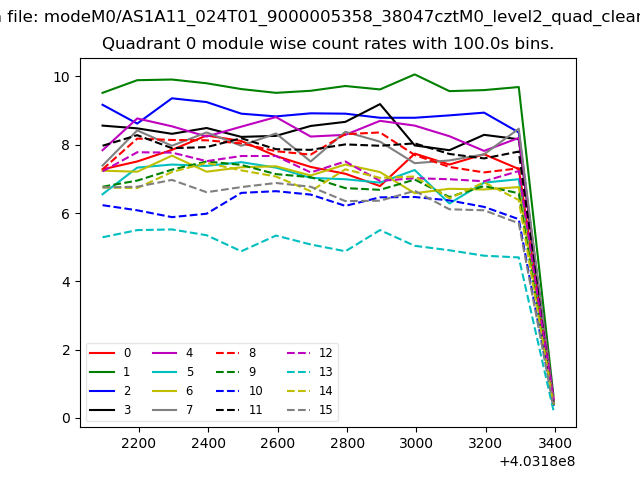 |
 |
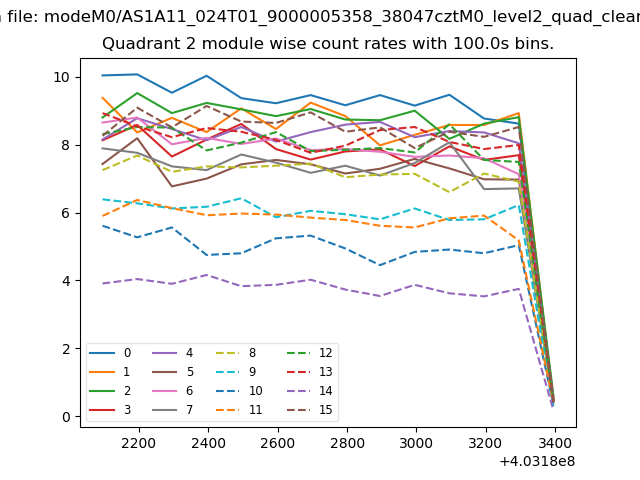
| Module-wise count rates for Quadrant B Data is divided into 100 sec bins |
 |
 |
| Module-wise count rates for Quadrant C Data is divided into 100 sec bins |
 |
 |
| Module-wise count rates for Quadrant D Data is divided into 100 sec bins |
 |
 |
| Parameter | Plot |
|---|---|
| CZT HV Monitor | 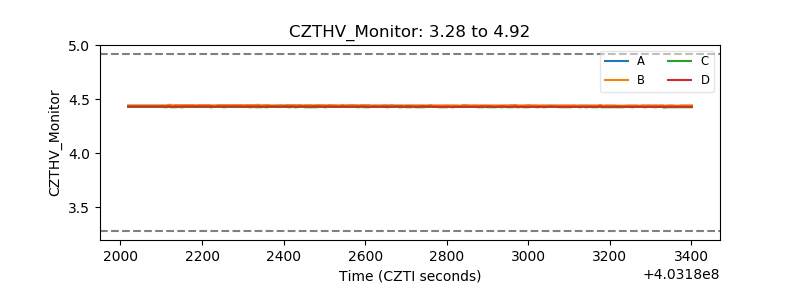 |
| D_VDD | 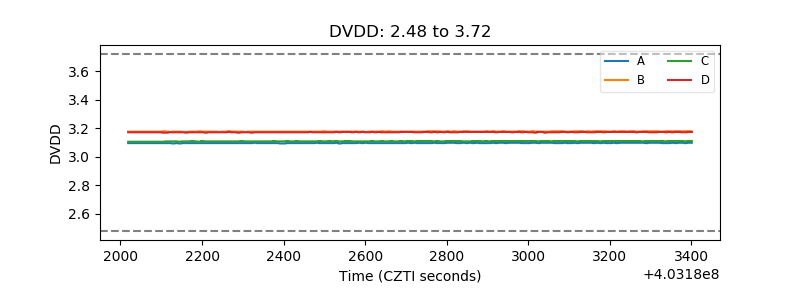 |
| Temperature 1 | 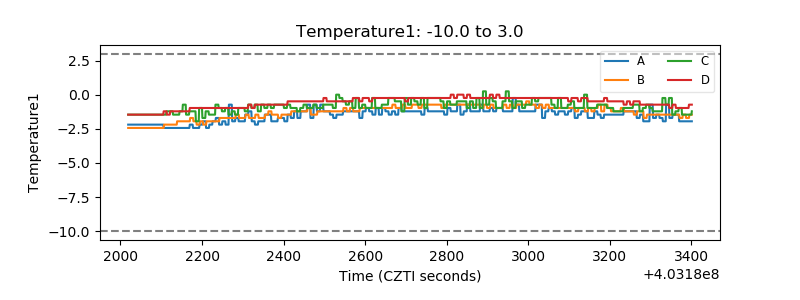 |
| Veto HV Monitor | 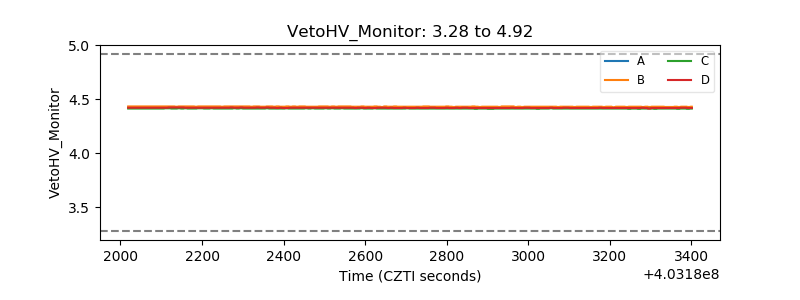 |
| Veto LLD | 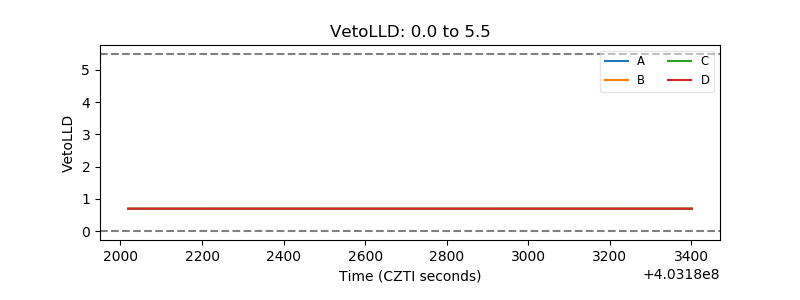 |
| Alpha Counter | 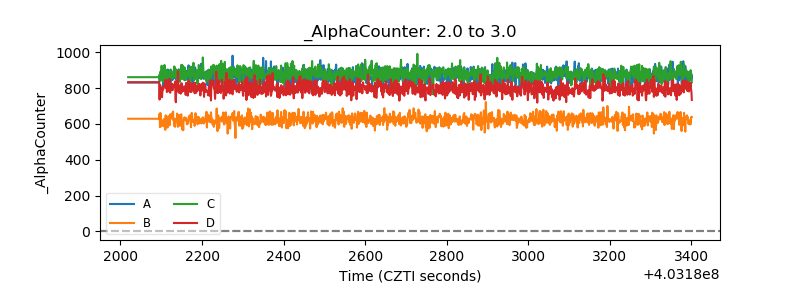 |
| _CPM_Rate | 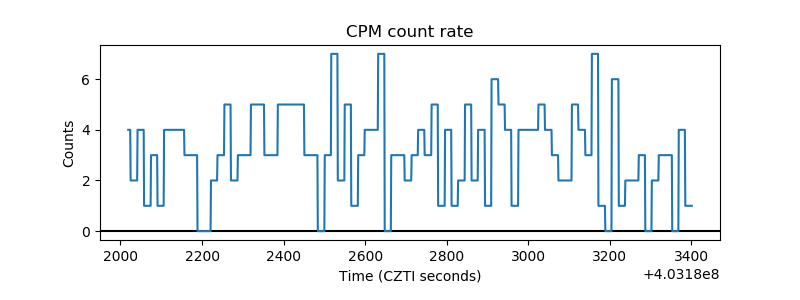 |
| CZT Counter | 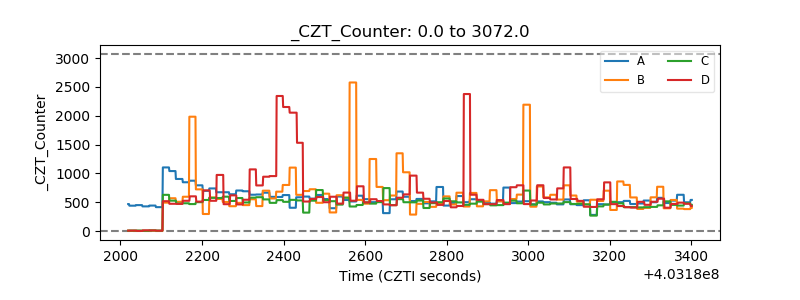 |
| +2.5 Volts monitor | 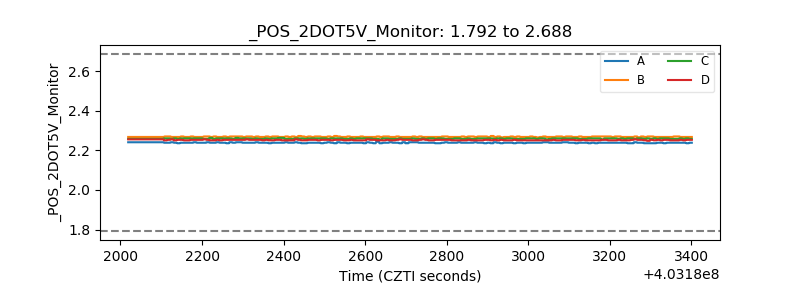 |
| +5 Volts monitor | 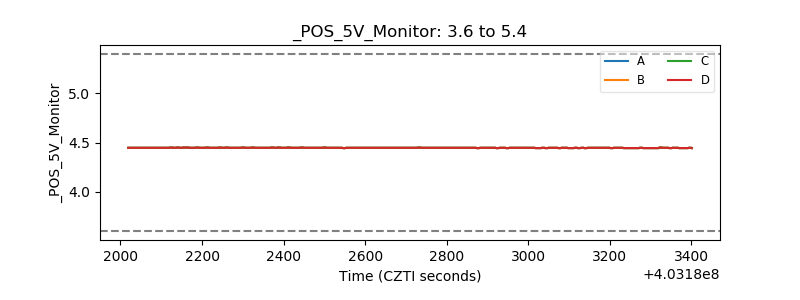 |
| _ROLL_ROT | 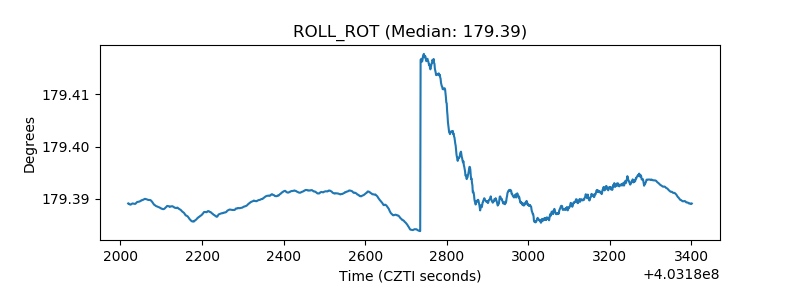 |
| _Roll_DEC | 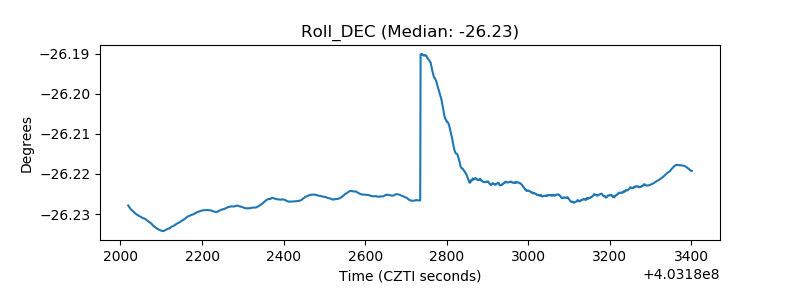 |
| _Roll_RA | 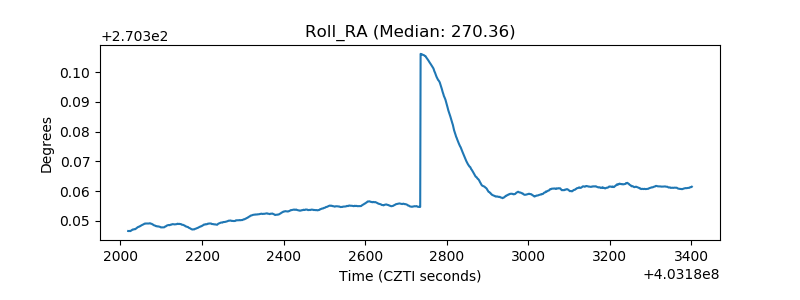 |
| Veto Counter | 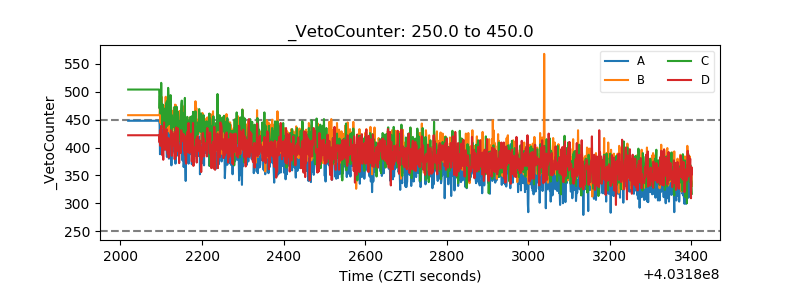 |