| Param | Original file | Final file |
|---|---|---|
| Filename | modeM0/AS1A11_044T01_9000005360_38047cztM0_level2.fits | modeM0/AS1A11_044T01_9000005360_38047cztM0_level2_quad_clean.evt |
| Size (bytes) | 227,730,240 | 64,264,320 |
| Size | 217.2 MB | 61.3 MB |
| Events in quadrant A | 1,909,026 | 429,805 |
| Events in quadrant B | 2,010,691 | 437,431 |
| Events in quadrant C | 1,863,541 | 426,878 |
| Events in quadrant D | 2,352,593 | 385,988 |
| Mode SS | |||
|---|---|---|---|
| Quadrant | BADHDUFLAG | Total packets | Discarded packets |
| A | 0 | 78 | 0 |
| B | 0 | 78 | 0 |
| C | 0 | 78 | 0 |
| D | 0 | 78 | 0 |
| Mode M9 | |||
|---|---|---|---|
| Quadrant | BADHDUFLAG | Total packets | Discarded packets |
| A | 0 | 13 | 0 |
| B | 0 | 13 | 0 |
| C | 0 | 13 | 0 |
| D | 0 | 13 | 0 |
| Mode M0 | |||
|---|---|---|---|
| Quadrant | BADHDUFLAG | Total packets | Discarded packets |
| A | 0 | 7920 | 2 |
| B | 0 | 8398 | 1 |
| C | 0 | 7750 | 1 |
| D | 0 | 9469 | 1 |
| Quadrant | Total seconds | Saturated seconds | Saturation percentage |
|---|---|---|---|
| A | 3757 | 8 | 0.212936% |
| B | 3757 | 41 | 1.091296% |
| C | 3757 | 15 | 0.399255% |
| D | 3757 | 113 | 3.007719% |
Noise dominated data is calculated using 1-second bins in cleaned event files. If a bin has >2000 counts, and if more than 50% of those come from <1% of pixels, then it is considered to be noise-dominated and hence unusable.
| Quadrant | # 1 sec bins | Bins with >0 counts | Bins with >2000 counts | High rate bins dominated by noise | Noise dominated (total time) | Noise dominated (detector-on time) | Marked lightcurve |
|---|---|---|---|---|---|---|---|
| A | 5100 | 3758 | 4 | 4 | 0.08% | 0.11% | 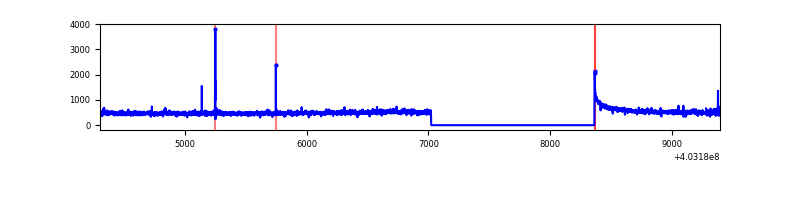 |
| B | 5100 | 3758 | 24 | 24 | 0.47% | 0.64% | 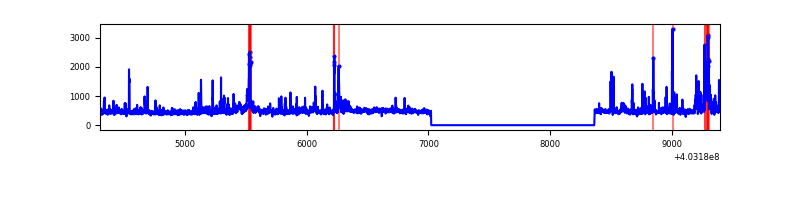 |
| C | 5100 | 3758 | 12 | 12 | 0.24% | 0.32% | 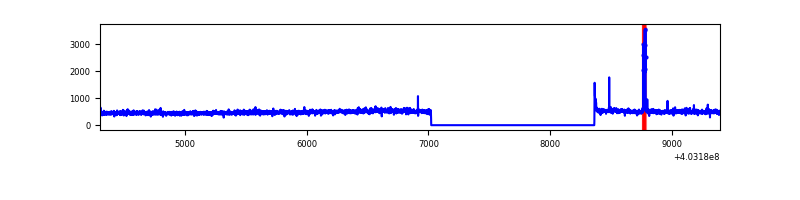 |
| D | 5100 | 3758 | 100 | 100 | 1.96% | 2.66% | 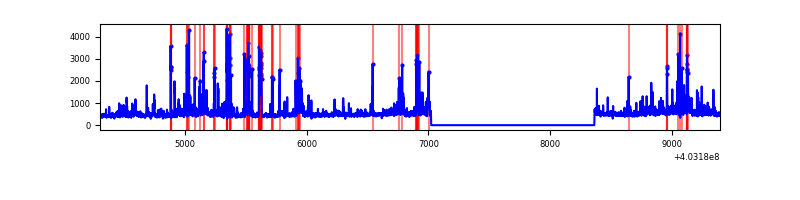 |
Top three noisy pixels from each quadrant. If the there are fewer than three noisy pixels in the level2.evt file, extra rows are filled as -1
| Pixel properties | Quadrant properties | ||||||
|---|---|---|---|---|---|---|---|
| Quadrant | DetID | PixID | Counts | Sigma | Mean | Median | Sigma |
| A | 10 | 83 | 234738 | 2706.18 | 423 | 414 | 86.6 |
| A | 7 | 3 | 10588 | 117.5 | 423 | 414 | 86.6 |
| A | 12 | 189 | 8504 | 93.43 | 423 | 414 | 86.6 |
| B | 4 | 171 | 126060 | 1536.37 | 423 | 411 | 81.8 |
| B | 5 | 200 | 49078 | 595.08 | 423 | 411 | 81.8 |
| B | 0 | 213 | 40630 | 491.78 | 423 | 411 | 81.8 |
| C | 15 | 214 | 155713 | 1566.36 | 417 | 419 | 99.1 |
| C | 1 | 23 | 45556 | 455.27 | 417 | 419 | 99.1 |
| C | 3 | 233 | 26786 | 265.95 | 417 | 419 | 99.1 |
| D | 12 | 227 | 203919 | 2022.54 | 411 | 400 | 100.6 |
| D | 2 | 250 | 155589 | 1542.24 | 411 | 400 | 100.6 |
| D | 1 | 52 | 119101 | 1179.63 | 411 | 400 | 100.6 |
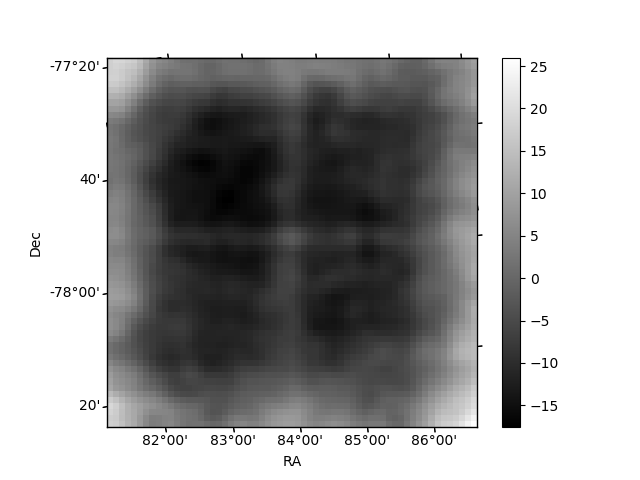
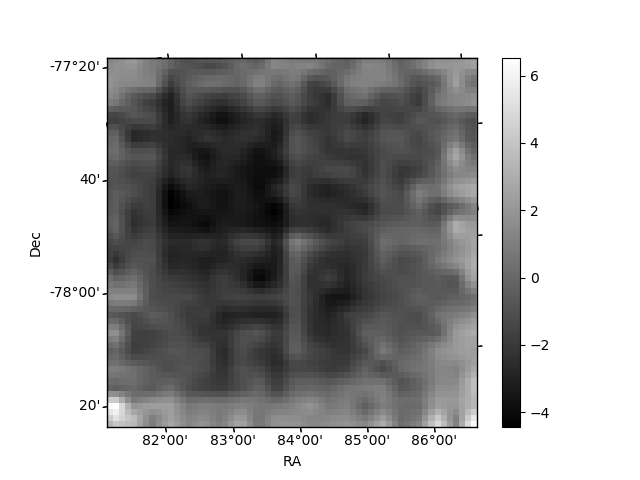
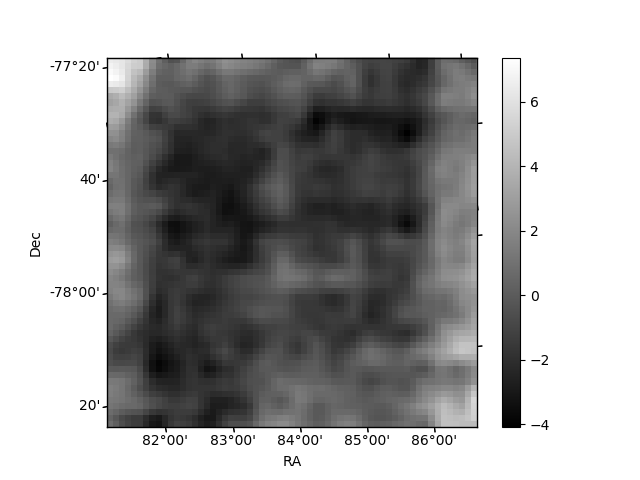
Histogram calculated using DETX and DETY for each event in the final _common_clean file
| Quadrant A | 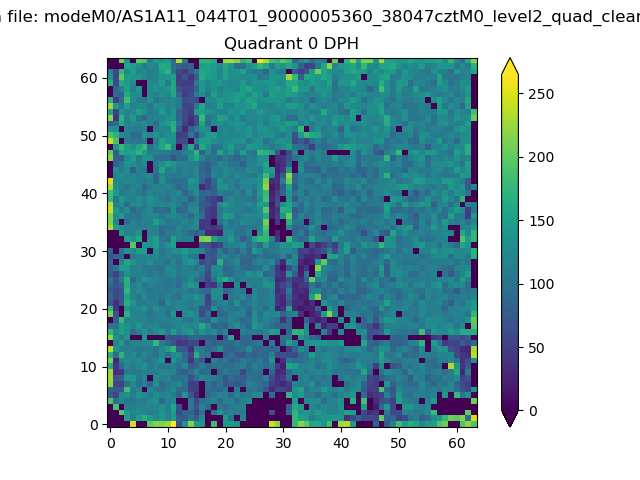 |
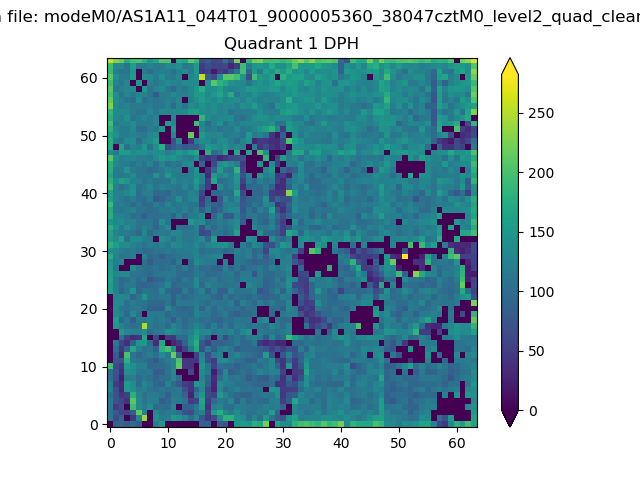 |
Quadrant B |
|---|---|---|---|
| Quadrant D |  |
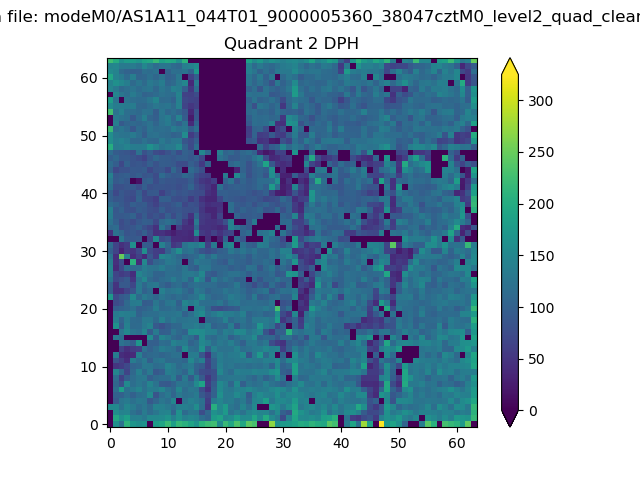 |
Quadrant C |
| Plot type | Count rate plots | Images |
|---|---|---|
| Comparison with Poisson distribution Blue bars denote a histogram of data divided into 1 sec bins. Red curve is a Poisson curve with rate = median count rate of data. |
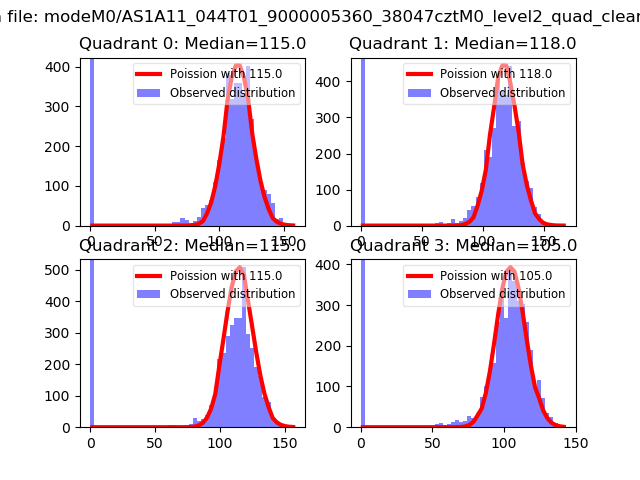 |
 |
| Quadrant-wise count rates Data is divided into 100 sec bins |
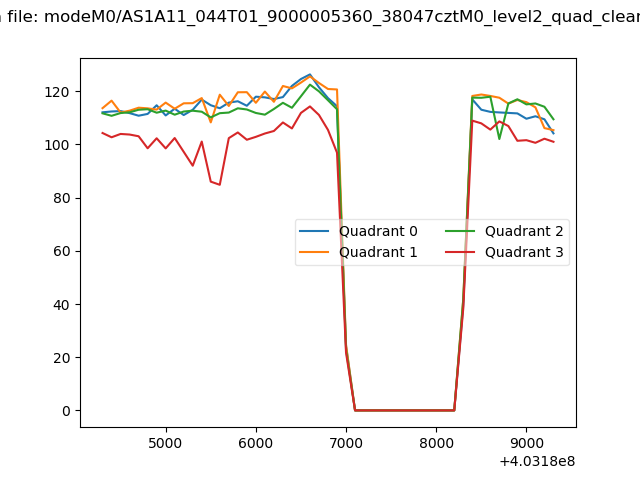 |
|
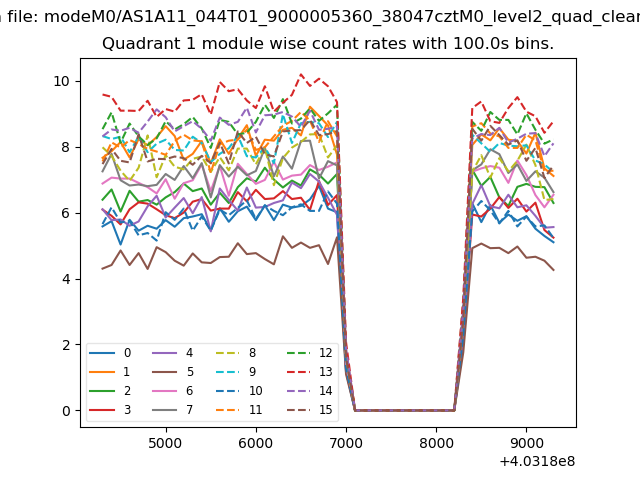
| Module-wise count rates for Quadrant A Data is divided into 100 sec bins |
 |
 |
| Module-wise count rates for Quadrant B Data is divided into 100 sec bins |
 |
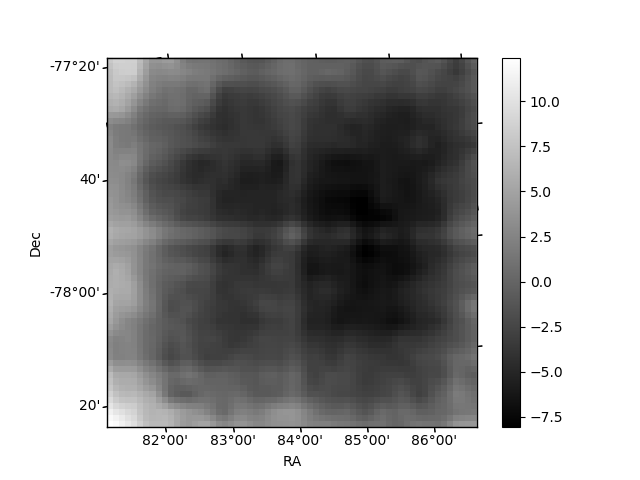 |
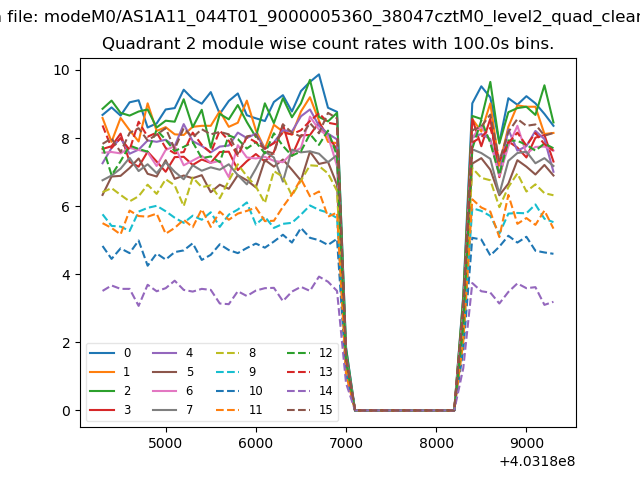
| Module-wise count rates for Quadrant C Data is divided into 100 sec bins |
 |
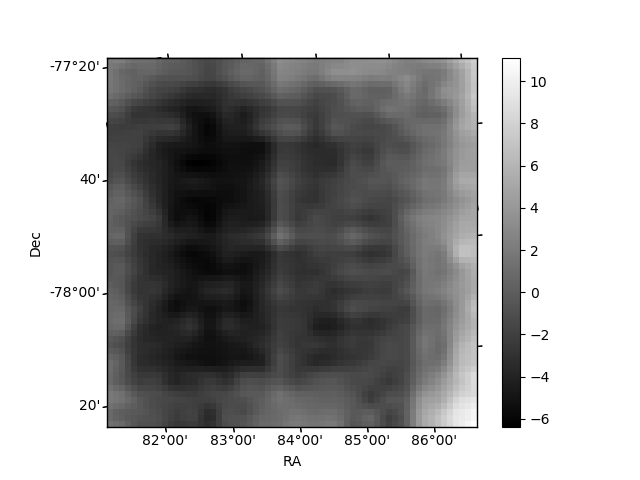 |
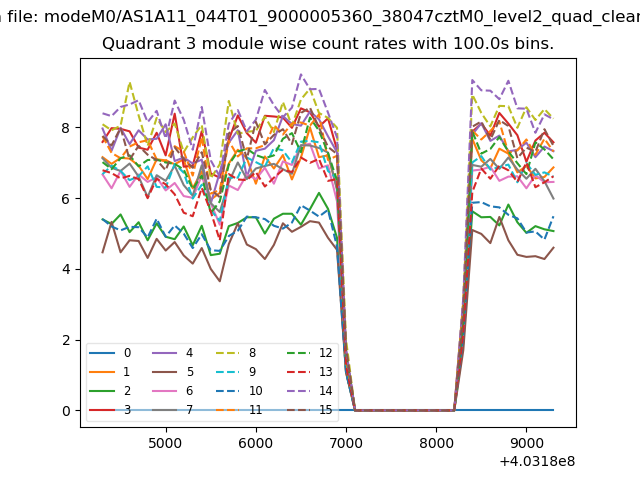
| Module-wise count rates for Quadrant D Data is divided into 100 sec bins |
 |
 |
| Parameter | Plot |
|---|---|
| CZT HV Monitor | 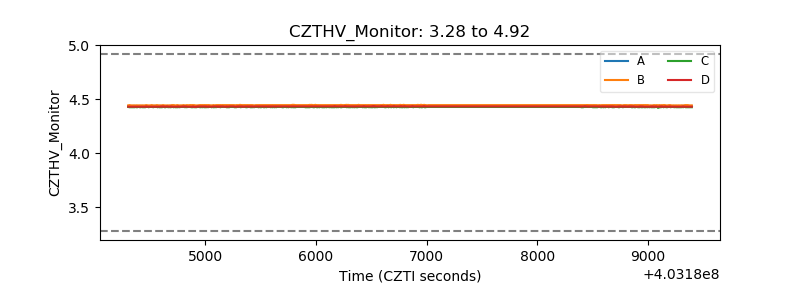 |
| D_VDD | 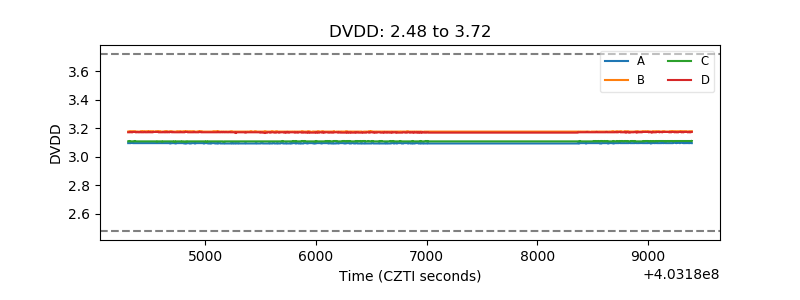 |
| Temperature 1 | 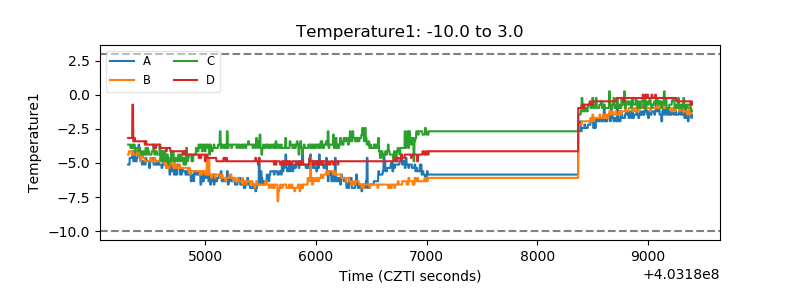 |
| Veto HV Monitor | 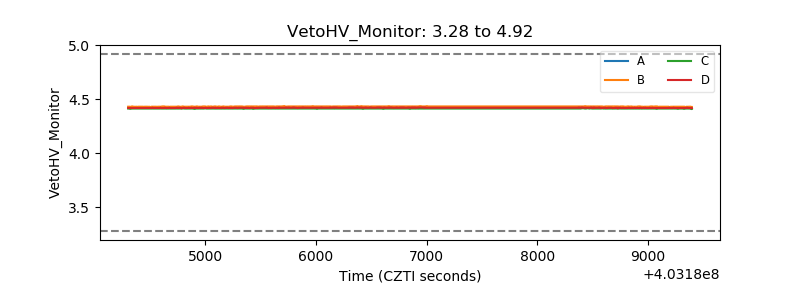 |
| Veto LLD | 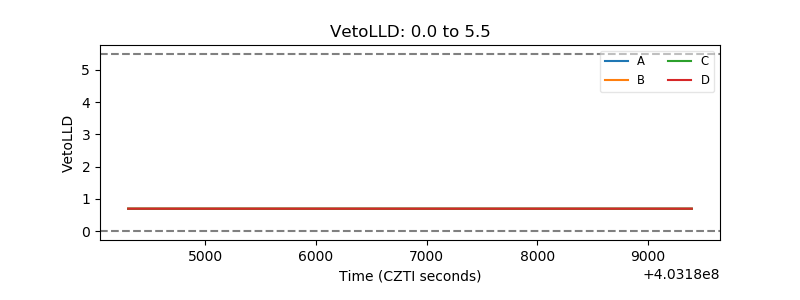 |
| Alpha Counter | 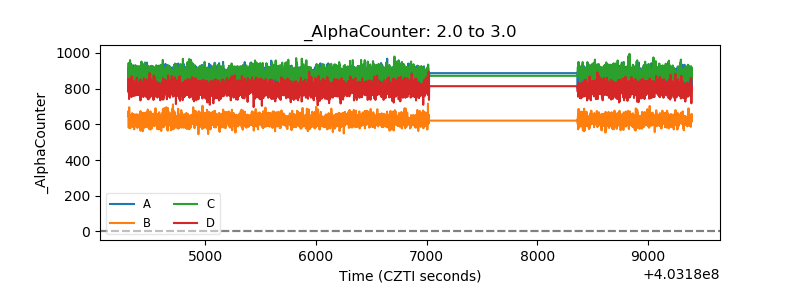 |
| _CPM_Rate | 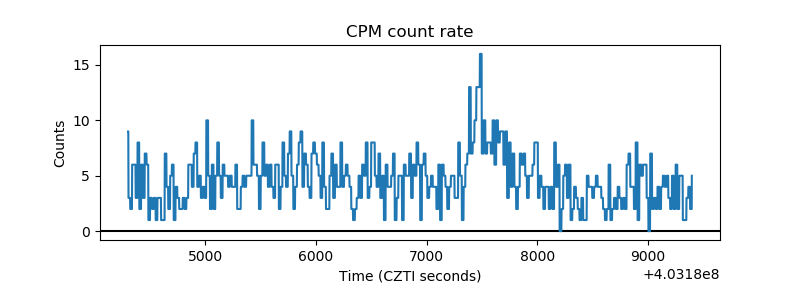 |
| CZT Counter | 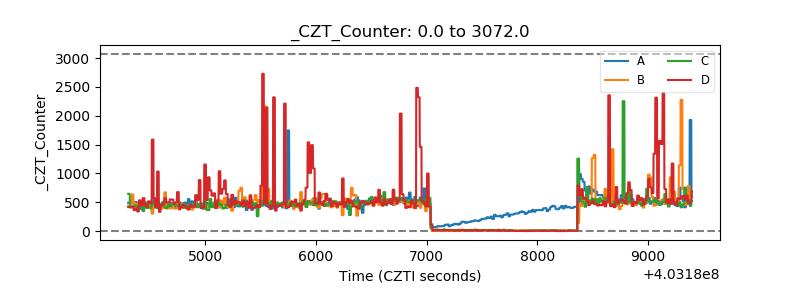 |
| +2.5 Volts monitor | 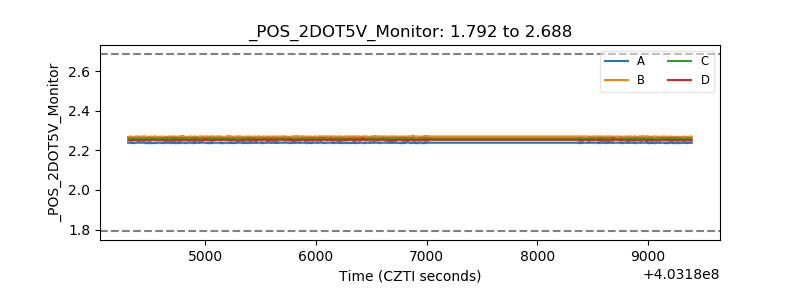 |
| +5 Volts monitor | 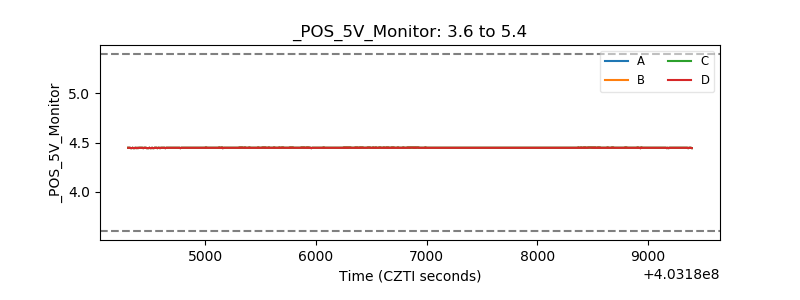 |
| _ROLL_ROT | 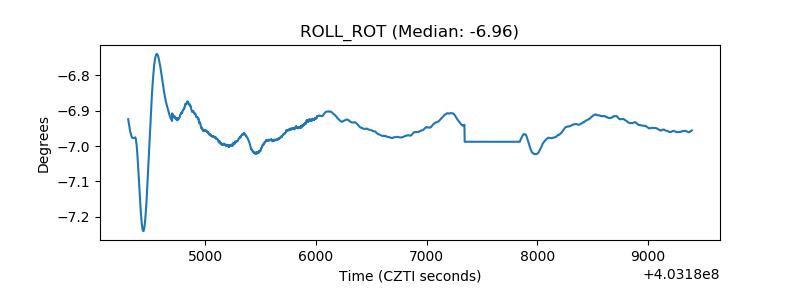 |
| _Roll_DEC | 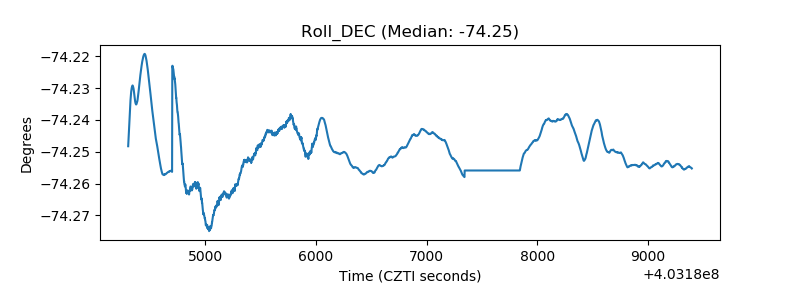 |
| _Roll_RA | 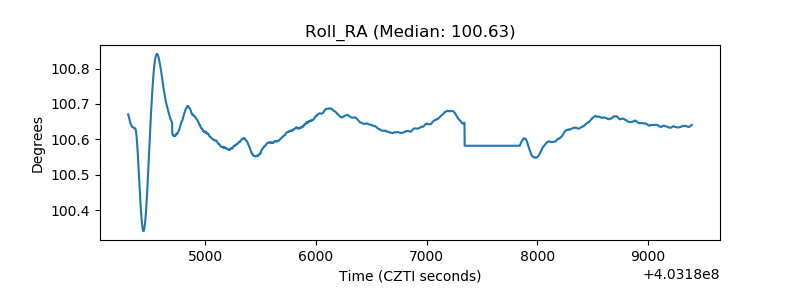 |
| Veto Counter | 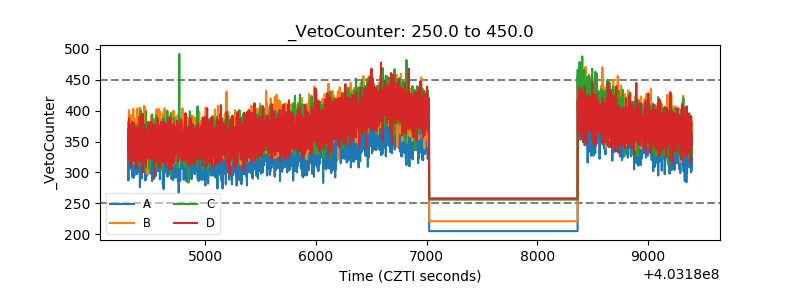 |