| Param | Original file | Final file |
|---|---|---|
| Filename | modeM0/AS1A11_044T01_9000005360_38048cztM0_level2.fits | modeM0/AS1A11_044T01_9000005360_38048cztM0_level2_quad_clean.evt |
| Size (bytes) | 256,368,960 | 74,560,320 |
| Size | 244.5 MB | 71.1 MB |
| Events in quadrant A | 2,253,266 | 496,228 |
| Events in quadrant B | 2,266,176 | 505,068 |
| Events in quadrant C | 2,156,371 | 493,129 |
| Events in quadrant D | 2,469,003 | 452,432 |
| Mode SS | |||
|---|---|---|---|
| Quadrant | BADHDUFLAG | Total packets | Discarded packets |
| A | 0 | 88 | 0 |
| B | 0 | 88 | 0 |
| C | 0 | 88 | 0 |
| D | 0 | 88 | 0 |
| Mode M9 | |||
|---|---|---|---|
| Quadrant | BADHDUFLAG | Total packets | Discarded packets |
| A | 0 | 4 | 0 |
| B | 0 | 4 | 0 |
| C | 0 | 4 | 0 |
| D | 0 | 5 | 0 |
| Mode M0 | |||
|---|---|---|---|
| Quadrant | BADHDUFLAG | Total packets | Discarded packets |
| A | 0 | 9398 | 2 |
| B | 0 | 9676 | 1 |
| C | 0 | 9104 | 1 |
| D | 0 | 10286 | 1 |
| Quadrant | Total seconds | Saturated seconds | Saturation percentage |
|---|---|---|---|
| A | 4419 | 11 | 0.248925% |
| B | 4419 | 45 | 1.018330% |
| C | 4419 | 14 | 0.316814% |
| D | 4419 | 77 | 1.742476% |
Noise dominated data is calculated using 1-second bins in cleaned event files. If a bin has >2000 counts, and if more than 50% of those come from <1% of pixels, then it is considered to be noise-dominated and hence unusable.
| Quadrant | # 1 sec bins | Bins with >0 counts | Bins with >2000 counts | High rate bins dominated by noise | Noise dominated (total time) | Noise dominated (detector-on time) | Marked lightcurve |
|---|---|---|---|---|---|---|---|
| A | 4419 | 4419 | 6 | 6 | 0.14% | 0.14% | 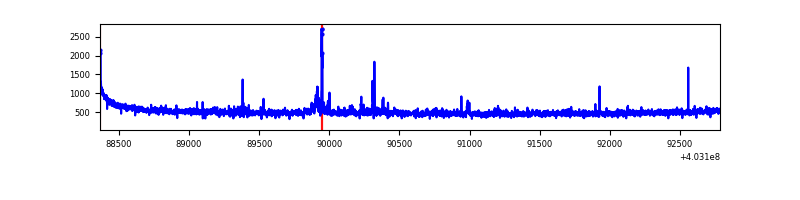 |
| B | 4419 | 4419 | 26 | 26 | 0.59% | 0.59% | 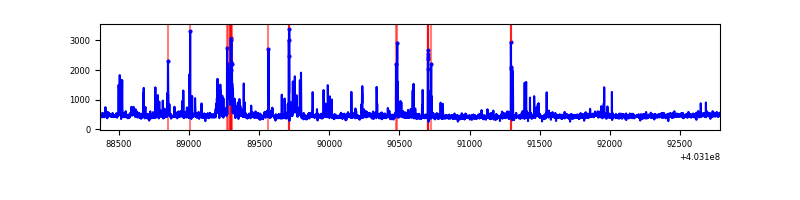 |
| C | 4419 | 4419 | 12 | 12 | 0.27% | 0.27% | 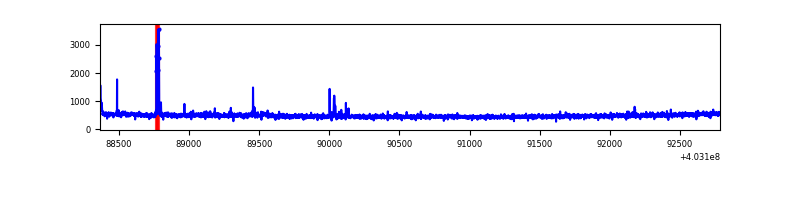 |
| D | 4419 | 4419 | 64 | 64 | 1.45% | 1.45% | 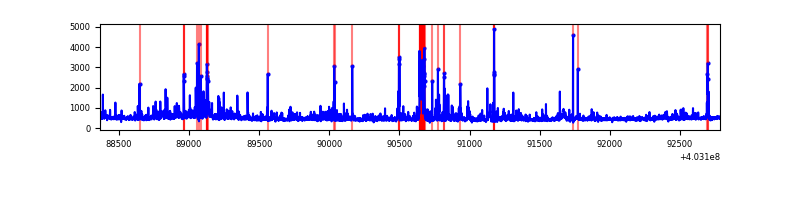 |
Top three noisy pixels from each quadrant. If the there are fewer than three noisy pixels in the level2.evt file, extra rows are filled as -1
| Pixel properties | Quadrant properties | ||||||
|---|---|---|---|---|---|---|---|
| Quadrant | DetID | PixID | Counts | Sigma | Mean | Median | Sigma |
| A | 10 | 83 | 275938 | 2762.23 | 485 | 475 | 99.7 |
| A | 12 | 16 | 28469 | 280.71 | 485 | 475 | 99.7 |
| A | 6 | 255 | 28301 | 279.03 | 485 | 475 | 99.7 |
| B | 4 | 171 | 99423 | 1070.2 | 485 | 473 | 92.5 |
| B | 5 | 172 | 59254 | 635.75 | 485 | 473 | 92.5 |
| B | 0 | 229 | 44073 | 471.56 | 485 | 473 | 92.5 |
| C | 15 | 214 | 185214 | 1657.19 | 477 | 481 | 111.5 |
| C | 1 | 23 | 55822 | 496.45 | 477 | 481 | 111.5 |
| C | 3 | 233 | 45104 | 400.3 | 477 | 481 | 111.5 |
| D | 5 | 222 | 146224 | 1254.17 | 473 | 459 | 116.2 |
| D | 1 | 52 | 111407 | 954.6 | 473 | 459 | 116.2 |
| D | 13 | 249 | 70528 | 602.88 | 473 | 459 | 116.2 |
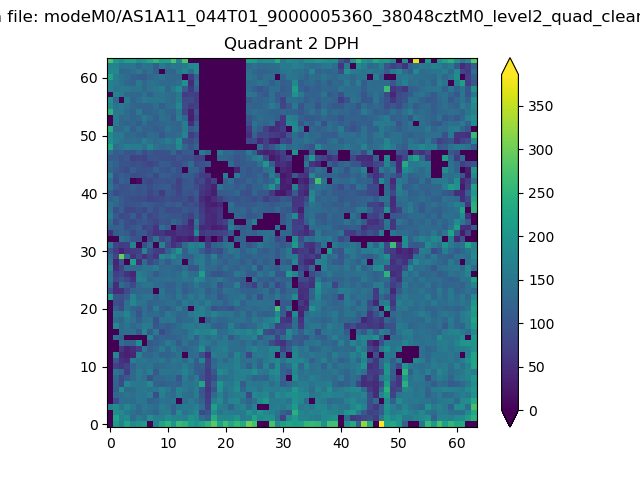
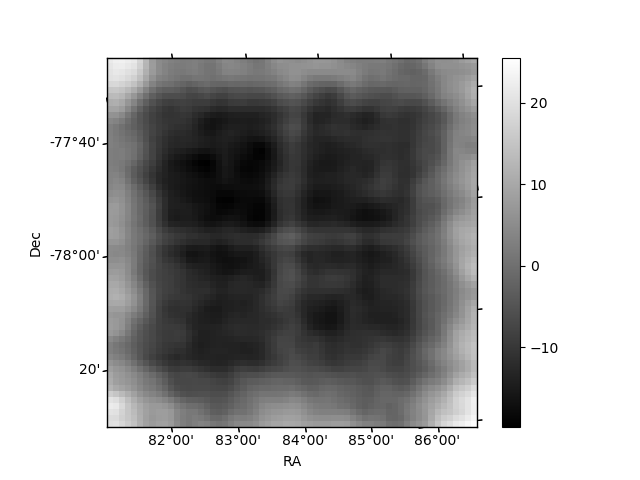
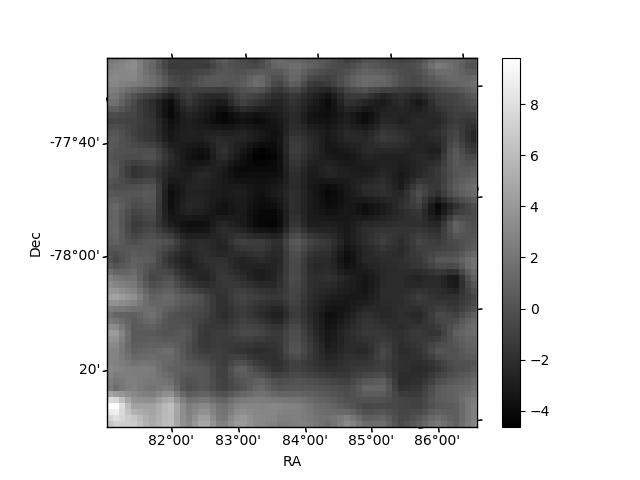
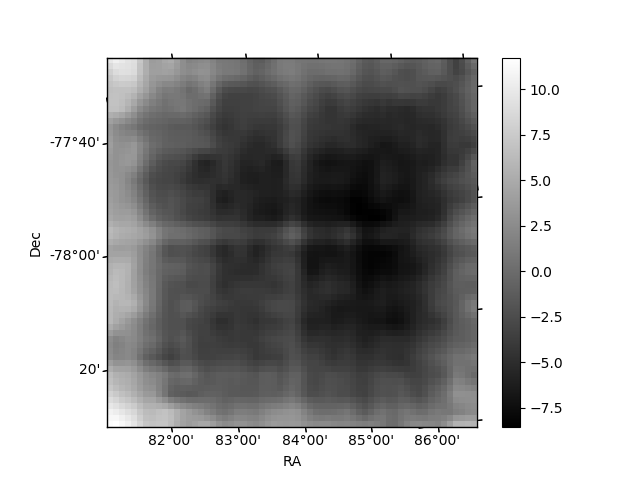
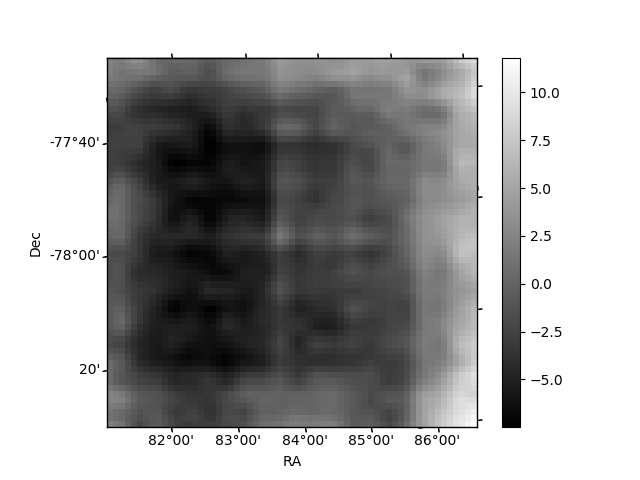
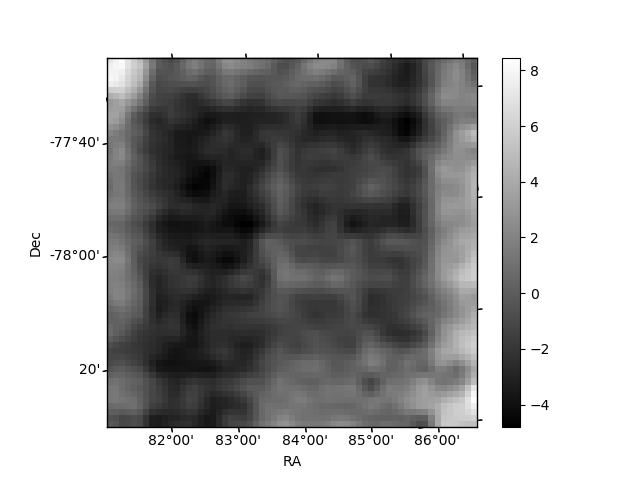
Histogram calculated using DETX and DETY for each event in the final _common_clean file
| Quadrant A | 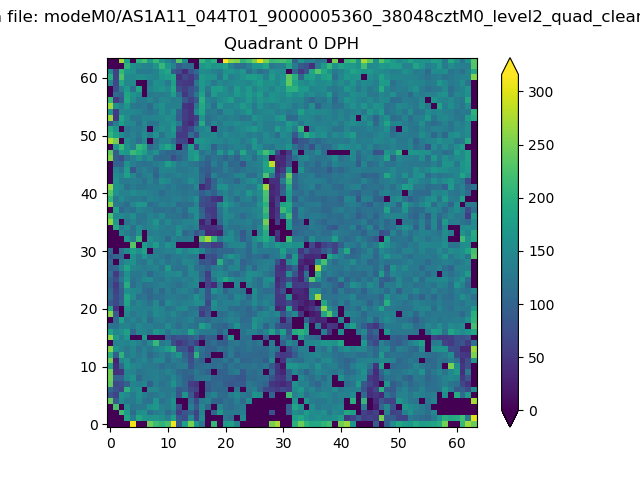 |
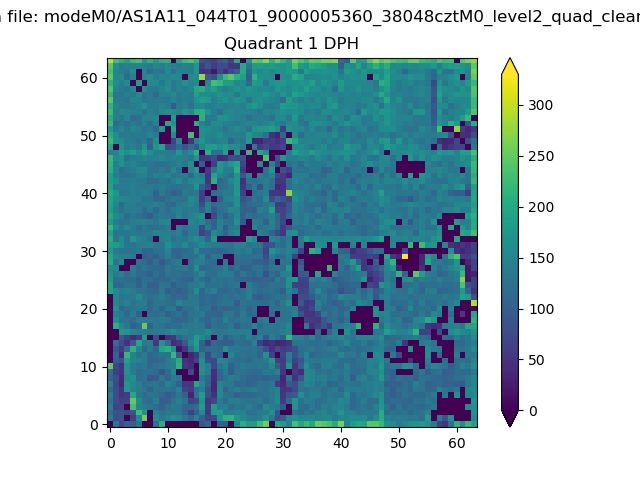 |
Quadrant B |
|---|---|---|---|
| Quadrant D | 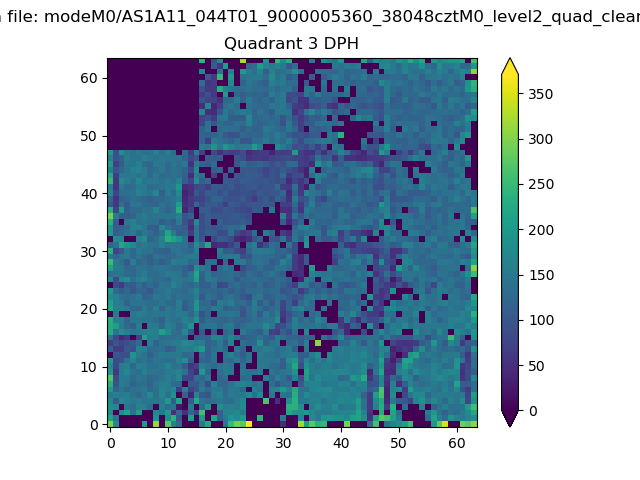 |
 |
Quadrant C |
| Plot type | Count rate plots | Images |
|---|---|---|
| Comparison with Poisson distribution Blue bars denote a histogram of data divided into 1 sec bins. Red curve is a Poisson curve with rate = median count rate of data. |
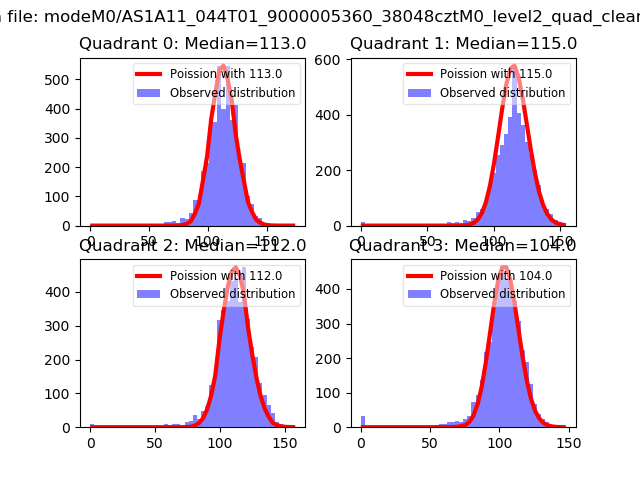 |
 |
| Quadrant-wise count rates Data is divided into 100 sec bins |
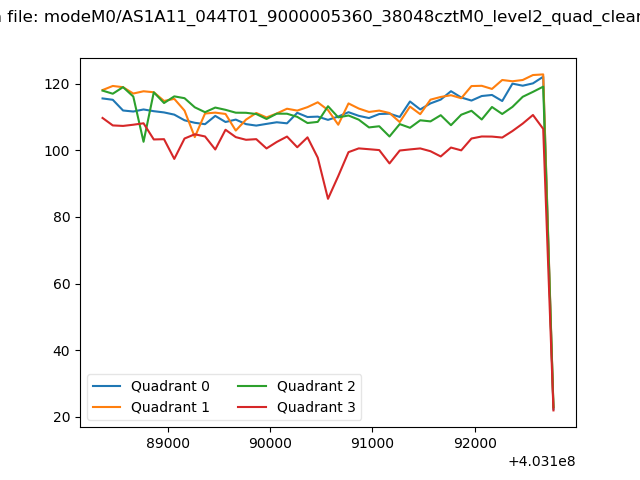 |
|
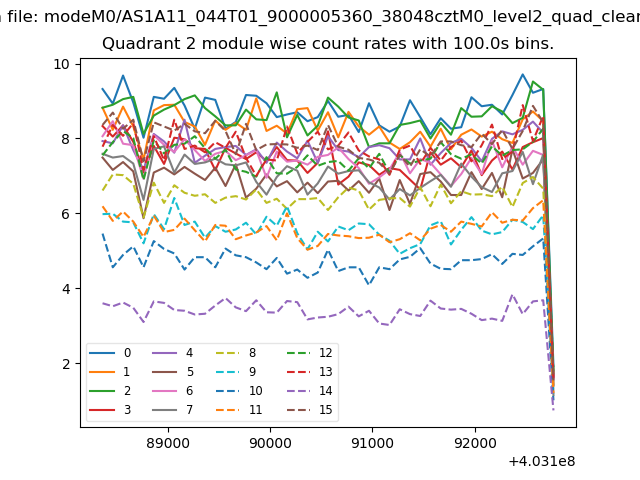
| Module-wise count rates for Quadrant A Data is divided into 100 sec bins |
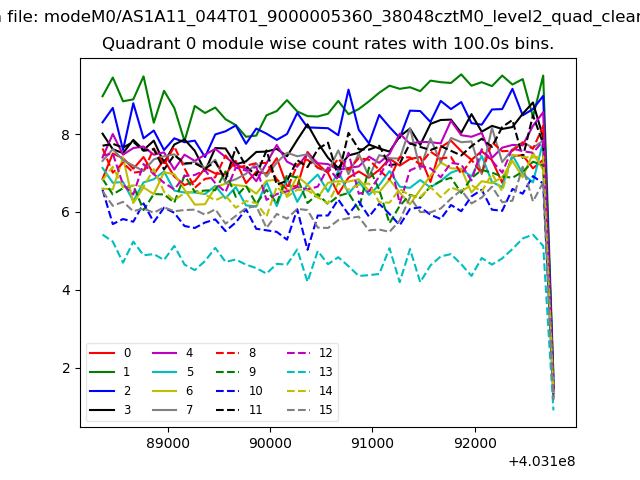 |
 |
| Module-wise count rates for Quadrant B Data is divided into 100 sec bins |
 |
 |
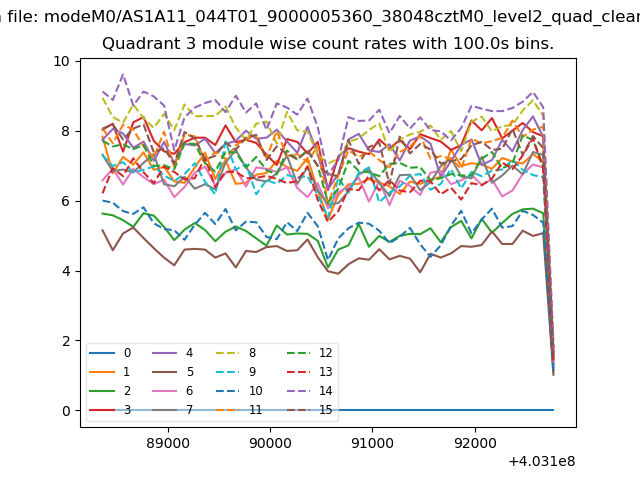
| Module-wise count rates for Quadrant C Data is divided into 100 sec bins |
 |
 |
| Module-wise count rates for Quadrant D Data is divided into 100 sec bins |
 |
 |
| Parameter | Plot |
|---|---|
| CZT HV Monitor | 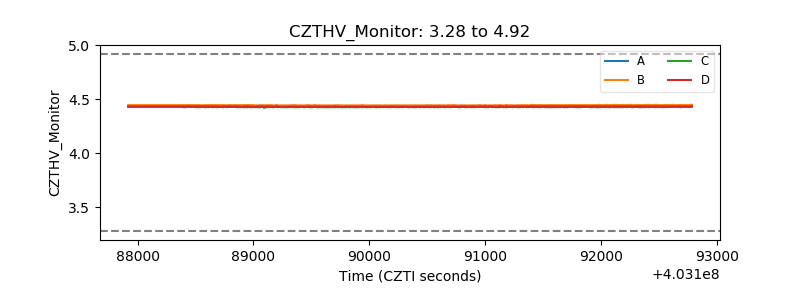 |
| D_VDD | 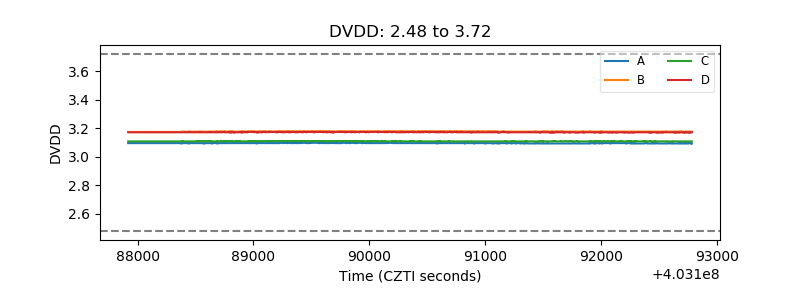 |
| Temperature 1 | 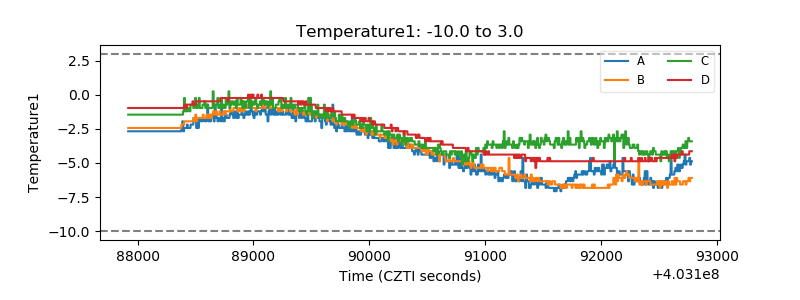 |
| Veto HV Monitor | 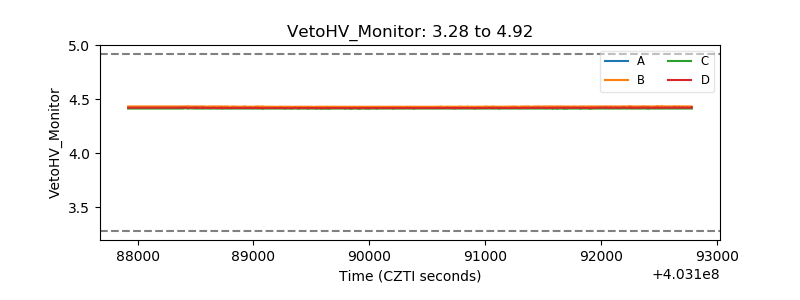 |
| Veto LLD | 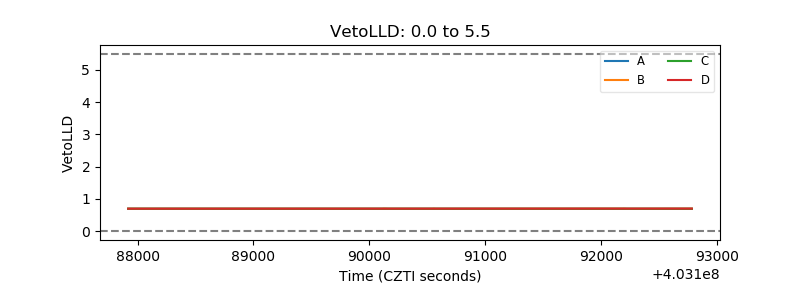 |
| Alpha Counter | 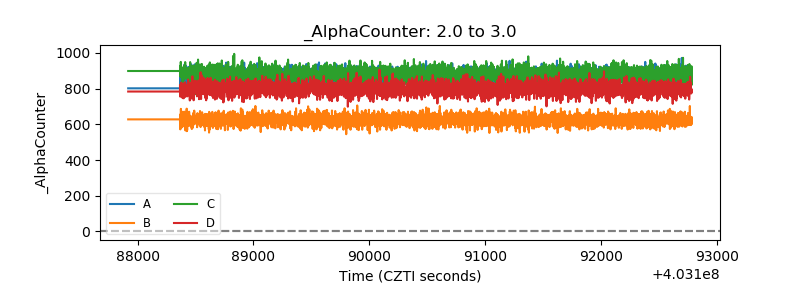 |
| _CPM_Rate | 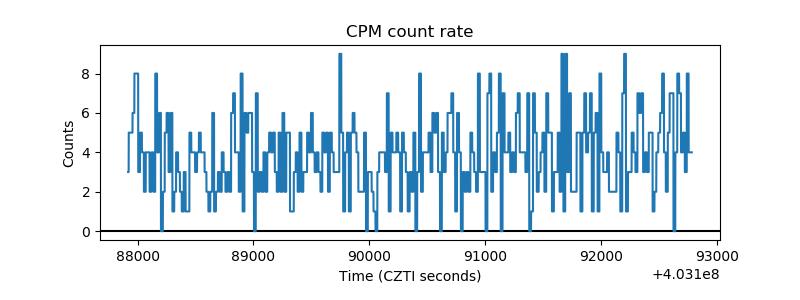 |
| CZT Counter | 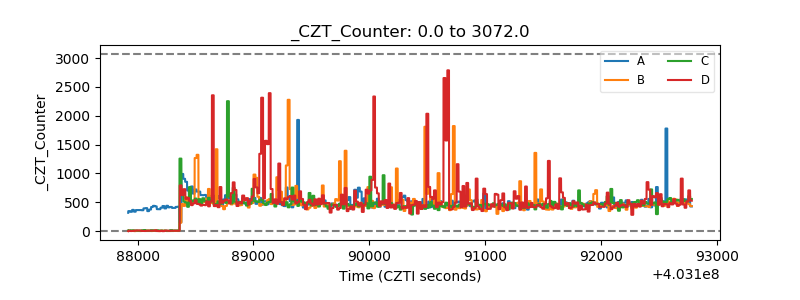 |
| +2.5 Volts monitor | 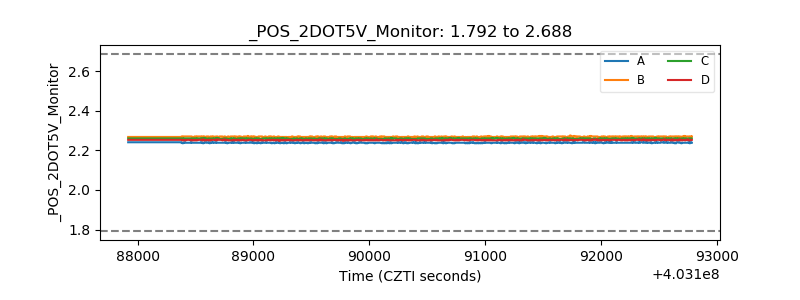 |
| +5 Volts monitor |  |
| _ROLL_ROT | 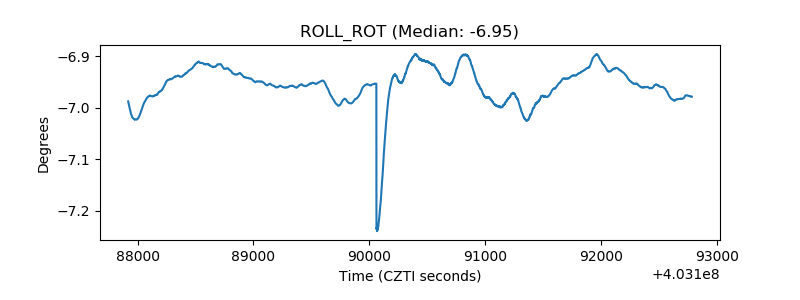 |
| _Roll_DEC | 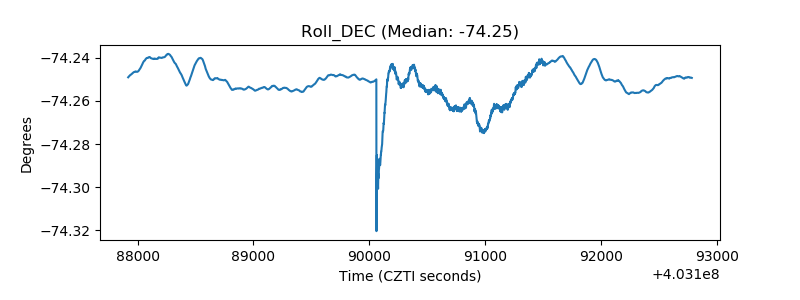 |
| _Roll_RA | 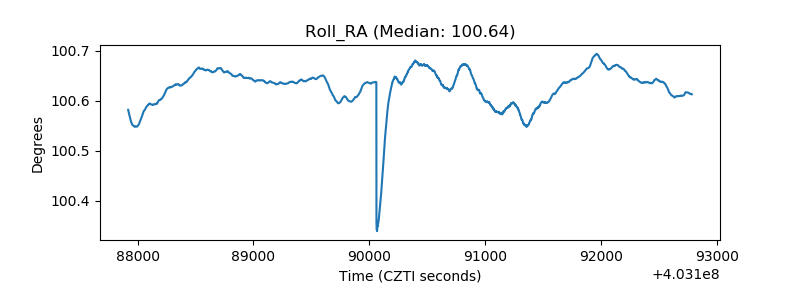 |
| Veto Counter | 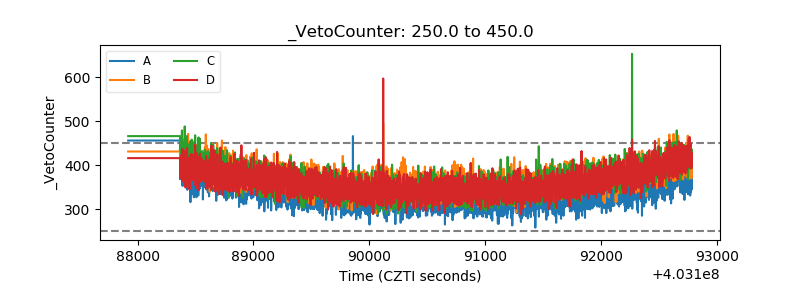 |