| Param | Original file | Final file |
|---|---|---|
| Filename | modeM0/AS1A11_044T01_9000005360_38050cztM0_level2.fits | modeM0/AS1A11_044T01_9000005360_38050cztM0_level2_quad_clean.evt |
| Size (bytes) | 735,027,840 | 198,023,040 |
| Size | 701.0 MB | 188.8 MB |
| Events in quadrant A | 6,072,241 | 1,338,701 |
| Events in quadrant B | 7,528,774 | 1,297,063 |
| Events in quadrant C | 5,858,323 | 1,331,456 |
| Events in quadrant D | 6,827,926 | 1,206,458 |
| Mode SS | |||
|---|---|---|---|
| Quadrant | BADHDUFLAG | Total packets | Discarded packets |
| A | 0 | 244 | 0 |
| B | 0 | 244 | 0 |
| C | 0 | 244 | 0 |
| D | 0 | 244 | 0 |
| Mode M9 | |||
|---|---|---|---|
| Quadrant | BADHDUFLAG | Total packets | Discarded packets |
| A | 0 | 41 | 0 |
| B | 0 | 41 | 0 |
| C | 0 | 41 | 0 |
| D | 0 | 41 | 0 |
| Mode M0 | |||
|---|---|---|---|
| Quadrant | BADHDUFLAG | Total packets | Discarded packets |
| A | 0 | 25243 | 4 |
| B | 0 | 30237 | 3 |
| C | 0 | 24546 | 3 |
| D | 0 | 28164 | 3 |
| Quadrant | Total seconds | Saturated seconds | Saturation percentage |
|---|---|---|---|
| A | 11881 | 34 | 0.286171% |
| B | 11881 | 601 | 5.058497% |
| C | 11881 | 18 | 0.151502% |
| D | 11881 | 114 | 0.959515% |
Noise dominated data is calculated using 1-second bins in cleaned event files. If a bin has >2000 counts, and if more than 50% of those come from <1% of pixels, then it is considered to be noise-dominated and hence unusable.
| Quadrant | # 1 sec bins | Bins with >0 counts | Bins with >2000 counts | High rate bins dominated by noise | Noise dominated (total time) | Noise dominated (detector-on time) | Marked lightcurve |
|---|---|---|---|---|---|---|---|
| A | 16059 | 11884 | 10 | 10 | 0.06% | 0.08% | 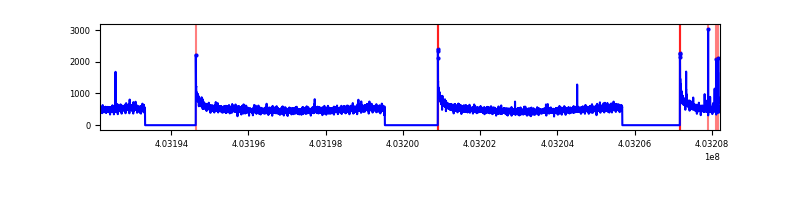 |
| B | 16059 | 11884 | 445 | 445 | 2.77% | 3.74% | 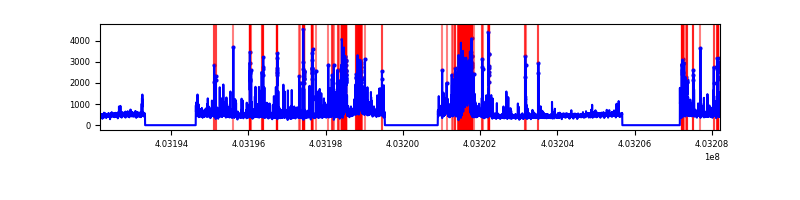 |
| C | 16059 | 11884 | 7 | 7 | 0.04% | 0.06% | 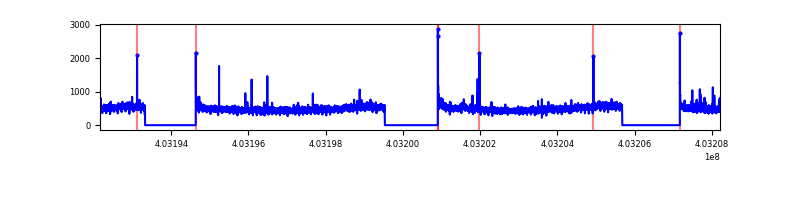 |
| D | 16059 | 11884 | 92 | 92 | 0.57% | 0.77% | 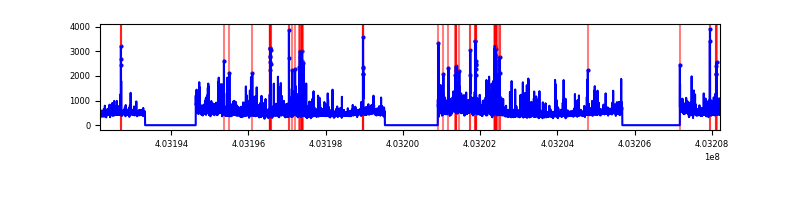 |
Top three noisy pixels from each quadrant. If the there are fewer than three noisy pixels in the level2.evt file, extra rows are filled as -1
| Pixel properties | Quadrant properties | ||||||
|---|---|---|---|---|---|---|---|
| Quadrant | DetID | PixID | Counts | Sigma | Mean | Median | Sigma |
| A | 10 | 83 | 763735 | 2805.82 | 1342 | 1315 | 271.7 |
| A | 12 | 189 | 45957 | 164.29 | 1342 | 1315 | 271.7 |
| A | 13 | 248 | 32128 | 113.4 | 1342 | 1315 | 271.7 |
| B | 5 | 184 | 839242 | 3352.91 | 1320 | 1282 | 249.9 |
| B | 4 | 171 | 755825 | 3019.13 | 1320 | 1282 | 249.9 |
| B | 5 | 172 | 206671 | 821.82 | 1320 | 1282 | 249.9 |
| C | 15 | 214 | 494764 | 1612.32 | 1324 | 1332 | 306.0 |
| C | 3 | 233 | 131003 | 423.71 | 1324 | 1332 | 306.0 |
| C | 1 | 23 | 32797 | 102.81 | 1324 | 1332 | 306.0 |
| D | 1 | 52 | 821157 | 2596.78 | 1311 | 1276 | 315.7 |
| D | 10 | 199 | 206462 | 649.88 | 1311 | 1276 | 315.7 |
| D | 2 | 250 | 145576 | 457.04 | 1311 | 1276 | 315.7 |
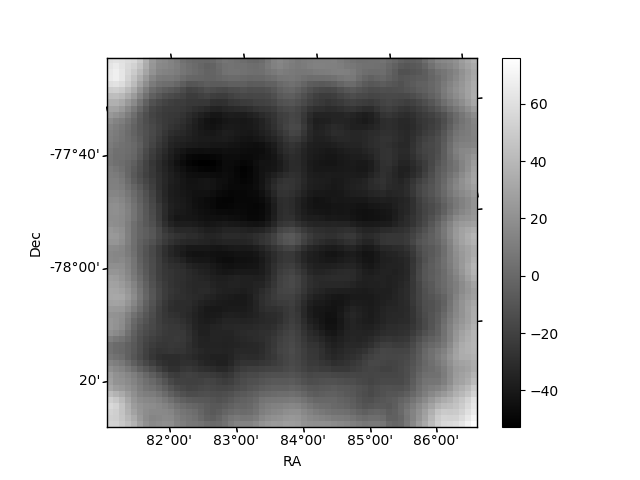
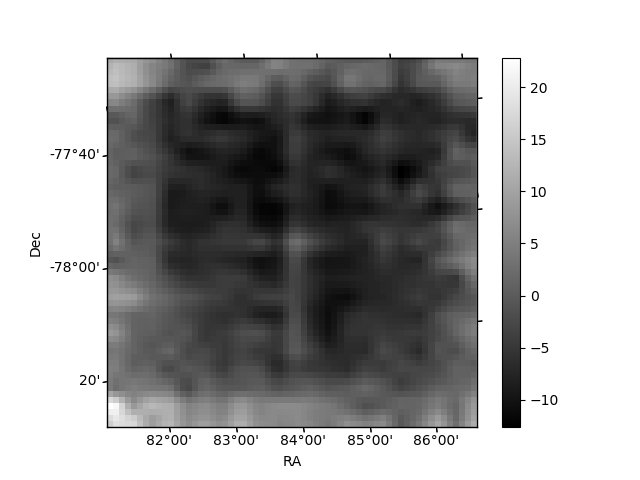
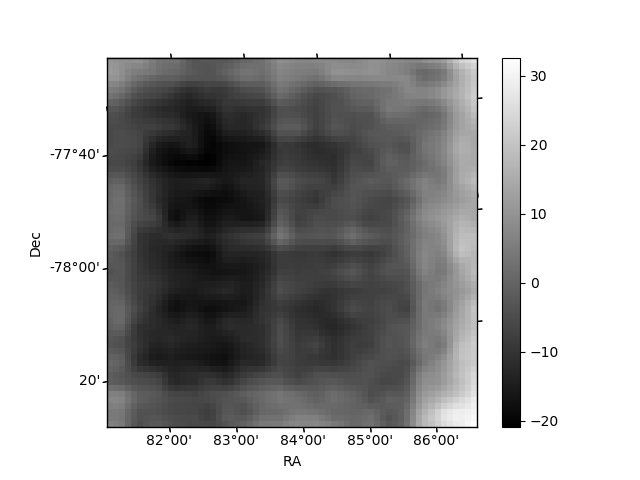
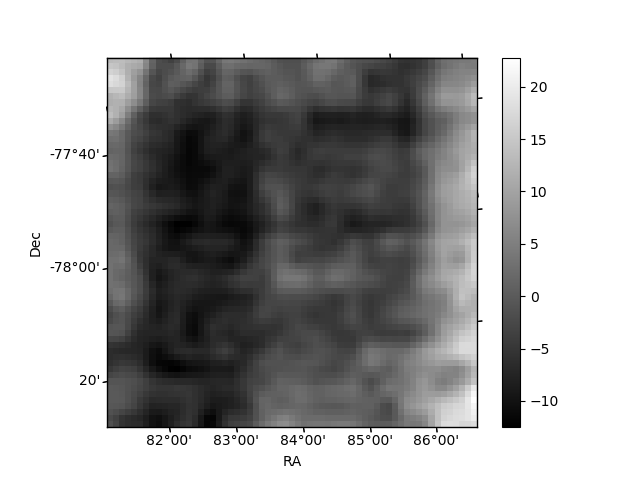
Histogram calculated using DETX and DETY for each event in the final _common_clean file
| Quadrant A | 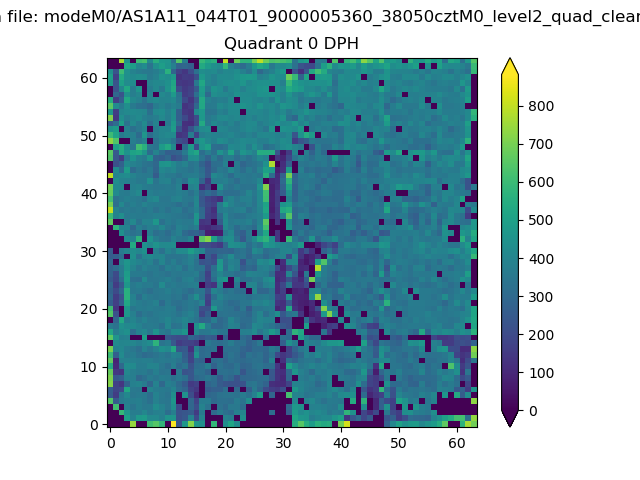 |
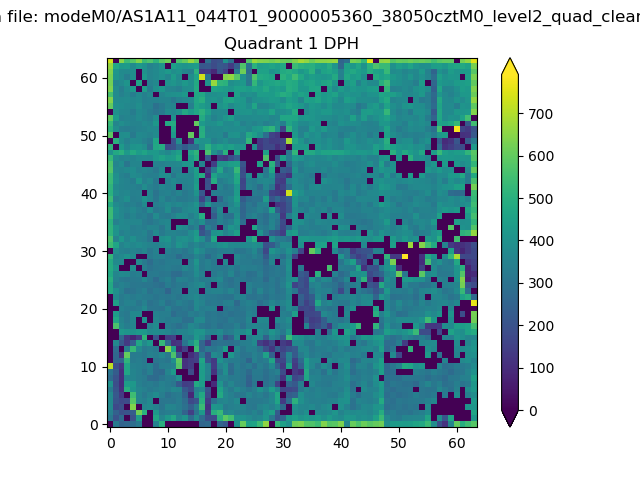 |
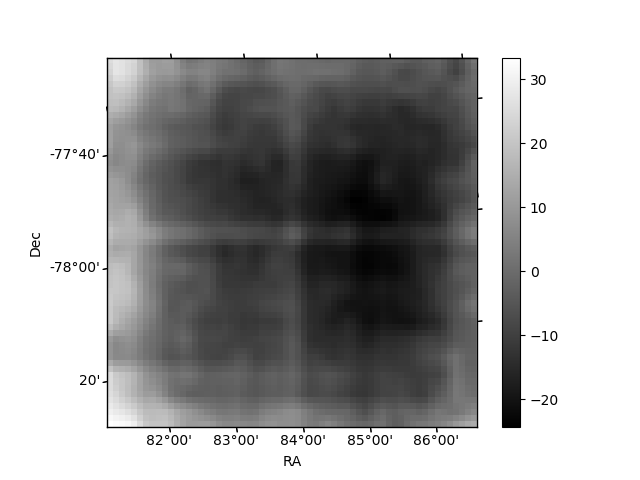
Quadrant B |
|---|---|---|---|
| Quadrant D | 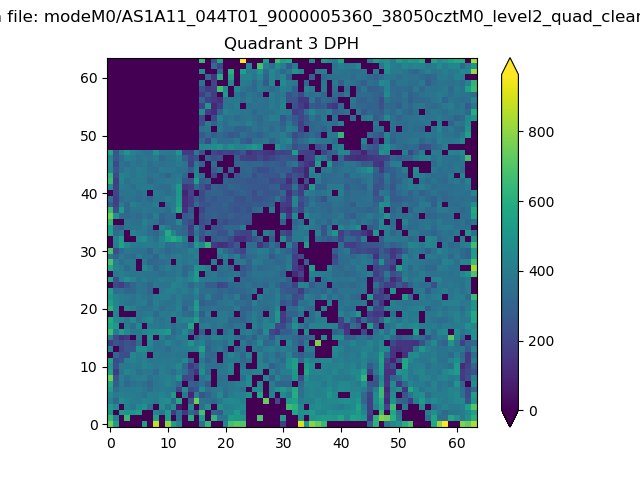 |
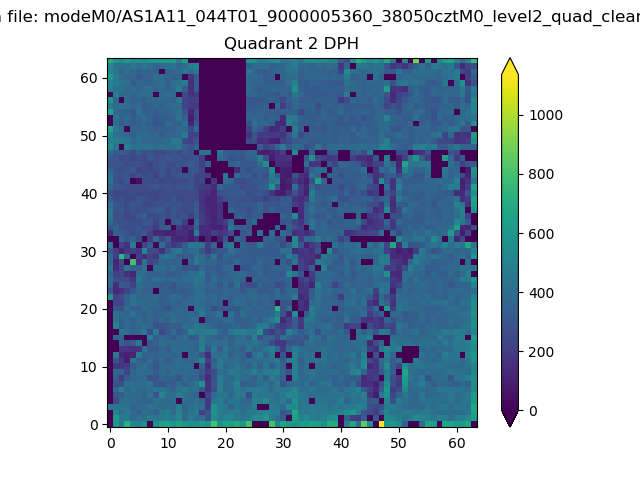 |
Quadrant C |
| Plot type | Count rate plots | Images |
|---|---|---|
| Comparison with Poisson distribution Blue bars denote a histogram of data divided into 1 sec bins. Red curve is a Poisson curve with rate = median count rate of data. |
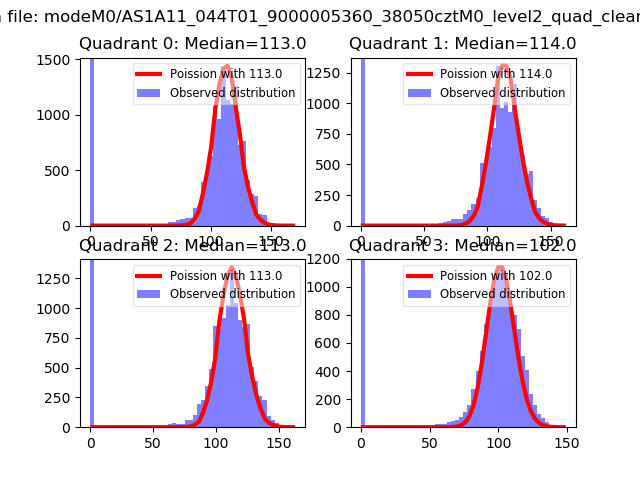 |
 |
| Quadrant-wise count rates Data is divided into 100 sec bins |
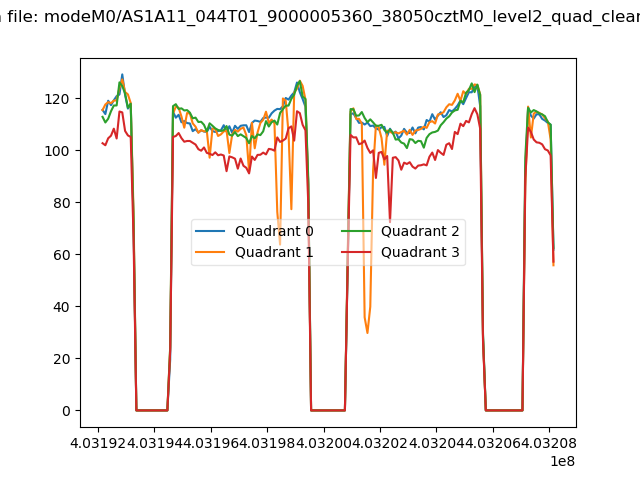 |
|
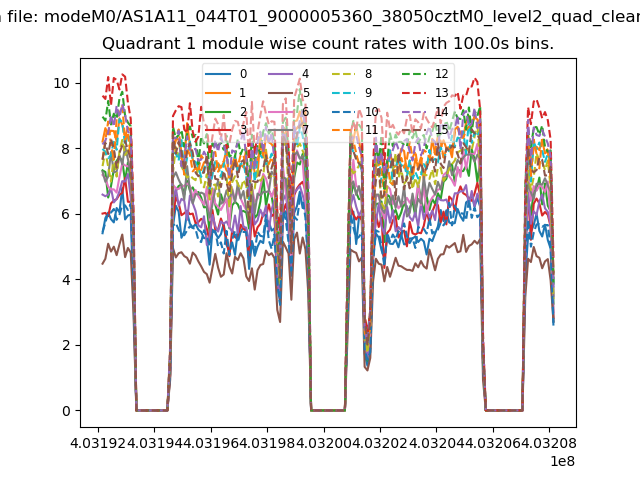
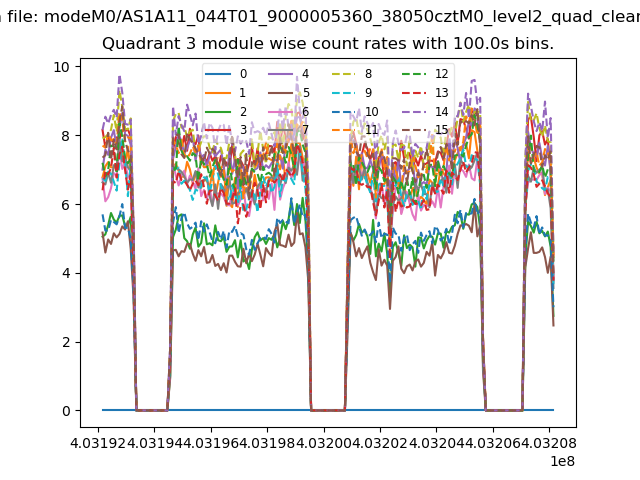
| Module-wise count rates for Quadrant A Data is divided into 100 sec bins |
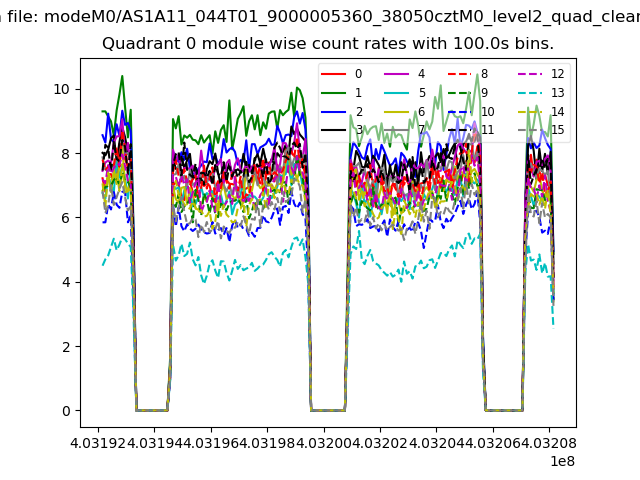 |
 |
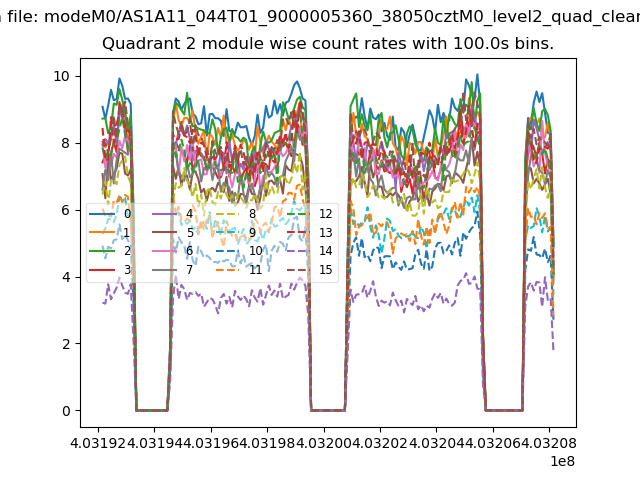
| Module-wise count rates for Quadrant B Data is divided into 100 sec bins |
 |
 |
| Module-wise count rates for Quadrant C Data is divided into 100 sec bins |
 |
 |
| Module-wise count rates for Quadrant D Data is divided into 100 sec bins |
 |
 |
| Parameter | Plot |
|---|---|
| CZT HV Monitor | 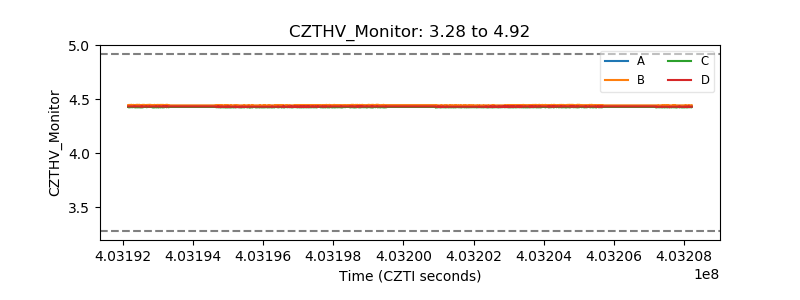 |
| D_VDD | 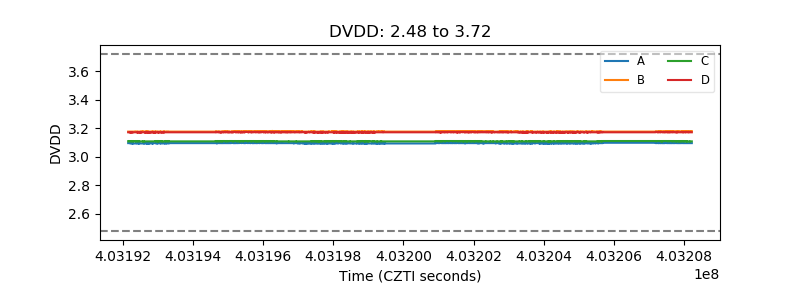 |
| Temperature 1 | 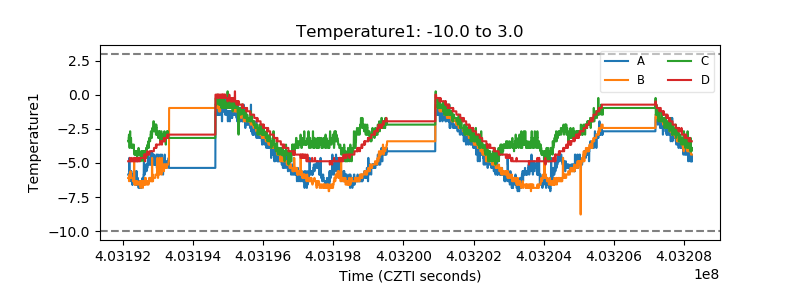 |
| Veto HV Monitor | 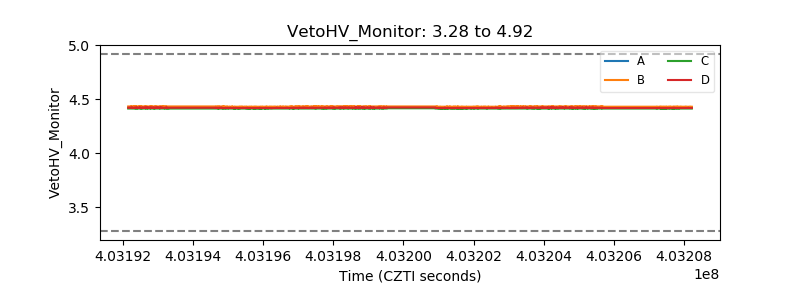 |
| Veto LLD | 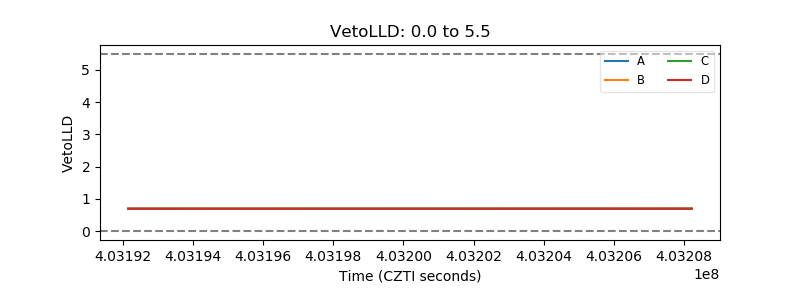 |
| Alpha Counter | 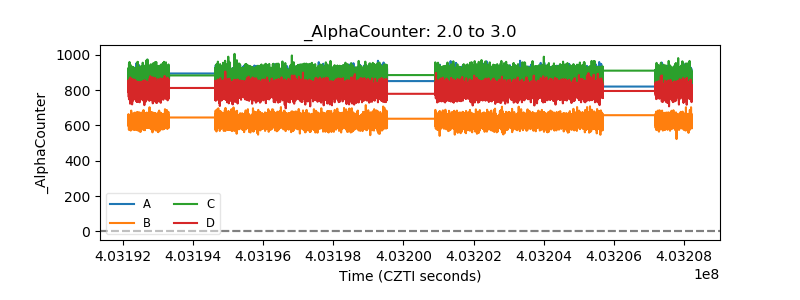 |
| _CPM_Rate | 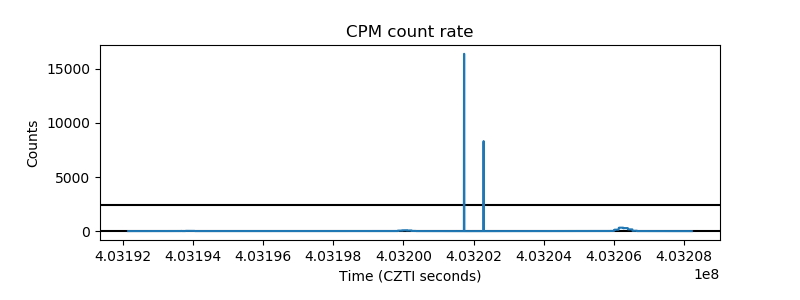 |
| CZT Counter | 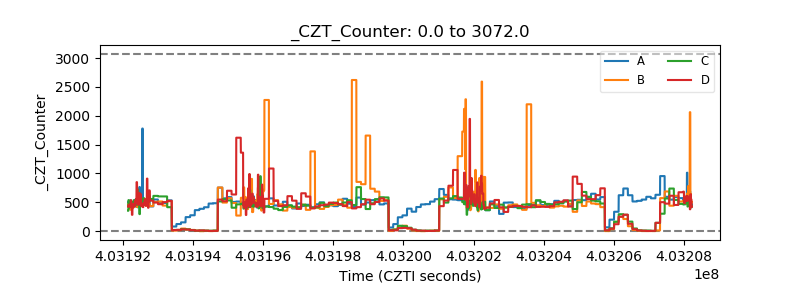 |
| +2.5 Volts monitor | 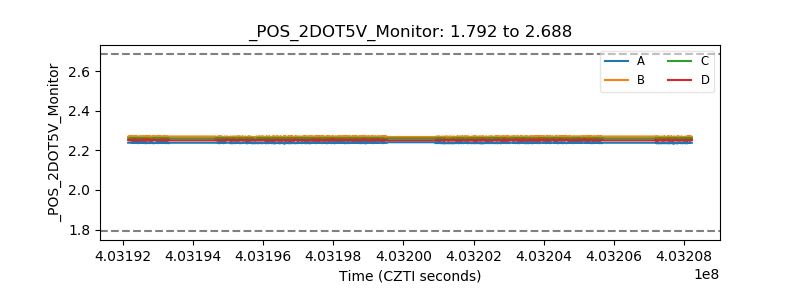 |
| +5 Volts monitor | 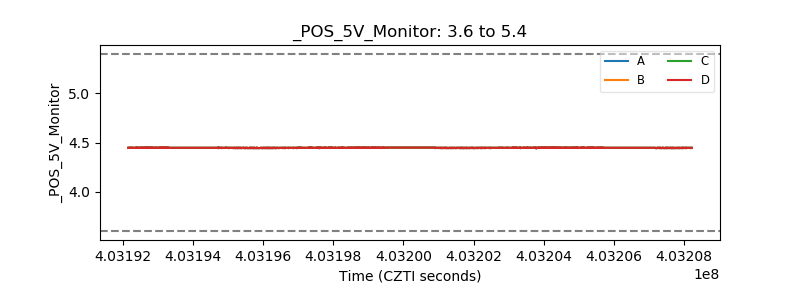 |
| _ROLL_ROT | 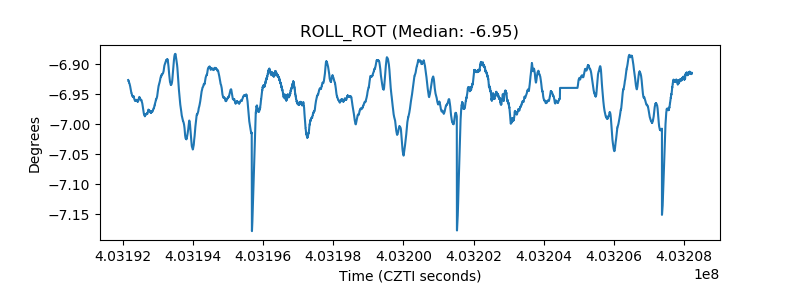 |
| _Roll_DEC | 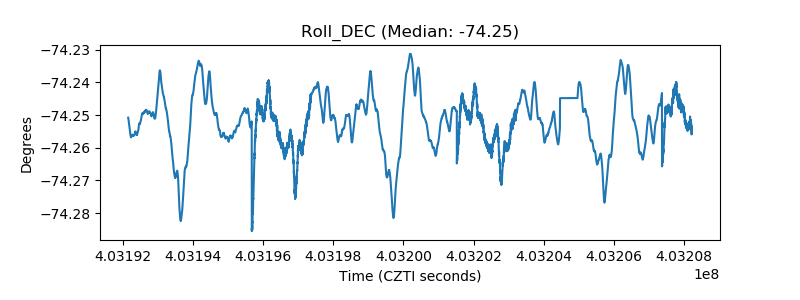 |
| _Roll_RA | 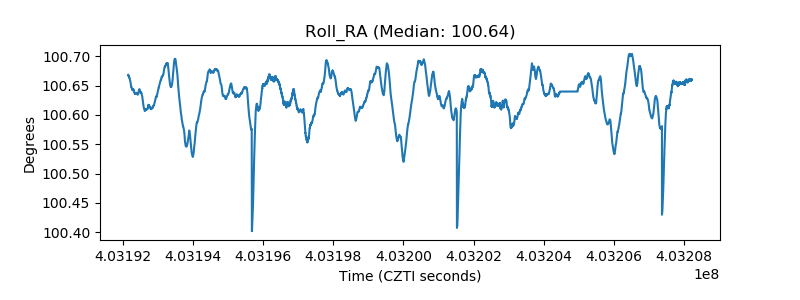 |
| Veto Counter | 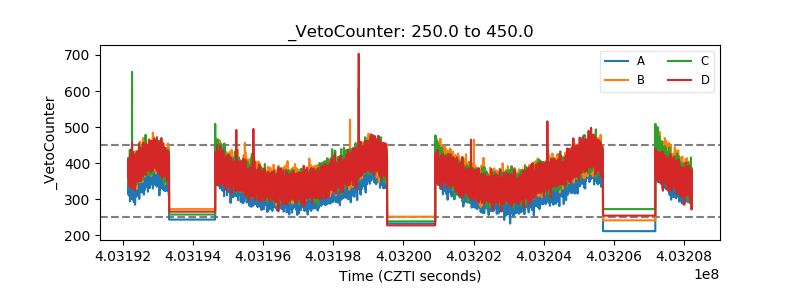 |