| Param | Original file | Final file |
|---|---|---|
| Filename | modeM0/AS1A11_044T01_9000005360_38051cztM0_level2.fits | modeM0/AS1A11_044T01_9000005360_38051cztM0_level2_quad_clean.evt |
| Size (bytes) | 339,672,960 | 96,393,600 |
| Size | 323.9 MB | 91.9 MB |
| Events in quadrant A | 2,949,254 | 645,512 |
| Events in quadrant B | 3,287,496 | 655,107 |
| Events in quadrant C | 2,767,127 | 640,206 |
| Events in quadrant D | 3,129,183 | 582,272 |
| Mode SS | |||
|---|---|---|---|
| Quadrant | BADHDUFLAG | Total packets | Discarded packets |
| A | 0 | 116 | 0 |
| B | 0 | 116 | 0 |
| C | 0 | 116 | 0 |
| D | 0 | 116 | 0 |
| Mode M9 | |||
|---|---|---|---|
| Quadrant | BADHDUFLAG | Total packets | Discarded packets |
| A | 0 | 17 | 0 |
| B | 0 | 17 | 0 |
| C | 0 | 17 | 0 |
| D | 0 | 18 | 0 |
| Mode M0 | |||
|---|---|---|---|
| Quadrant | BADHDUFLAG | Total packets | Discarded packets |
| A | 0 | 12367 | 3 |
| B | 0 | 13512 | 2 |
| C | 0 | 11675 | 2 |
| D | 0 | 13053 | 2 |
| Quadrant | Total seconds | Saturated seconds | Saturation percentage |
|---|---|---|---|
| A | 5655 | 30 | 0.530504% |
| B | 5655 | 148 | 2.617153% |
| C | 5655 | 10 | 0.176835% |
| D | 5655 | 67 | 1.184792% |
Noise dominated data is calculated using 1-second bins in cleaned event files. If a bin has >2000 counts, and if more than 50% of those come from <1% of pixels, then it is considered to be noise-dominated and hence unusable.
| Quadrant | # 1 sec bins | Bins with >0 counts | Bins with >2000 counts | High rate bins dominated by noise | Noise dominated (total time) | Noise dominated (detector-on time) | Marked lightcurve |
|---|---|---|---|---|---|---|---|
| A | 7237 | 5656 | 10 | 10 | 0.14% | 0.18% | 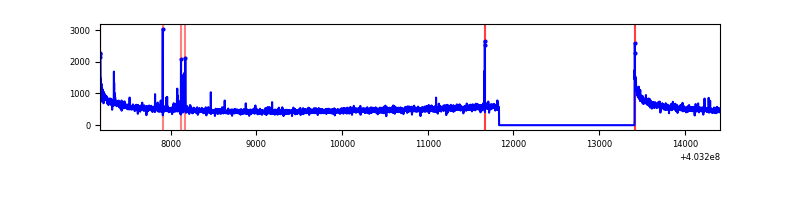 |
| B | 7237 | 5656 | 86 | 86 | 1.19% | 1.52% | 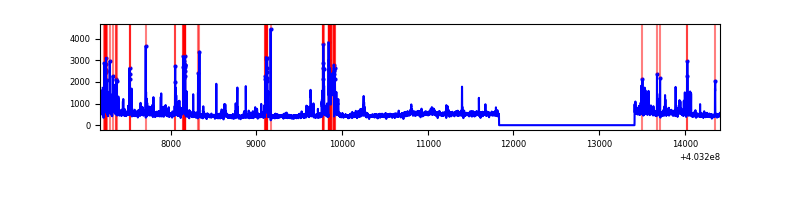 |
| C | 7237 | 5656 | 4 | 4 | 0.06% | 0.07% | 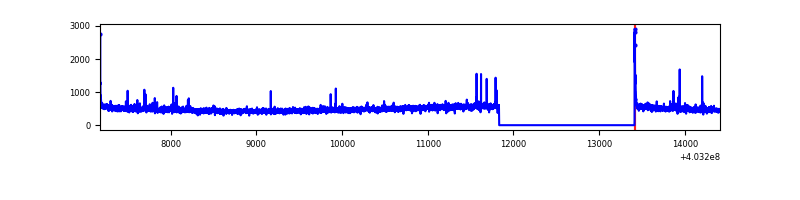 |
| D | 7237 | 5656 | 49 | 49 | 0.68% | 0.87% | 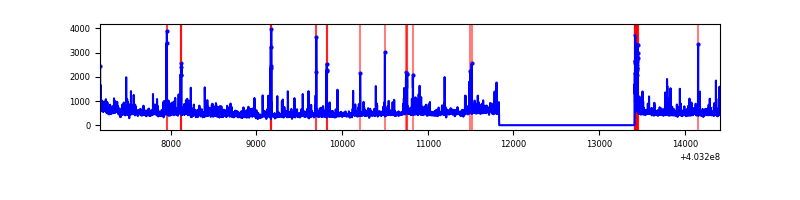 |
Top three noisy pixels from each quadrant. If the there are fewer than three noisy pixels in the level2.evt file, extra rows are filled as -1
| Pixel properties | Quadrant properties | ||||||
|---|---|---|---|---|---|---|---|
| Quadrant | DetID | PixID | Counts | Sigma | Mean | Median | Sigma |
| A | 10 | 83 | 402724 | 3108.35 | 635 | 624 | 129.4 |
| A | 13 | 248 | 33549 | 254.52 | 635 | 624 | 129.4 |
| A | 12 | 189 | 22118 | 166.15 | 635 | 624 | 129.4 |
| B | 5 | 184 | 233087 | 1927.98 | 633 | 616 | 120.6 |
| B | 5 | 172 | 139217 | 1149.47 | 633 | 616 | 120.6 |
| B | 4 | 81 | 100276 | 826.52 | 633 | 616 | 120.6 |
| C | 15 | 214 | 236500 | 1632.14 | 622 | 627 | 144.5 |
| C | 3 | 233 | 46708 | 318.86 | 622 | 627 | 144.5 |
| C | 1 | 23 | 30021 | 203.39 | 622 | 627 | 144.5 |
| D | 1 | 52 | 276125 | 1855.91 | 616 | 599 | 148.5 |
| D | 12 | 233 | 103211 | 691.18 | 616 | 599 | 148.5 |
| D | 10 | 199 | 85765 | 573.67 | 616 | 599 | 148.5 |
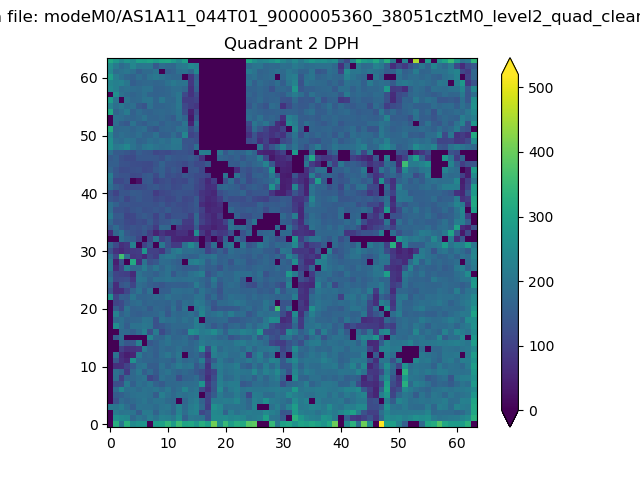
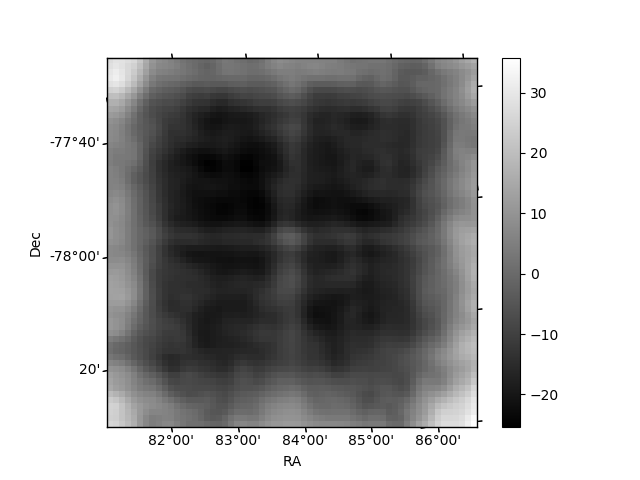
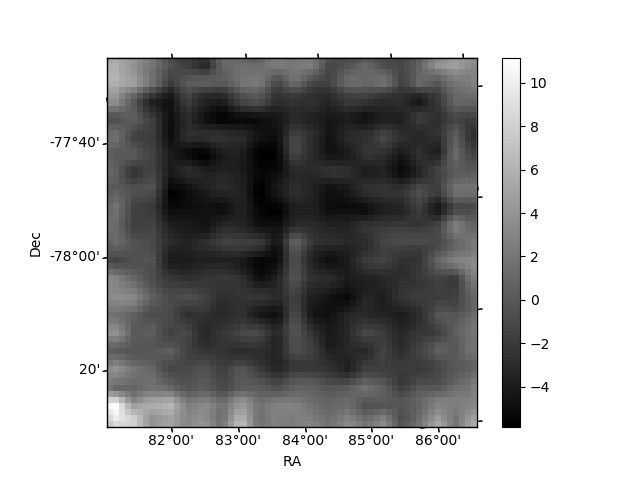
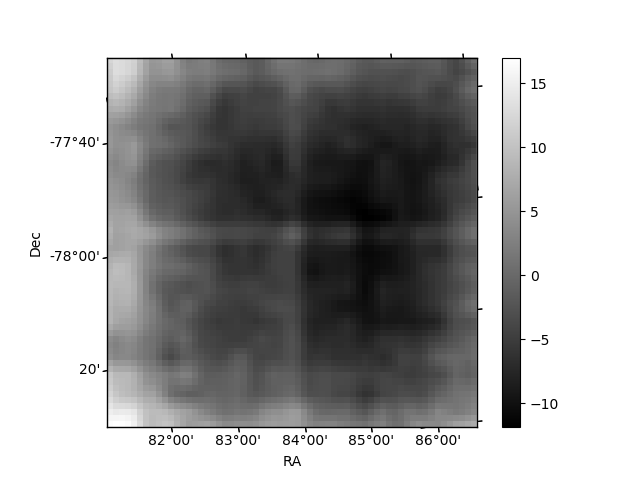
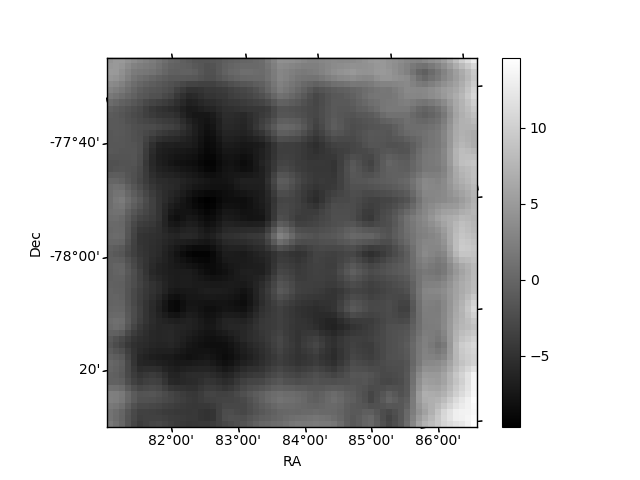
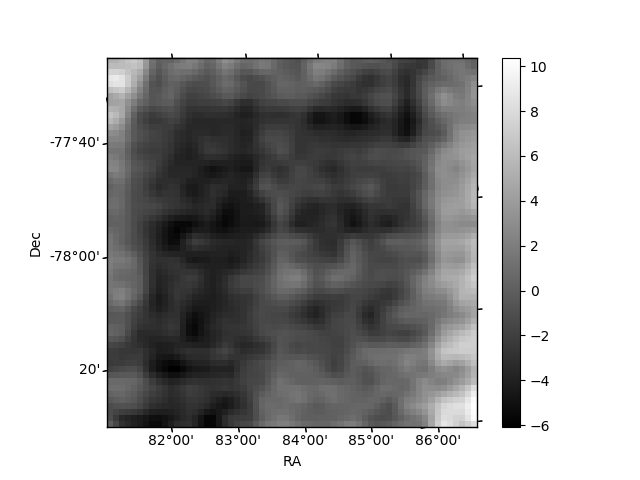
Histogram calculated using DETX and DETY for each event in the final _common_clean file
| Quadrant A | 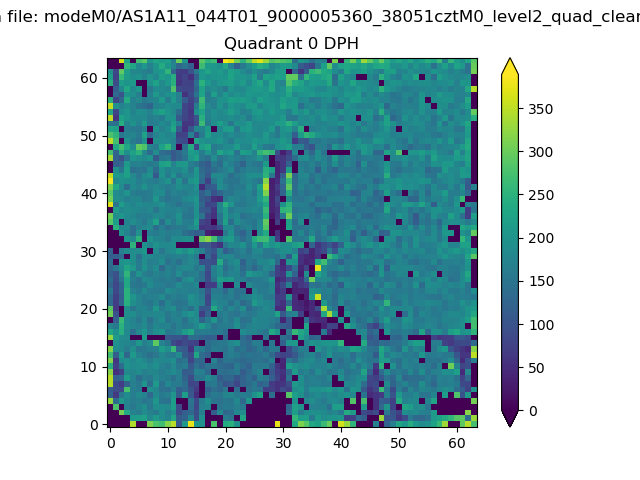 |
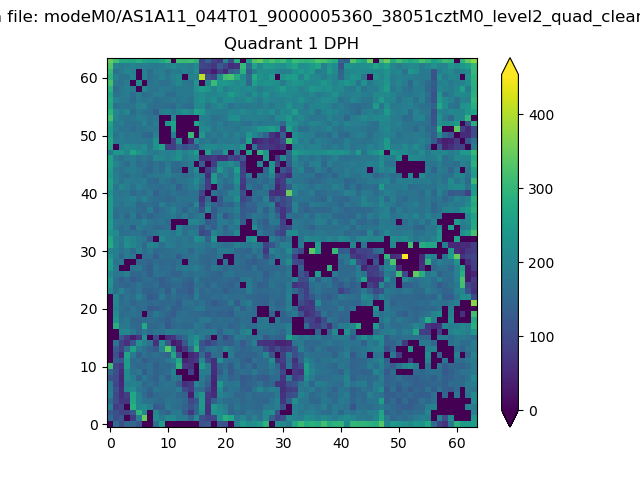 |
Quadrant B |
|---|---|---|---|
| Quadrant D | 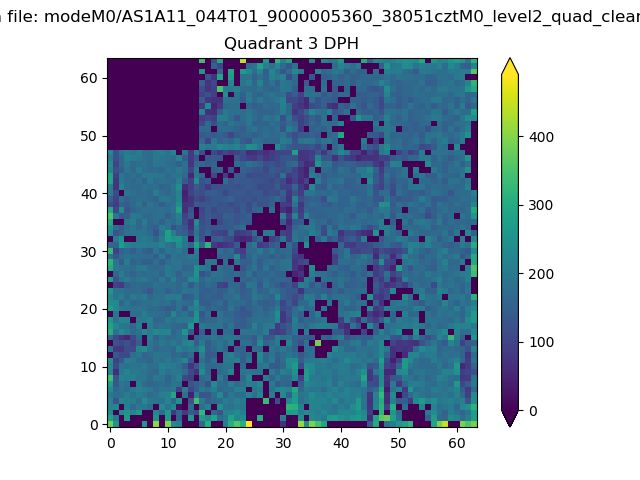 |
 |
Quadrant C |
| Plot type | Count rate plots | Images |
|---|---|---|
| Comparison with Poisson distribution Blue bars denote a histogram of data divided into 1 sec bins. Red curve is a Poisson curve with rate = median count rate of data. |
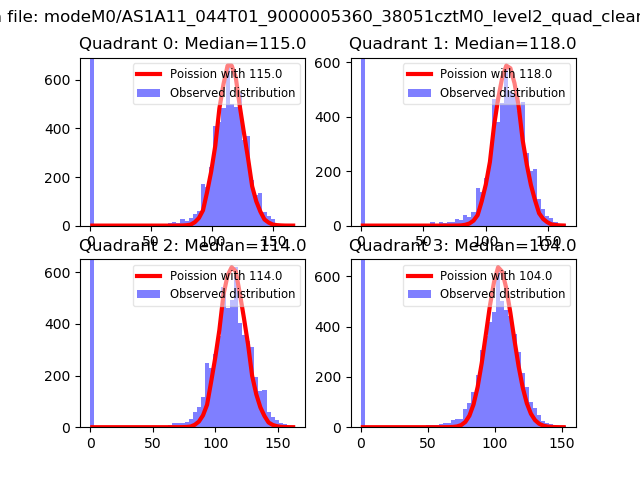 |
 |
| Quadrant-wise count rates Data is divided into 100 sec bins |
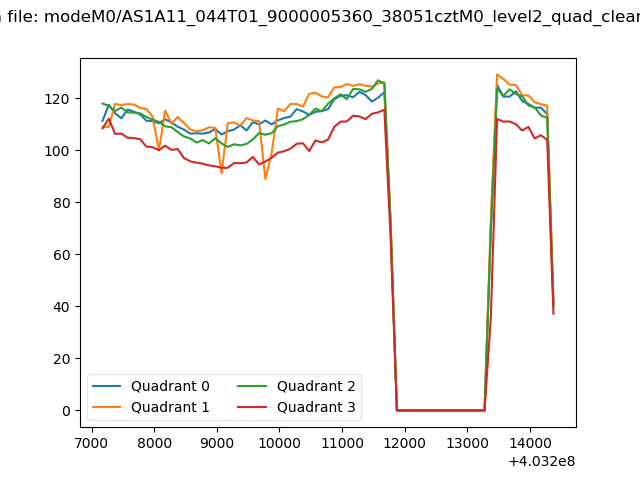 |
|
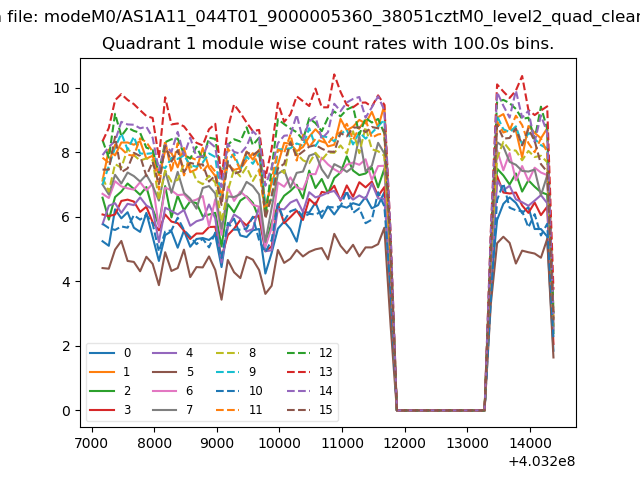
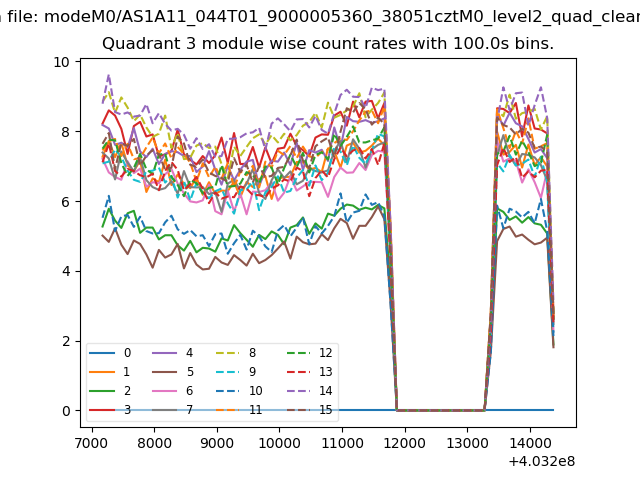
| Module-wise count rates for Quadrant A Data is divided into 100 sec bins |
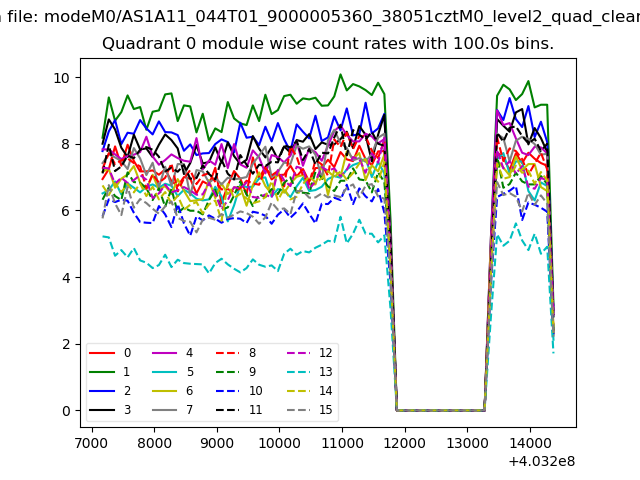 |
 |
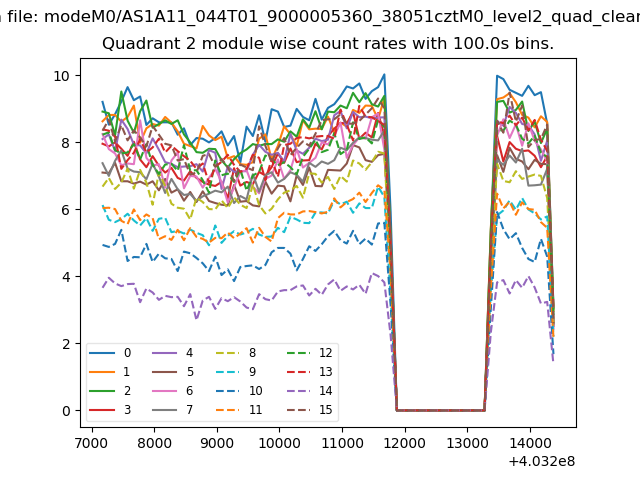
| Module-wise count rates for Quadrant B Data is divided into 100 sec bins |
 |
 |
| Module-wise count rates for Quadrant C Data is divided into 100 sec bins |
 |
 |
| Module-wise count rates for Quadrant D Data is divided into 100 sec bins |
 |
 |
| Parameter | Plot |
|---|---|
| CZT HV Monitor |  |
| D_VDD | 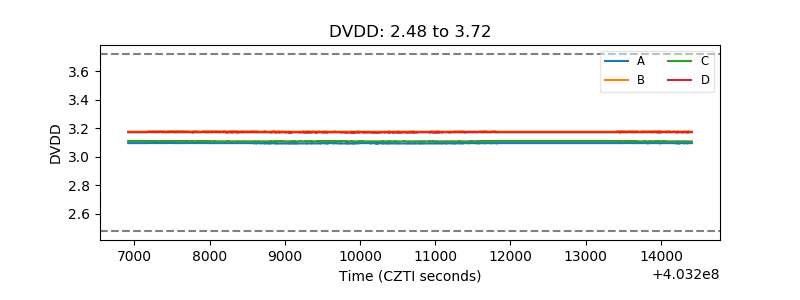 |
| Temperature 1 |  |
| Veto HV Monitor | 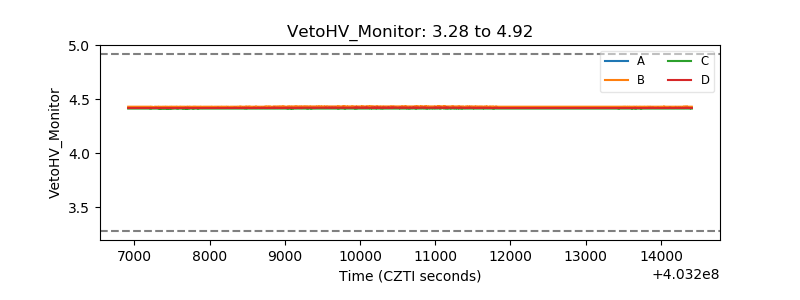 |
| Veto LLD | 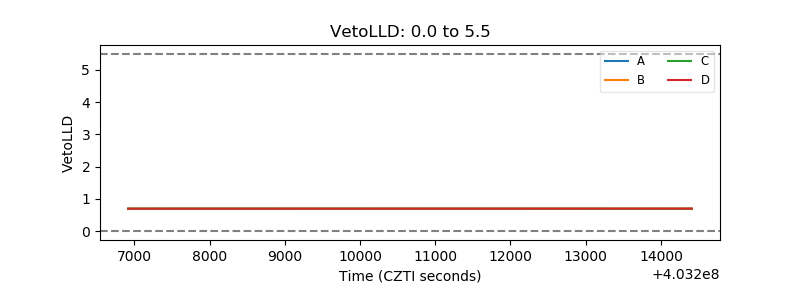 |
| Alpha Counter |  |
| _CPM_Rate | 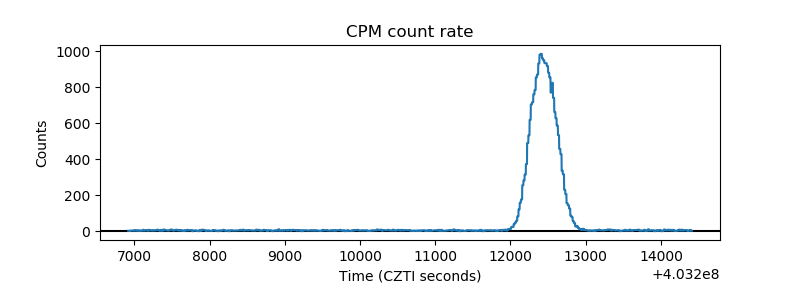 |
| CZT Counter | 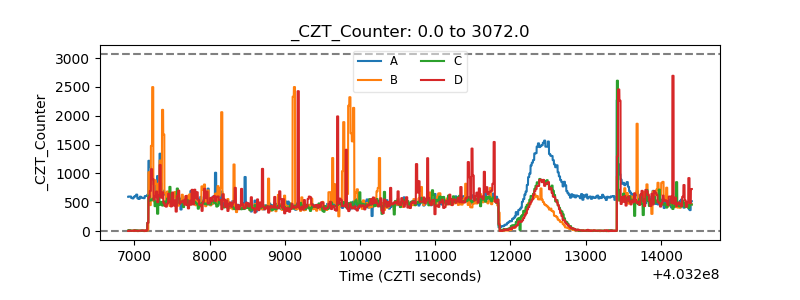 |
| +2.5 Volts monitor | 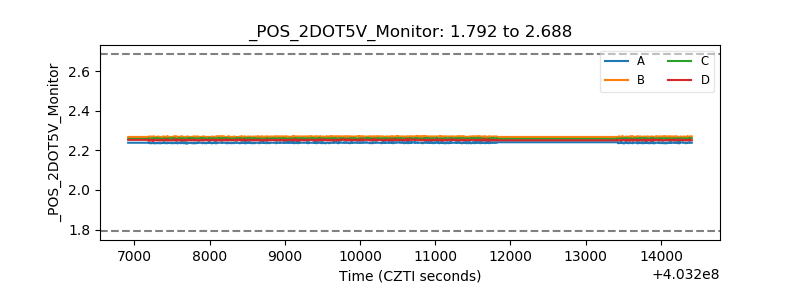 |
| +5 Volts monitor | 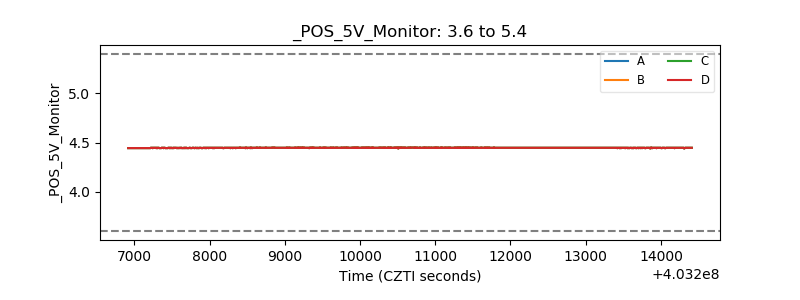 |
| _ROLL_ROT | 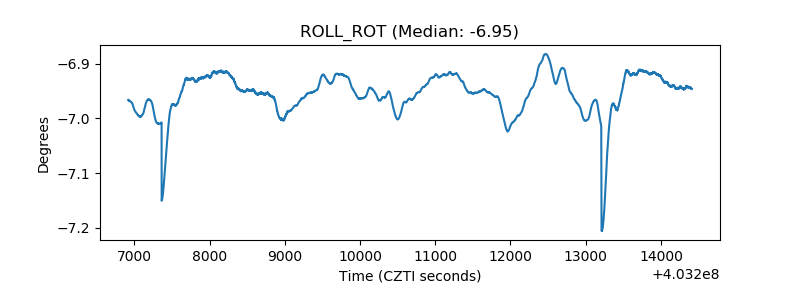 |
| _Roll_DEC | 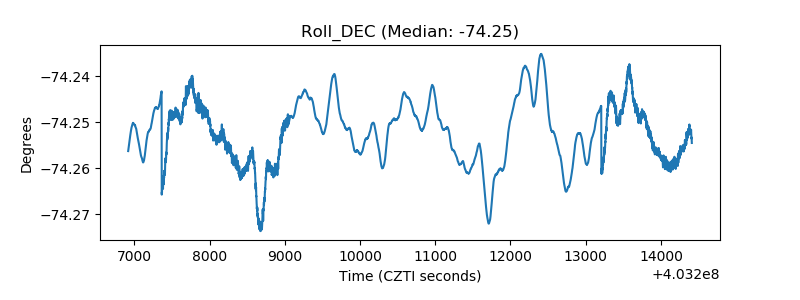 |
| _Roll_RA | 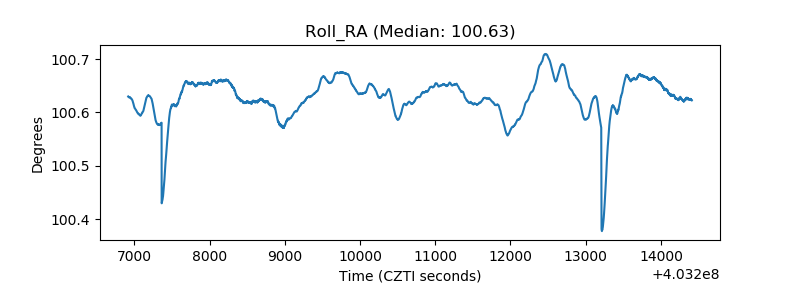 |
| Veto Counter | 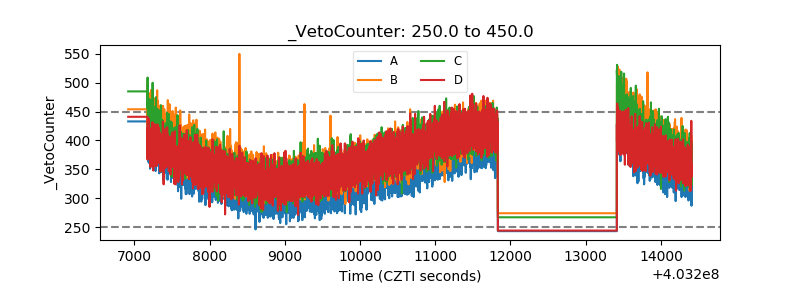 |