| Param | Original file | Final file |
|---|---|---|
| Filename | modeM0/AS1A11_044T01_9000005360_38052cztM0_level2.fits | modeM0/AS1A11_044T01_9000005360_38052cztM0_level2_quad_clean.evt |
| Size (bytes) | 333,031,680 | 95,846,400 |
| Size | 317.6 MB | 91.4 MB |
| Events in quadrant A | 2,871,931 | 647,427 |
| Events in quadrant B | 3,173,114 | 654,825 |
| Events in quadrant C | 2,724,240 | 637,542 |
| Events in quadrant D | 3,129,794 | 576,783 |
| Mode SS | |||
|---|---|---|---|
| Quadrant | BADHDUFLAG | Total packets | Discarded packets |
| A | 0 | 114 | 0 |
| B | 0 | 114 | 0 |
| C | 0 | 114 | 0 |
| D | 0 | 114 | 0 |
| Mode M9 | |||
|---|---|---|---|
| Quadrant | BADHDUFLAG | Total packets | Discarded packets |
| A | 0 | 21 | 0 |
| B | 0 | 21 | 0 |
| C | 0 | 21 | 0 |
| D | 0 | 22 | 0 |
| Mode M0 | |||
|---|---|---|---|
| Quadrant | BADHDUFLAG | Total packets | Discarded packets |
| A | 0 | 11998 | 3 |
| B | 0 | 13162 | 2 |
| C | 0 | 11404 | 2 |
| D | 0 | 12961 | 2 |
| Quadrant | Total seconds | Saturated seconds | Saturation percentage |
|---|---|---|---|
| A | 5503 | 21 | 0.381610% |
| B | 5503 | 151 | 2.743958% |
| C | 5503 | 11 | 0.199891% |
| D | 5503 | 124 | 2.253316% |
Noise dominated data is calculated using 1-second bins in cleaned event files. If a bin has >2000 counts, and if more than 50% of those come from <1% of pixels, then it is considered to be noise-dominated and hence unusable.
| Quadrant | # 1 sec bins | Bins with >0 counts | Bins with >2000 counts | High rate bins dominated by noise | Noise dominated (total time) | Noise dominated (detector-on time) | Marked lightcurve |
|---|---|---|---|---|---|---|---|
| A | 7206 | 5504 | 6 | 6 | 0.08% | 0.11% | 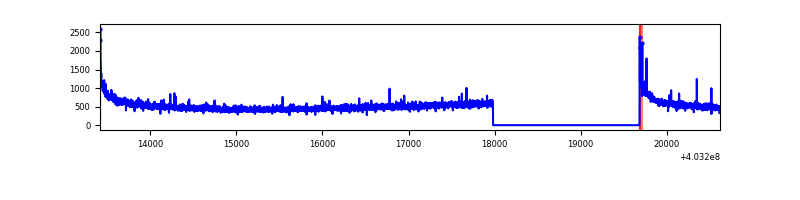 |
| B | 7206 | 5504 | 93 | 93 | 1.29% | 1.69% | 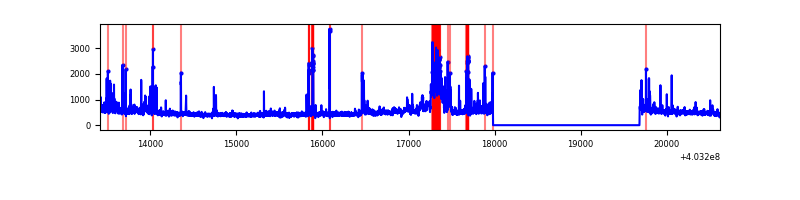 |
| C | 7206 | 5504 | 5 | 5 | 0.07% | 0.09% | 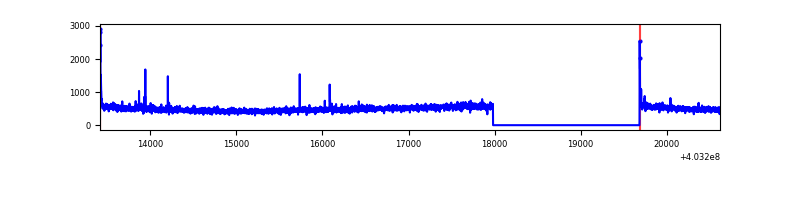 |
| D | 7206 | 5504 | 99 | 99 | 1.37% | 1.80% | 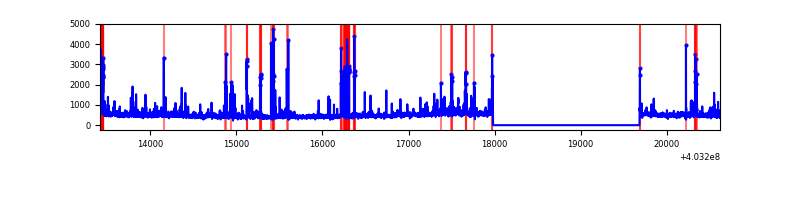 |
Top three noisy pixels from each quadrant. If the there are fewer than three noisy pixels in the level2.evt file, extra rows are filled as -1
| Pixel properties | Quadrant properties | ||||||
|---|---|---|---|---|---|---|---|
| Quadrant | DetID | PixID | Counts | Sigma | Mean | Median | Sigma |
| A | 10 | 83 | 391733 | 3110.36 | 625 | 614 | 125.7 |
| A | 12 | 189 | 15208 | 116.06 | 625 | 614 | 125.7 |
| A | 13 | 6 | 14397 | 109.61 | 625 | 614 | 125.7 |
| B | 5 | 184 | 435574 | 3684.26 | 623 | 607 | 118.1 |
| B | 4 | 171 | 106339 | 895.57 | 623 | 607 | 118.1 |
| B | 5 | 172 | 73837 | 620.27 | 623 | 607 | 118.1 |
| C | 15 | 214 | 230303 | 1601.66 | 615 | 619 | 143.4 |
| C | 3 | 233 | 52592 | 362.42 | 615 | 619 | 143.4 |
| C | 0 | 10 | 22490 | 152.51 | 615 | 619 | 143.4 |
| D | 13 | 249 | 222431 | 1511.1 | 604 | 586 | 146.8 |
| D | 12 | 233 | 176368 | 1197.34 | 604 | 586 | 146.8 |
| D | 1 | 52 | 72908 | 492.62 | 604 | 586 | 146.8 |
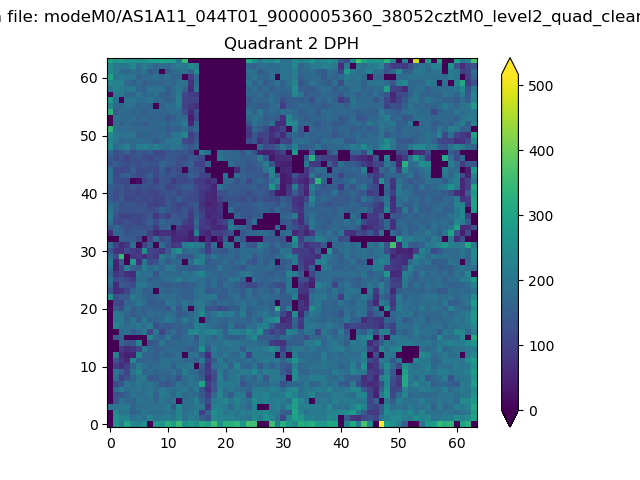
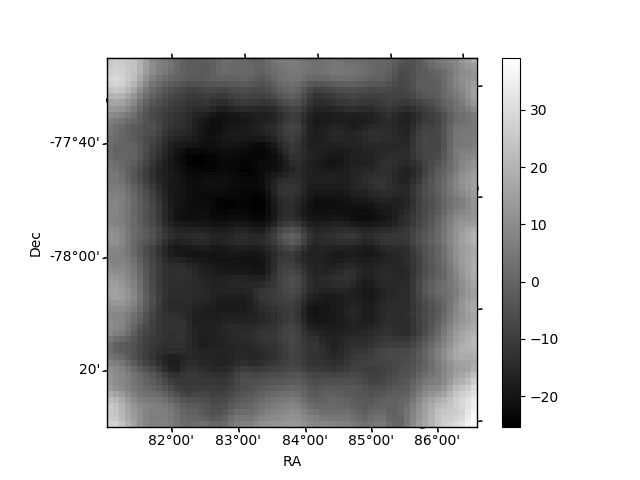
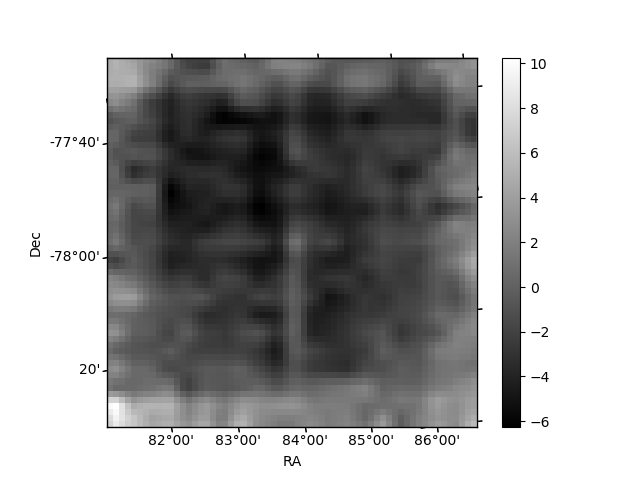
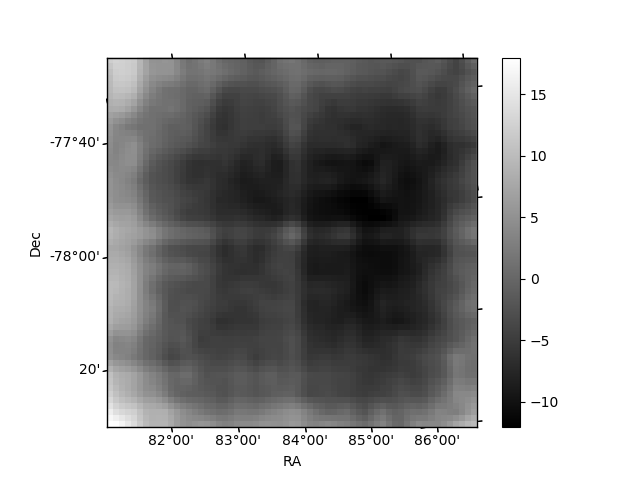
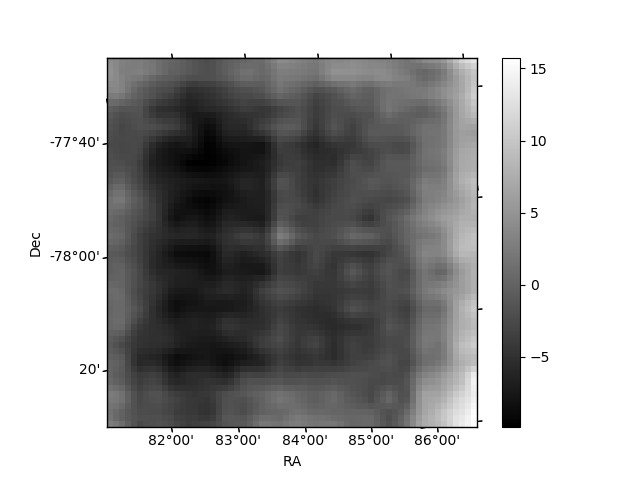
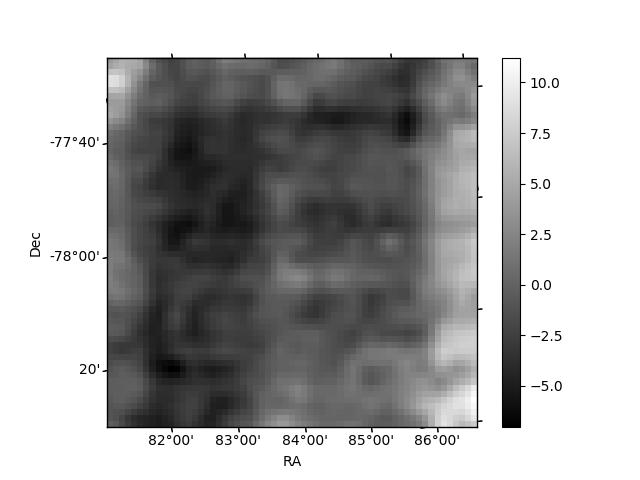
Histogram calculated using DETX and DETY for each event in the final _common_clean file
| Quadrant A |  |
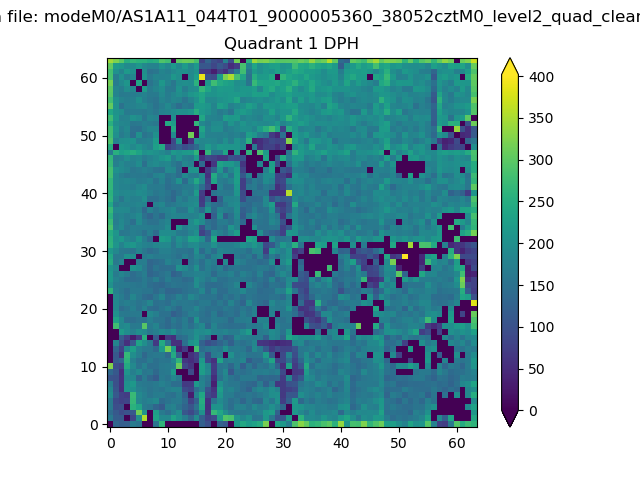 |
Quadrant B |
|---|---|---|---|
| Quadrant D | 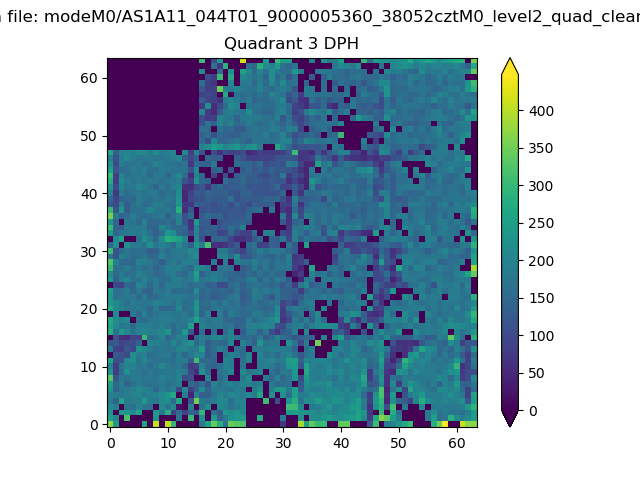 |
 |
Quadrant C |
| Plot type | Count rate plots | Images |
|---|---|---|
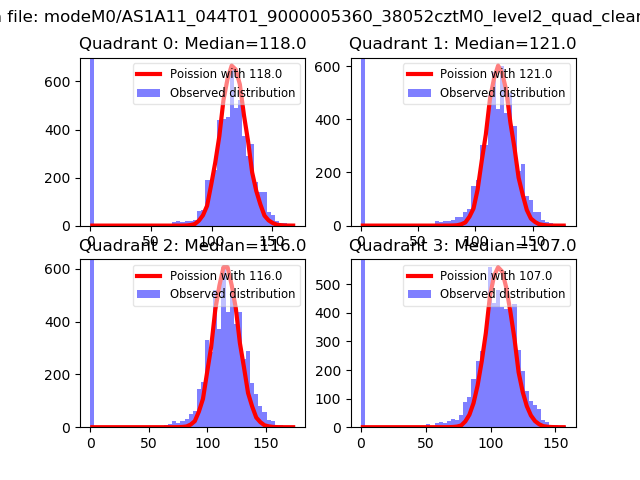
| Comparison with Poisson distribution Blue bars denote a histogram of data divided into 1 sec bins. Red curve is a Poisson curve with rate = median count rate of data. |
 |
 |
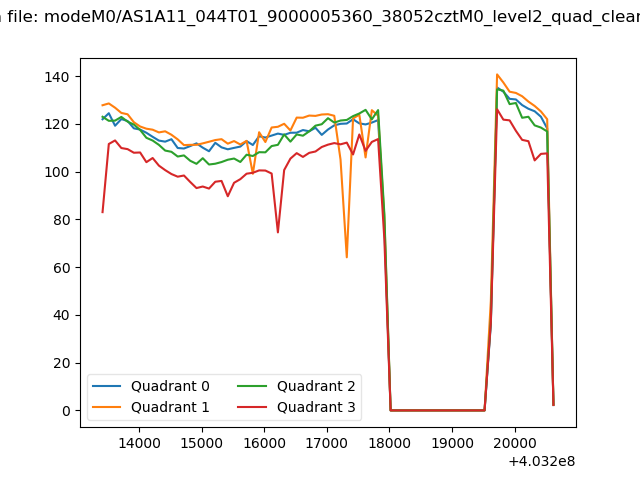
| Quadrant-wise count rates Data is divided into 100 sec bins |
 |
|
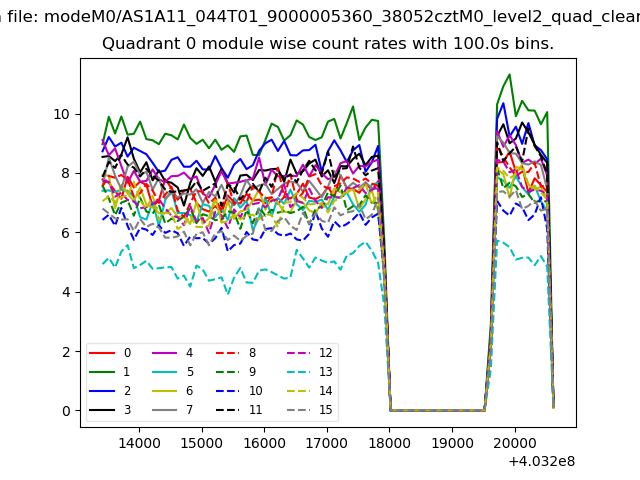
| Module-wise count rates for Quadrant A Data is divided into 100 sec bins |
 |
 |
| Module-wise count rates for Quadrant B Data is divided into 100 sec bins |
 |
 |
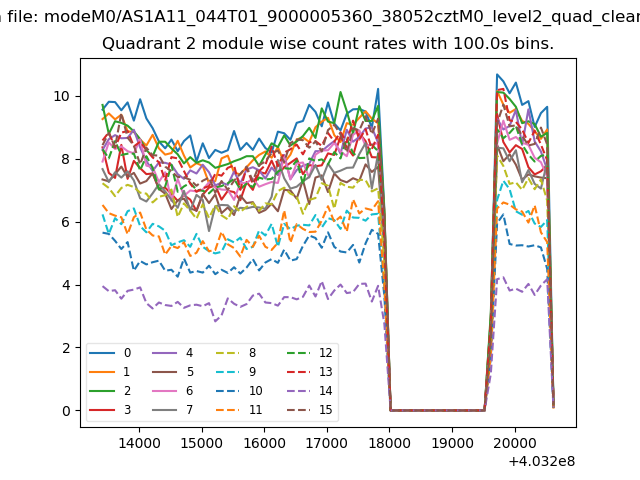
| Module-wise count rates for Quadrant C Data is divided into 100 sec bins |
 |
 |
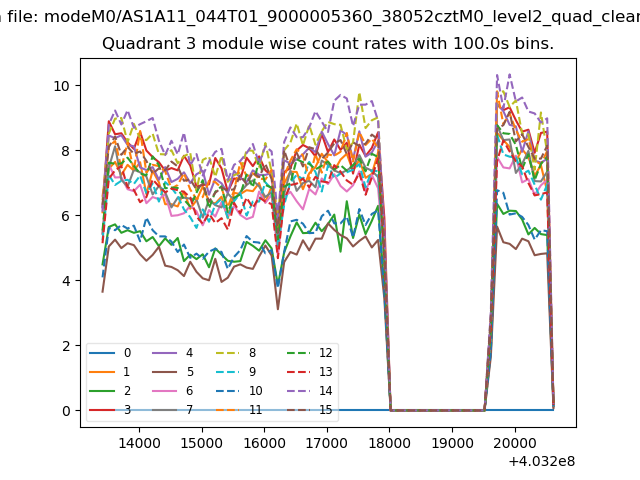
| Module-wise count rates for Quadrant D Data is divided into 100 sec bins |
 |
 |
| Parameter | Plot |
|---|---|
| CZT HV Monitor | 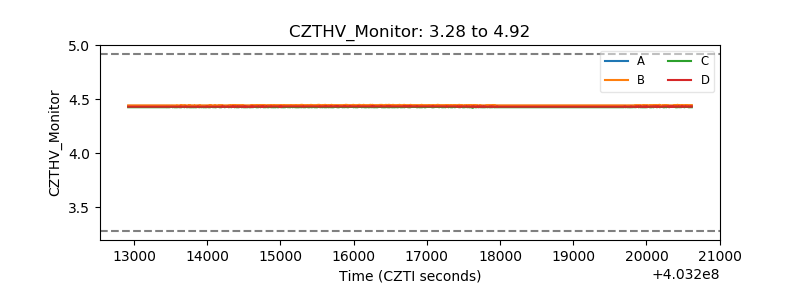 |
| D_VDD | 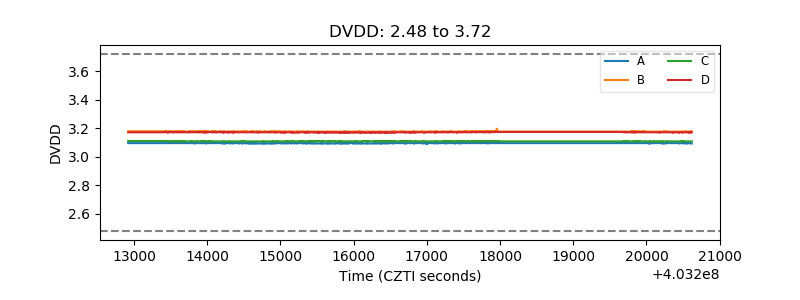 |
| Temperature 1 | 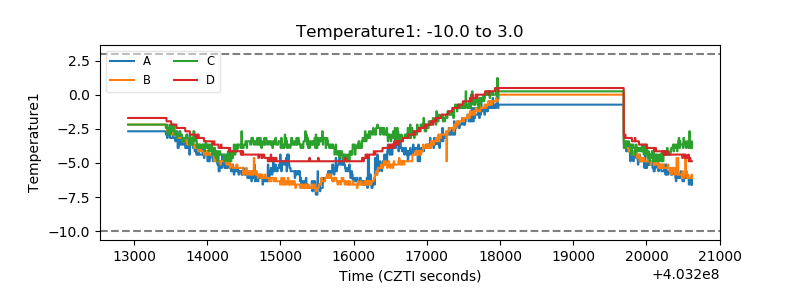 |
| Veto HV Monitor | 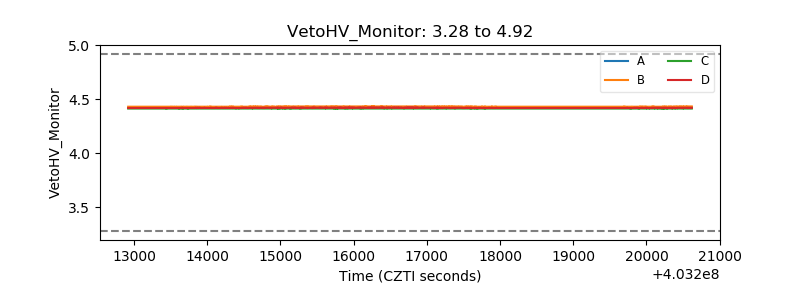 |
| Veto LLD | 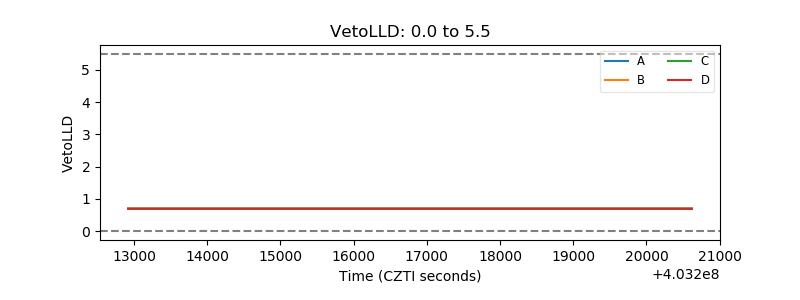 |
| Alpha Counter | 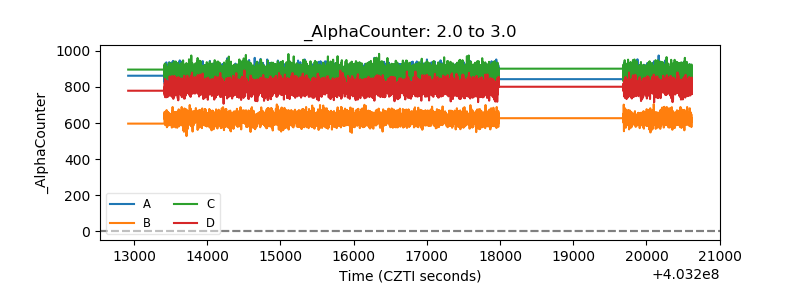 |
| _CPM_Rate | 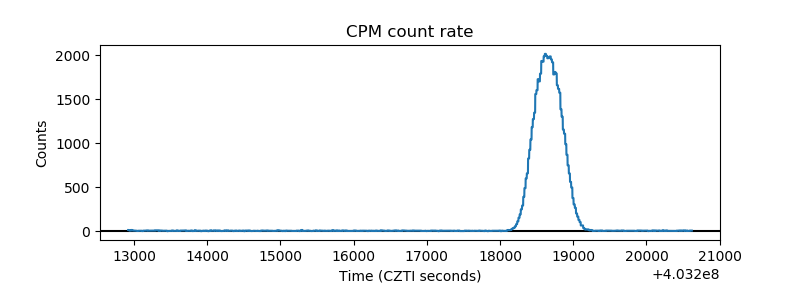 |
| CZT Counter | 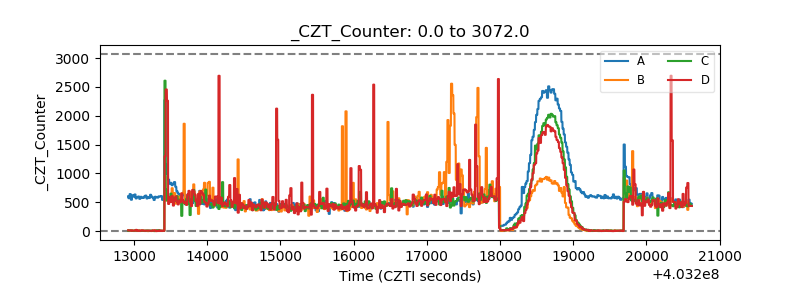 |
| +2.5 Volts monitor | 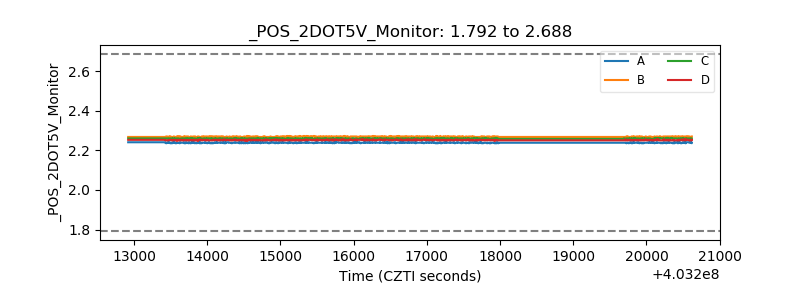 |
| +5 Volts monitor | 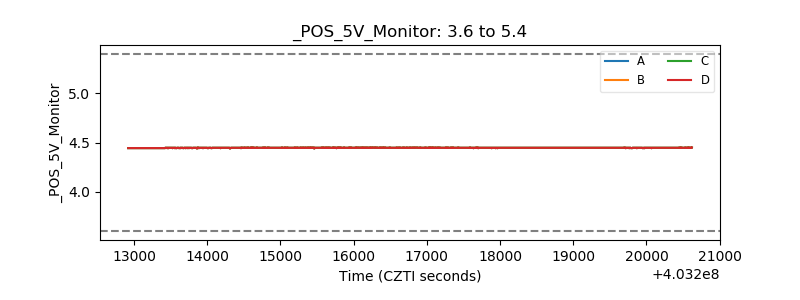 |
| _ROLL_ROT | 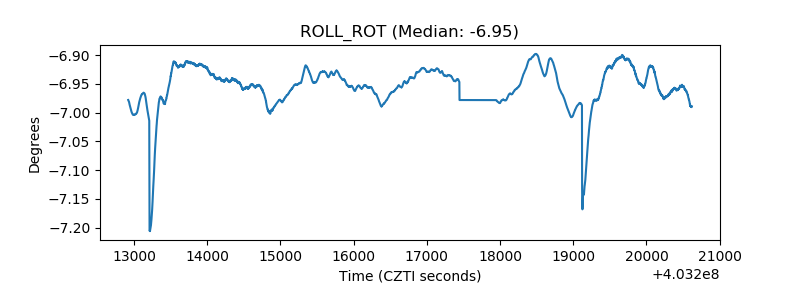 |
| _Roll_DEC | 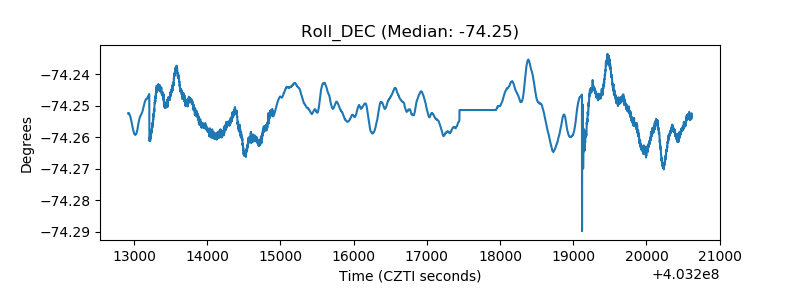 |
| _Roll_RA | 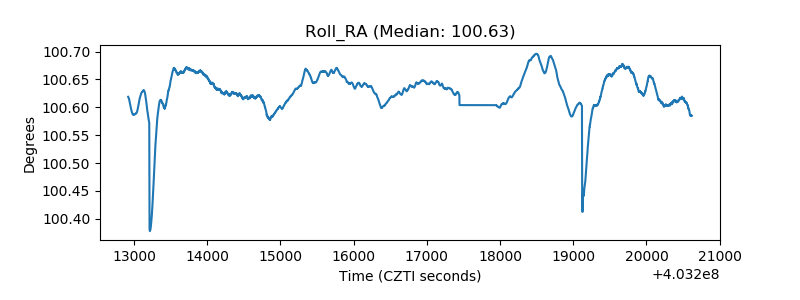 |
| Veto Counter | 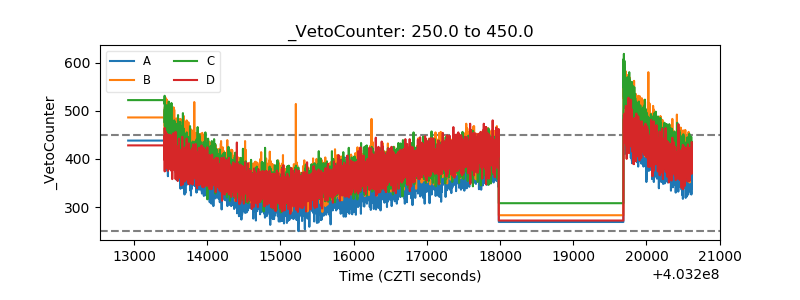 |