| Param | Original file | Final file |
|---|---|---|
| Filename | modeM0/AS1A11_044T01_9000005360_38054cztM0_level2.fits | modeM0/AS1A11_044T01_9000005360_38054cztM0_level2_quad_clean.evt |
| Size (bytes) | 315,489,600 | 95,889,600 |
| Size | 300.9 MB | 91.4 MB |
| Events in quadrant A | 2,813,963 | 647,376 |
| Events in quadrant B | 2,790,505 | 665,585 |
| Events in quadrant C | 2,652,079 | 642,103 |
| Events in quadrant D | 3,010,954 | 579,723 |
| Mode SS | |||
|---|---|---|---|
| Quadrant | BADHDUFLAG | Total packets | Discarded packets |
| A | 0 | 108 | 0 |
| B | 0 | 108 | 0 |
| C | 0 | 108 | 0 |
| D | 0 | 108 | 0 |
| Mode M9 | |||
|---|---|---|---|
| Quadrant | BADHDUFLAG | Total packets | Discarded packets |
| A | 0 | 36 | 0 |
| B | 0 | 36 | 0 |
| C | 0 | 36 | 0 |
| D | 0 | 36 | 0 |
| Mode M0 | |||
|---|---|---|---|
| Quadrant | BADHDUFLAG | Total packets | Discarded packets |
| A | 0 | 11570 | 3 |
| B | 0 | 11675 | 2 |
| C | 0 | 10916 | 2 |
| D | 0 | 12351 | 2 |
| Quadrant | Total seconds | Saturated seconds | Saturation percentage |
|---|---|---|---|
| A | 5274 | 18 | 0.341297% |
| B | 5274 | 64 | 1.213500% |
| C | 5274 | 10 | 0.189609% |
| D | 5274 | 97 | 1.839211% |
Noise dominated data is calculated using 1-second bins in cleaned event files. If a bin has >2000 counts, and if more than 50% of those come from <1% of pixels, then it is considered to be noise-dominated and hence unusable.
| Quadrant | # 1 sec bins | Bins with >0 counts | Bins with >2000 counts | High rate bins dominated by noise | Noise dominated (total time) | Noise dominated (detector-on time) | Marked lightcurve |
|---|---|---|---|---|---|---|---|
| A | 8830 | 5276 | 7 | 7 | 0.08% | 0.13% | 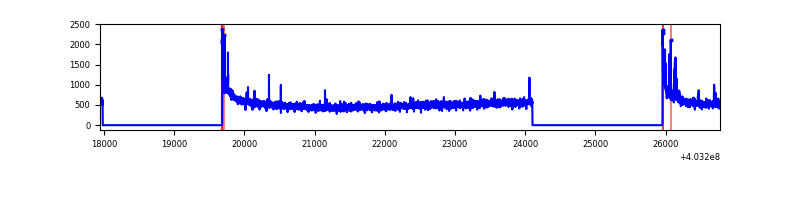 |
| B | 8830 | 5276 | 40 | 40 | 0.45% | 0.76% | 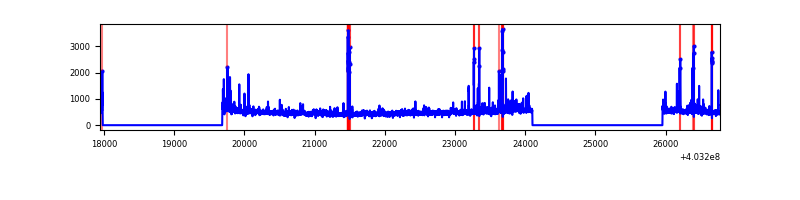 |
| C | 8830 | 5276 | 4 | 4 | 0.05% | 0.08% | 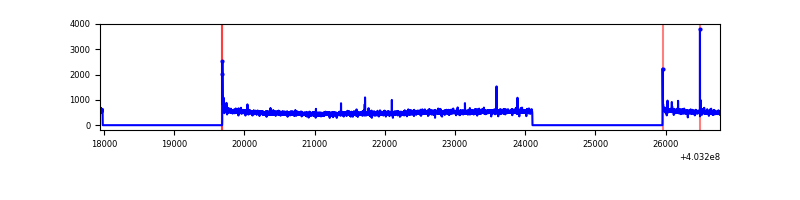 |
| D | 8830 | 5276 | 80 | 80 | 0.91% | 1.52% | 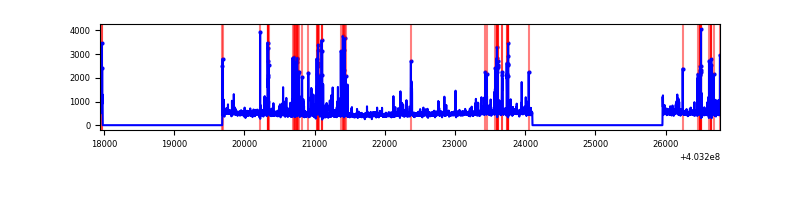 |
Top three noisy pixels from each quadrant. If the there are fewer than three noisy pixels in the level2.evt file, extra rows are filled as -1
| Pixel properties | Quadrant properties | ||||||
|---|---|---|---|---|---|---|---|
| Quadrant | DetID | PixID | Counts | Sigma | Mean | Median | Sigma |
| A | 10 | 83 | 362751 | 2950.69 | 611 | 598 | 122.7 |
| A | 7 | 3 | 33280 | 266.28 | 611 | 598 | 122.7 |
| A | 13 | 6 | 15715 | 123.17 | 611 | 598 | 122.7 |
| B | 5 | 172 | 92571 | 795.14 | 614 | 598 | 115.7 |
| B | 4 | 171 | 91260 | 783.81 | 614 | 598 | 115.7 |
| B | 5 | 184 | 67830 | 581.24 | 614 | 598 | 115.7 |
| C | 15 | 214 | 222576 | 1586.83 | 607 | 610 | 139.9 |
| C | 3 | 233 | 25986 | 181.41 | 607 | 610 | 139.9 |
| C | 0 | 10 | 15687 | 107.79 | 607 | 610 | 139.9 |
| D | 13 | 249 | 299050 | 2082.06 | 595 | 580 | 143.4 |
| D | 12 | 233 | 108014 | 749.44 | 595 | 580 | 143.4 |
| D | 10 | 199 | 96366 | 668.18 | 595 | 580 | 143.4 |
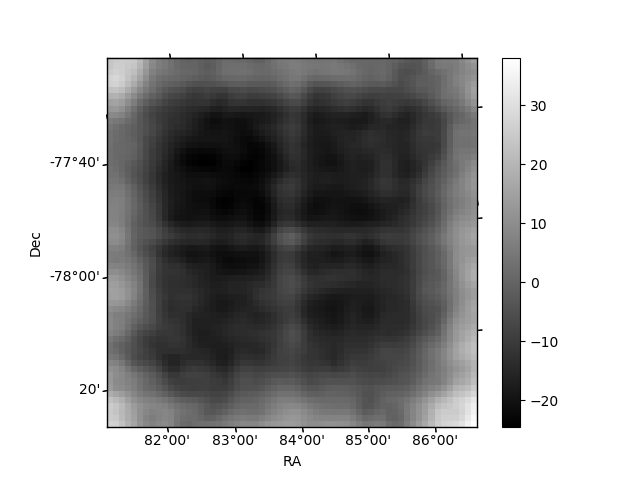
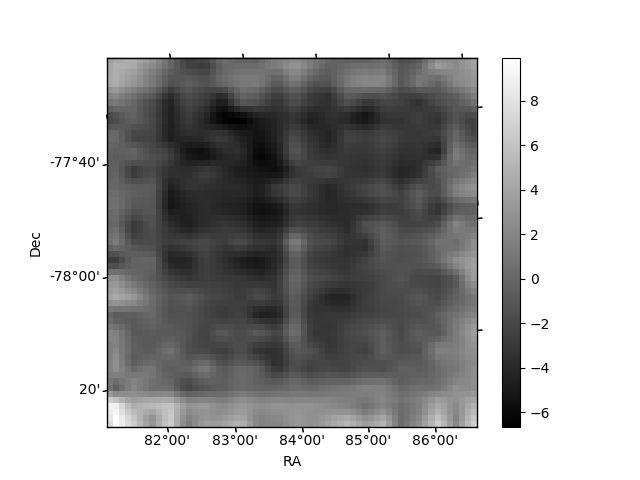
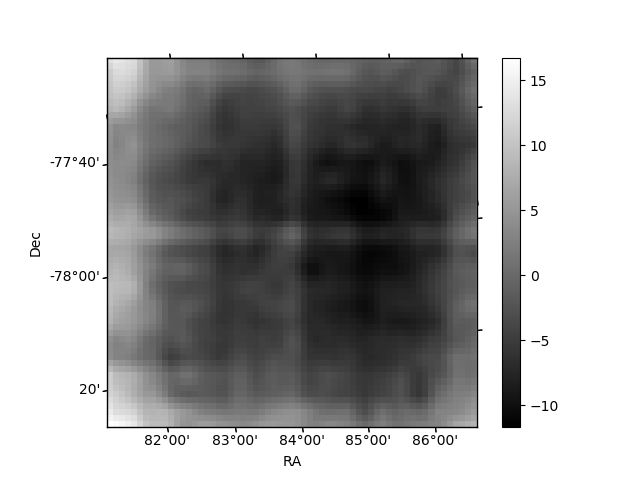
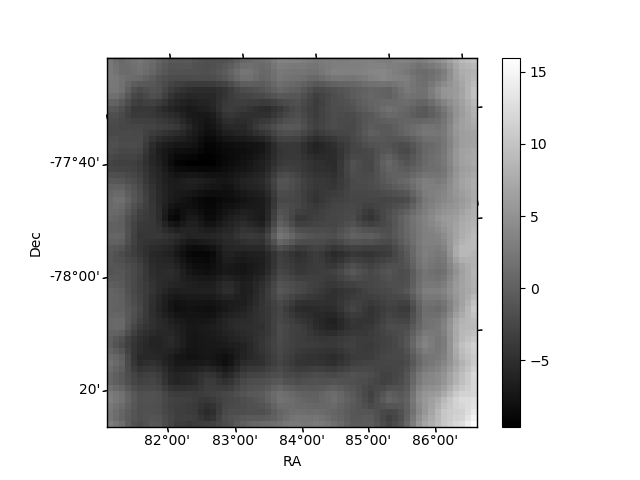
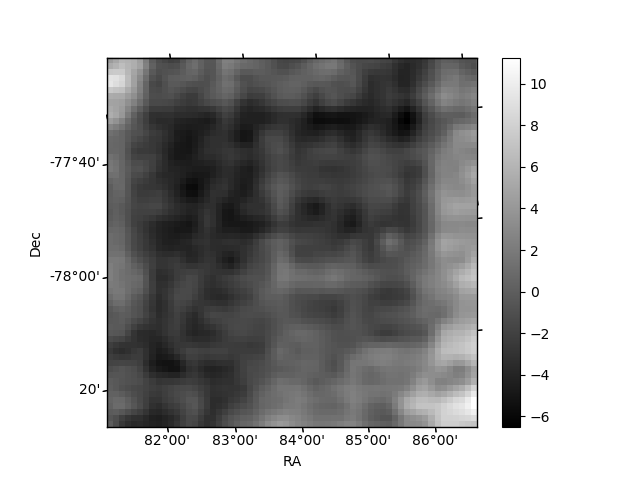
Histogram calculated using DETX and DETY for each event in the final _common_clean file
| Quadrant A | 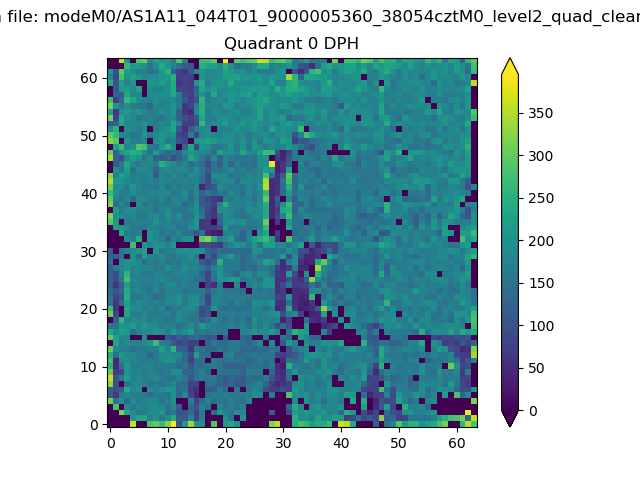 |
 |
Quadrant B |
|---|---|---|---|
| Quadrant D | 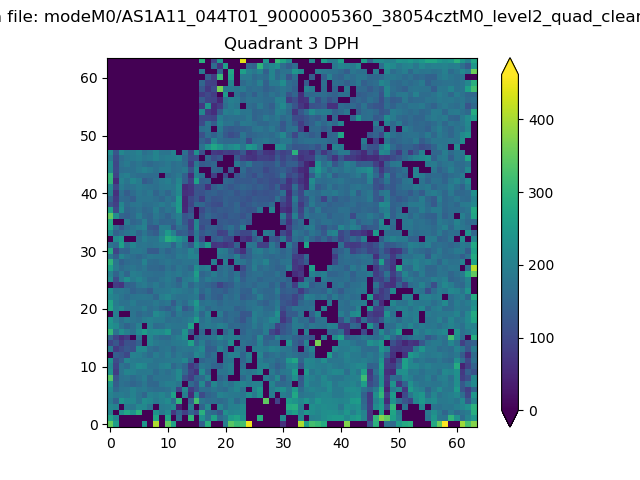 |
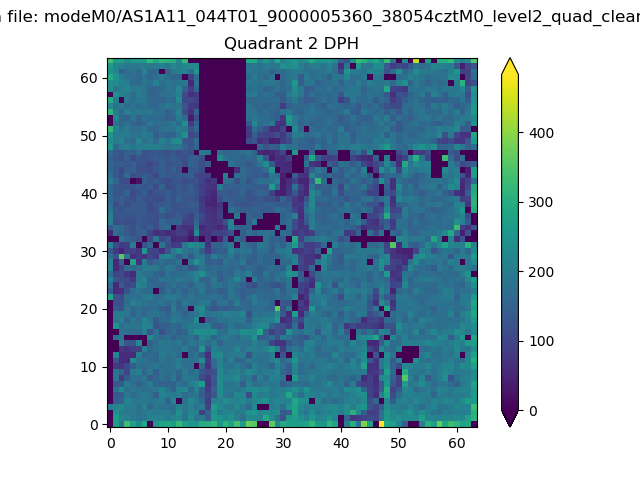 |
Quadrant C |
| Plot type | Count rate plots | Images |
|---|---|---|
| Comparison with Poisson distribution Blue bars denote a histogram of data divided into 1 sec bins. Red curve is a Poisson curve with rate = median count rate of data. |
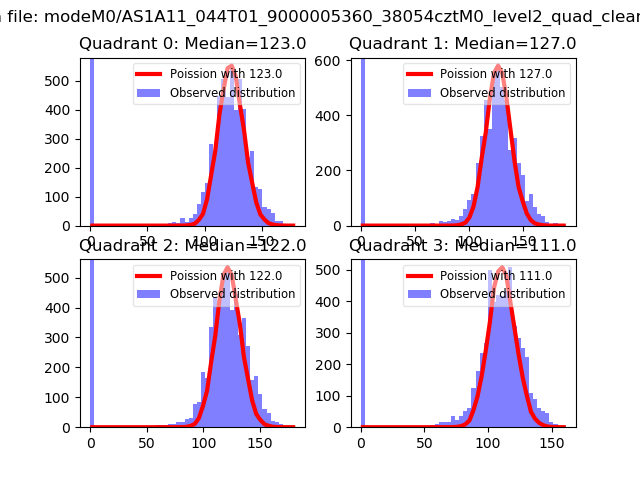 |
 |
| Quadrant-wise count rates Data is divided into 100 sec bins |
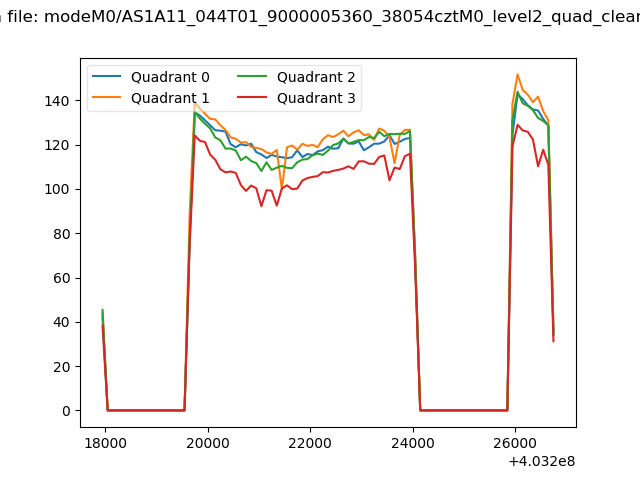 |
|
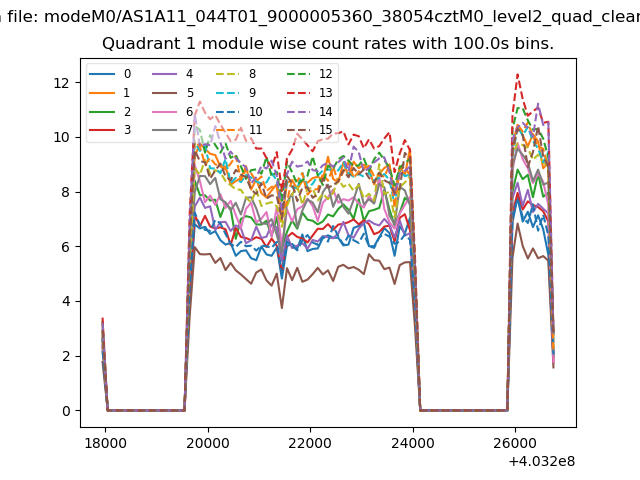
| Module-wise count rates for Quadrant A Data is divided into 100 sec bins |
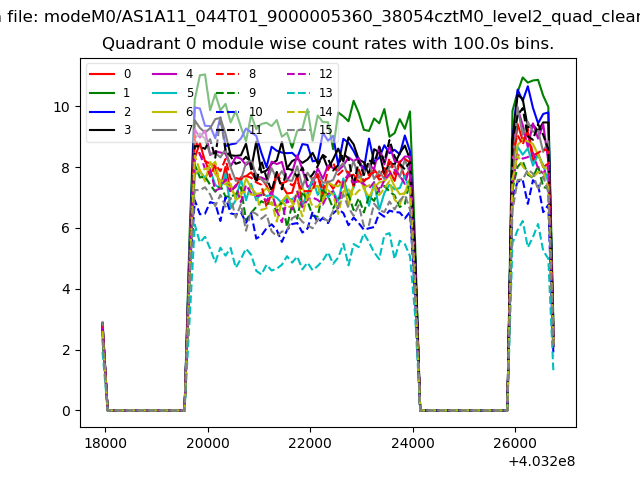 |
 |
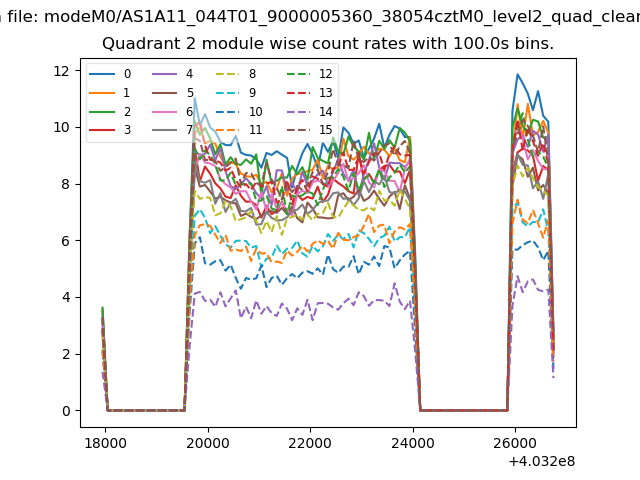
| Module-wise count rates for Quadrant B Data is divided into 100 sec bins |
 |
 |
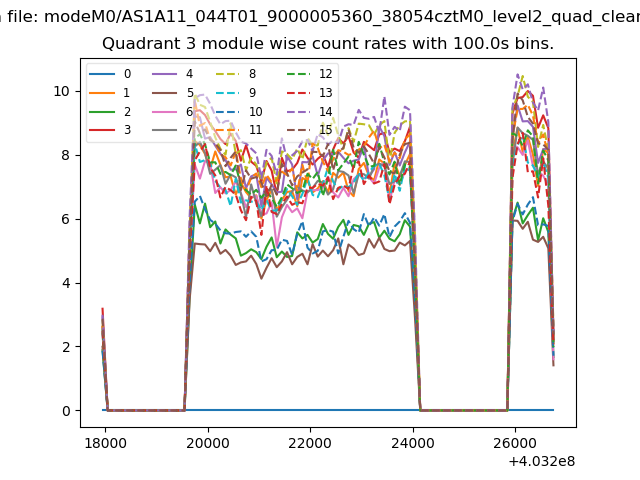
| Module-wise count rates for Quadrant C Data is divided into 100 sec bins |
 |
 |
| Module-wise count rates for Quadrant D Data is divided into 100 sec bins |
 |
 |
| Parameter | Plot |
|---|---|
| CZT HV Monitor | 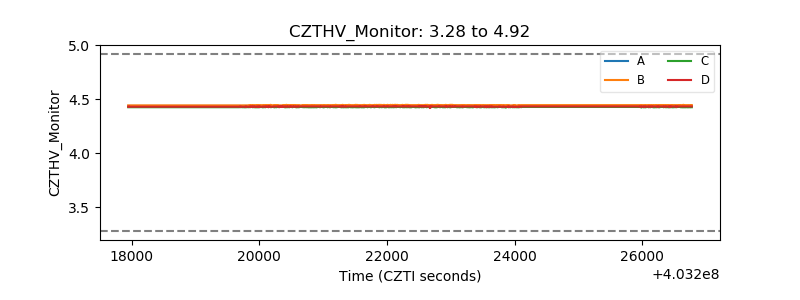 |
| D_VDD | 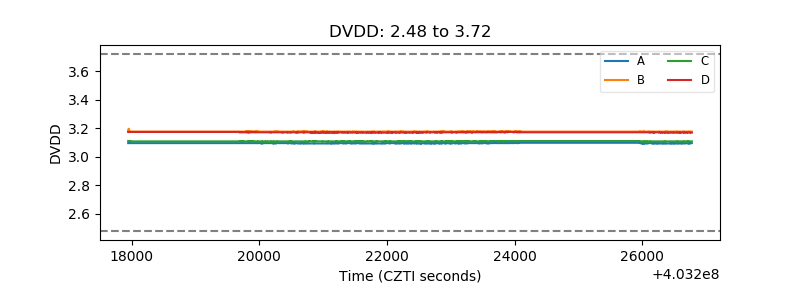 |
| Temperature 1 | 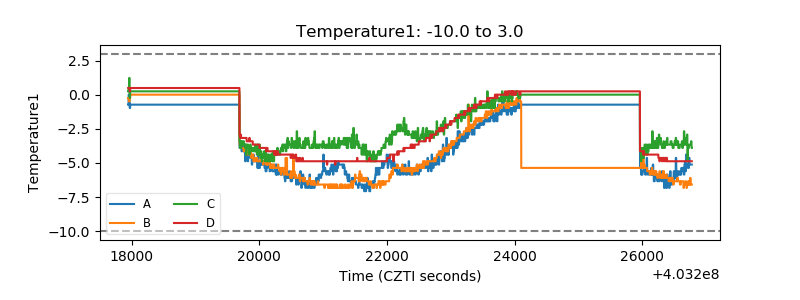 |
| Veto HV Monitor | 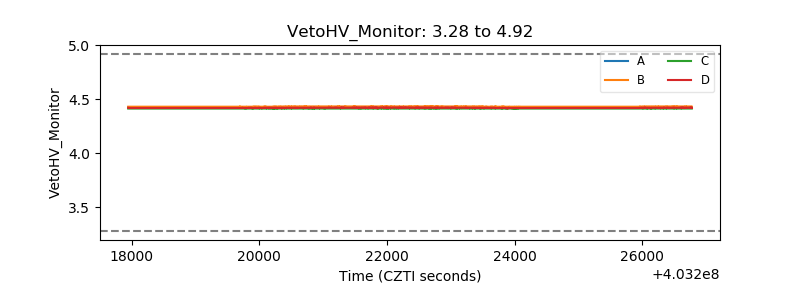 |
| Veto LLD | 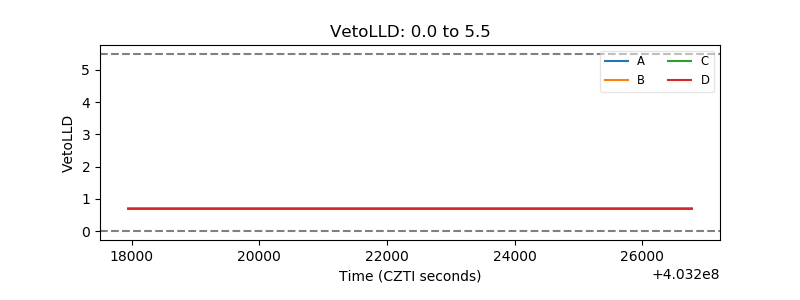 |
| Alpha Counter | 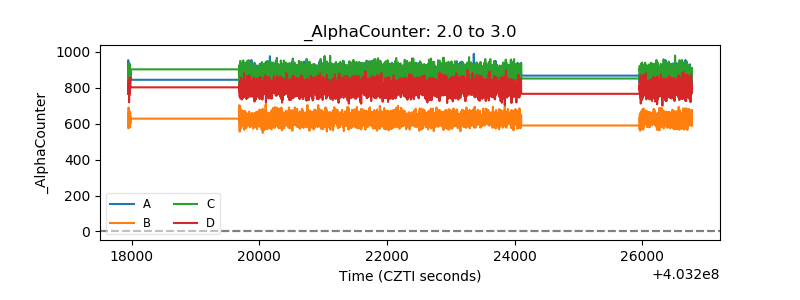 |
| _CPM_Rate | 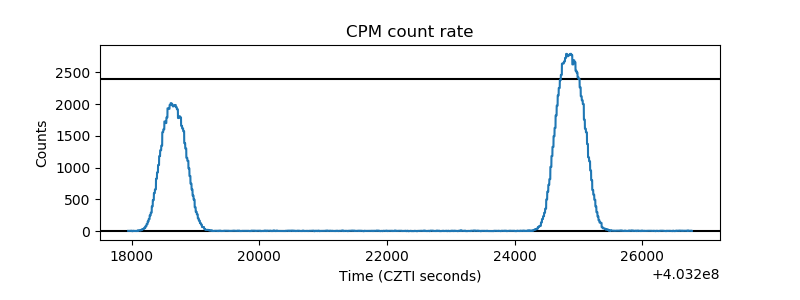 |
| CZT Counter | 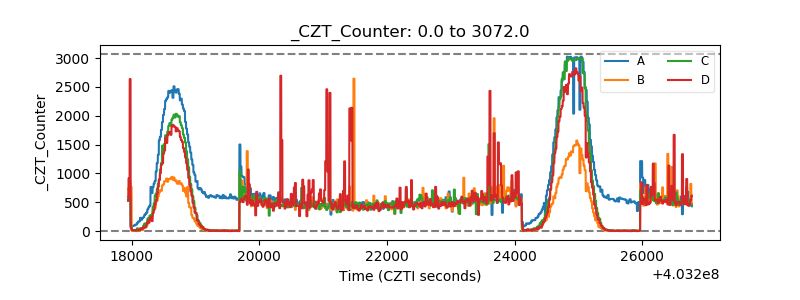 |
| +2.5 Volts monitor | 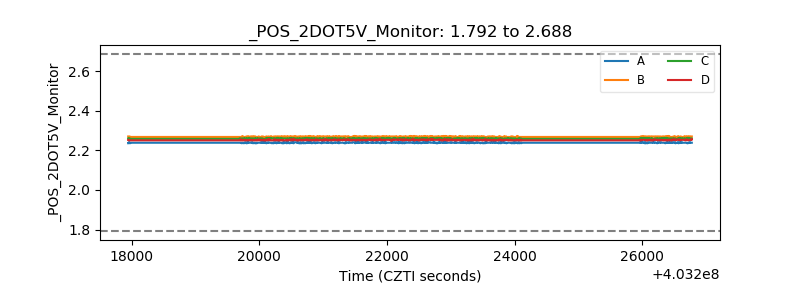 |
| +5 Volts monitor | 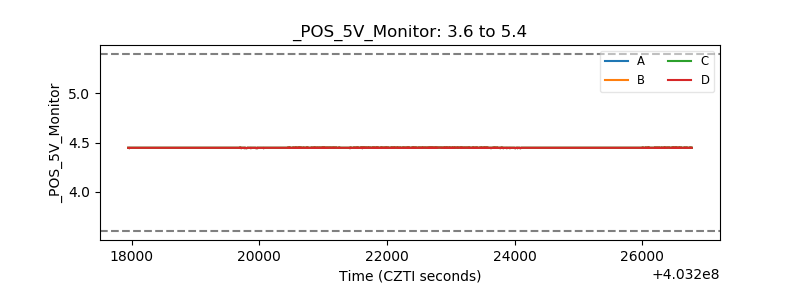 |
| _ROLL_ROT | 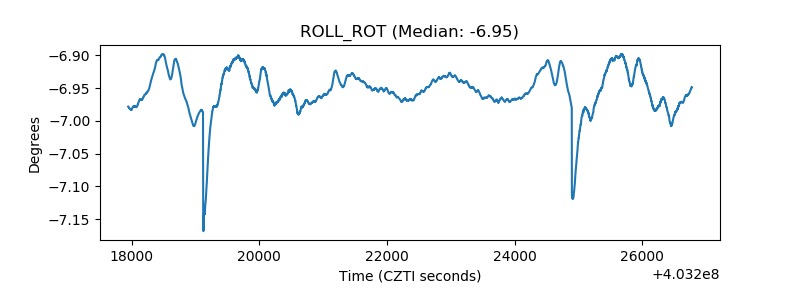 |
| _Roll_DEC | 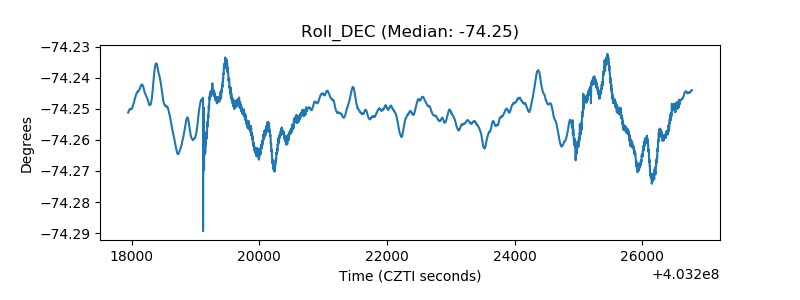 |
| _Roll_RA | 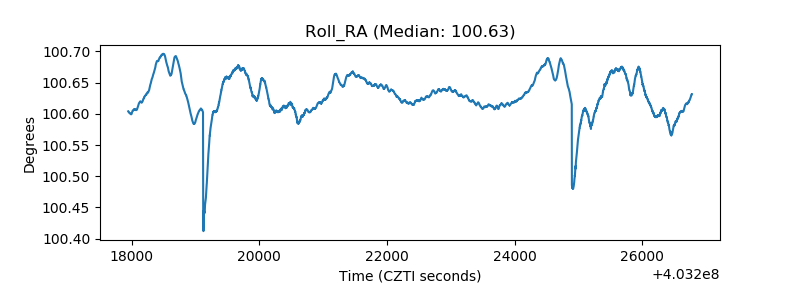 |
| Veto Counter | 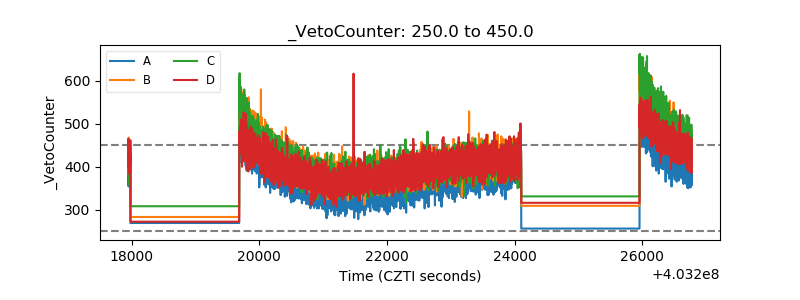 |