| Param | Original file | Final file |
|---|---|---|
| Filename | modeM0/AS1A11_044T01_9000005360_38055cztM0_level2.fits | modeM0/AS1A11_044T01_9000005360_38055cztM0_level2_quad_clean.evt |
| Size (bytes) | 360,596,160 | 101,206,080 |
| Size | 343.9 MB | 96.5 MB |
| Events in quadrant A | 2,961,057 | 690,706 |
| Events in quadrant B | 2,860,764 | 718,629 |
| Events in quadrant C | 3,251,706 | 682,573 |
| Events in quadrant D | 3,855,832 | 596,577 |
| Mode SS | |||
|---|---|---|---|
| Quadrant | BADHDUFLAG | Total packets | Discarded packets |
| A | 0 | 110 | 0 |
| B | 0 | 110 | 0 |
| C | 0 | 110 | 0 |
| D | 0 | 110 | 0 |
| Mode M9 | |||
|---|---|---|---|
| Quadrant | BADHDUFLAG | Total packets | Discarded packets |
| A | 0 | 39 | 0 |
| B | 0 | 39 | 0 |
| C | 0 | 39 | 0 |
| D | 0 | 39 | 0 |
| Mode M0 | |||
|---|---|---|---|
| Quadrant | BADHDUFLAG | Total packets | Discarded packets |
| A | 0 | 11958 | 3 |
| B | 0 | 11778 | 2 |
| C | 0 | 12765 | 2 |
| D | 0 | 14900 | 2 |
| Quadrant | Total seconds | Saturated seconds | Saturation percentage |
|---|---|---|---|
| A | 5379 | 17 | 0.316044% |
| B | 5379 | 37 | 0.687860% |
| C | 5379 | 123 | 2.286670% |
| D | 5379 | 391 | 7.269009% |
Noise dominated data is calculated using 1-second bins in cleaned event files. If a bin has >2000 counts, and if more than 50% of those come from <1% of pixels, then it is considered to be noise-dominated and hence unusable.
| Quadrant | # 1 sec bins | Bins with >0 counts | Bins with >2000 counts | High rate bins dominated by noise | Noise dominated (total time) | Noise dominated (detector-on time) | Marked lightcurve |
|---|---|---|---|---|---|---|---|
| A | 9205 | 5381 | 8 | 8 | 0.09% | 0.15% | 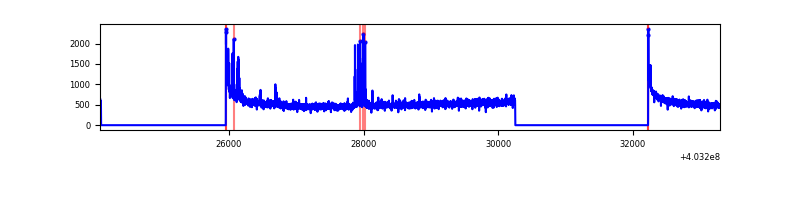 |
| B | 9205 | 5381 | 16 | 16 | 0.17% | 0.30% | 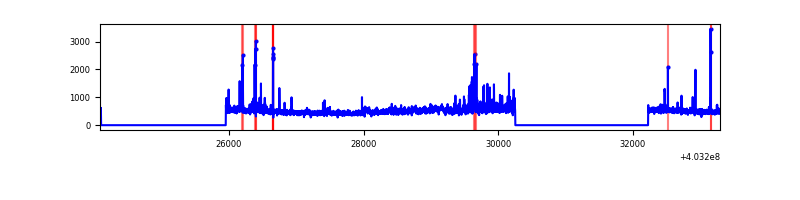 |
| C | 9204 | 5380 | 107 | 107 | 1.16% | 1.99% | 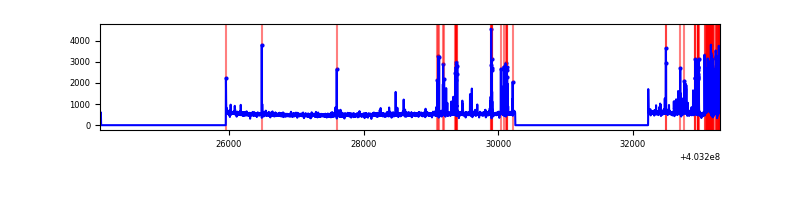 |
| D | 9205 | 5381 | 343 | 343 | 3.73% | 6.37% | 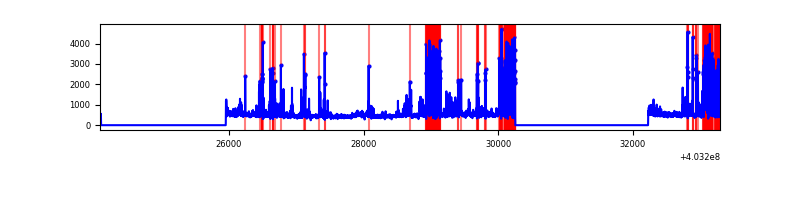 |
Top three noisy pixels from each quadrant. If the there are fewer than three noisy pixels in the level2.evt file, extra rows are filled as -1
| Pixel properties | Quadrant properties | ||||||
|---|---|---|---|---|---|---|---|
| Quadrant | DetID | PixID | Counts | Sigma | Mean | Median | Sigma |
| A | 10 | 83 | 363285 | 2841.06 | 636 | 626 | 127.6 |
| A | 12 | 227 | 84194 | 654.67 | 636 | 626 | 127.6 |
| A | 7 | 3 | 25949 | 198.38 | 636 | 626 | 127.6 |
| B | 0 | 229 | 91733 | 759.57 | 643 | 626 | 119.9 |
| B | 4 | 171 | 70598 | 583.36 | 643 | 626 | 119.9 |
| B | 5 | 184 | 61226 | 505.23 | 643 | 626 | 119.9 |
| C | 1 | 23 | 491972 | 3390.3 | 632 | 636 | 144.9 |
| C | 15 | 214 | 223888 | 1540.48 | 632 | 636 | 144.9 |
| C | 3 | 233 | 35196 | 238.47 | 632 | 636 | 144.9 |
| D | 12 | 227 | 843970 | 5744.18 | 614 | 599 | 146.8 |
| D | 10 | 199 | 224569 | 1525.45 | 614 | 599 | 146.8 |
| D | 13 | 249 | 207712 | 1410.64 | 614 | 599 | 146.8 |
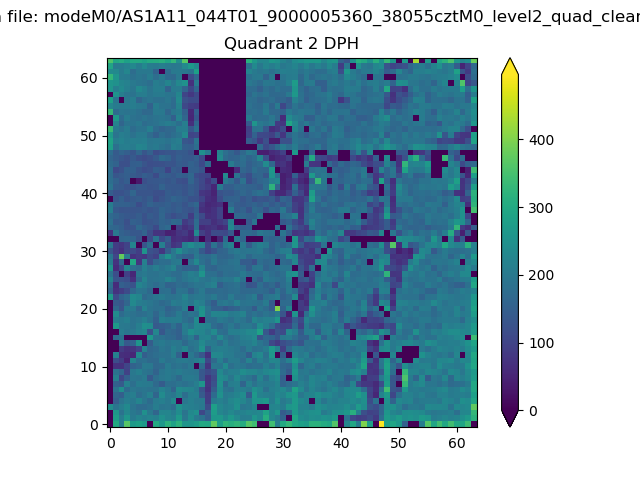
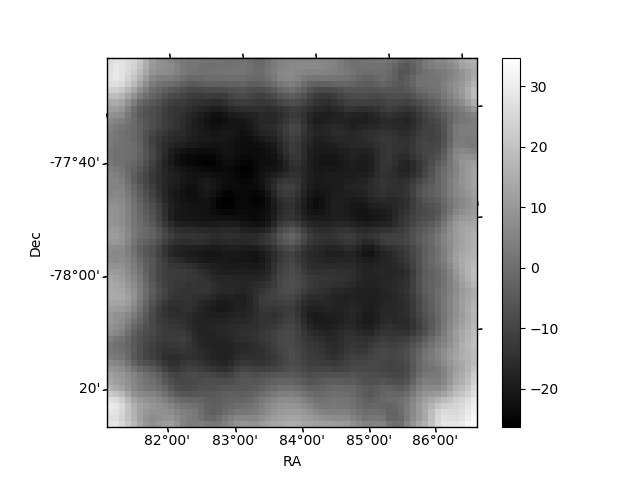
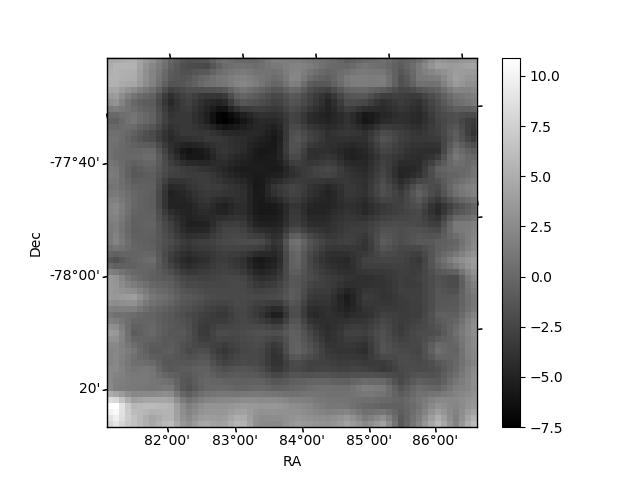
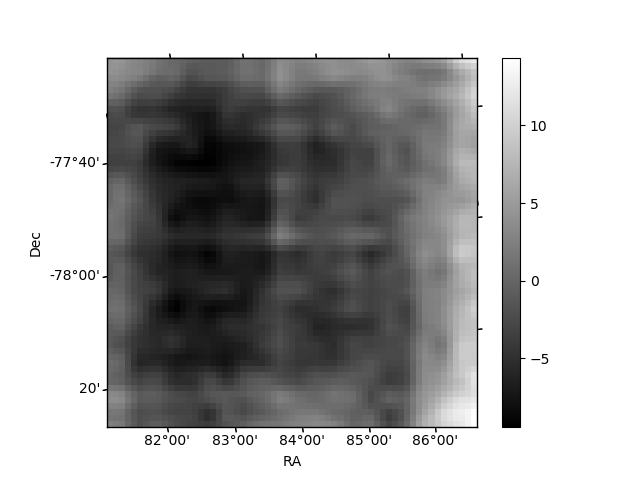
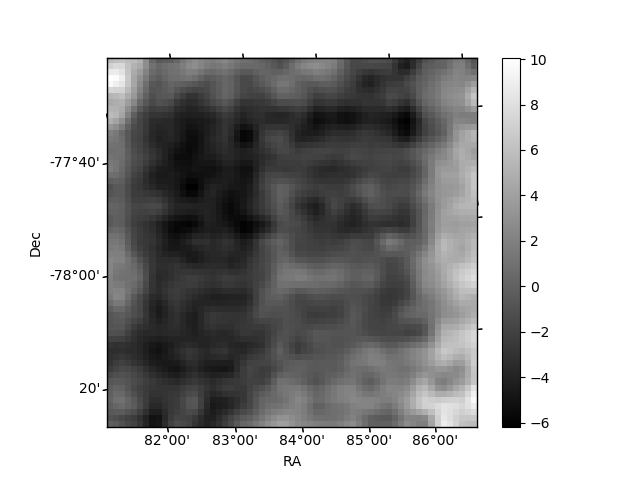
Histogram calculated using DETX and DETY for each event in the final _common_clean file
| Quadrant A | 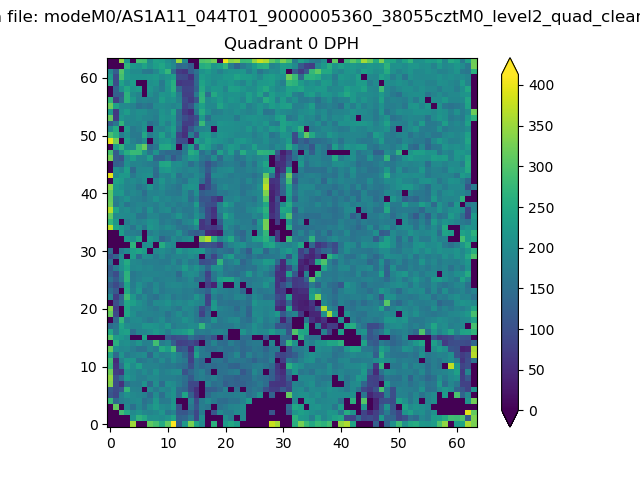 |
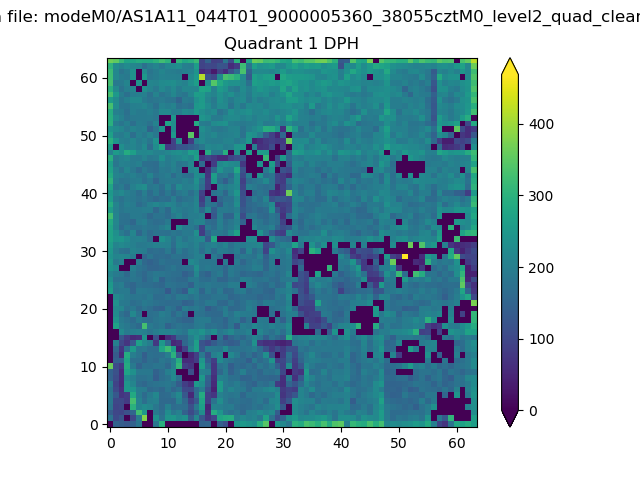 |
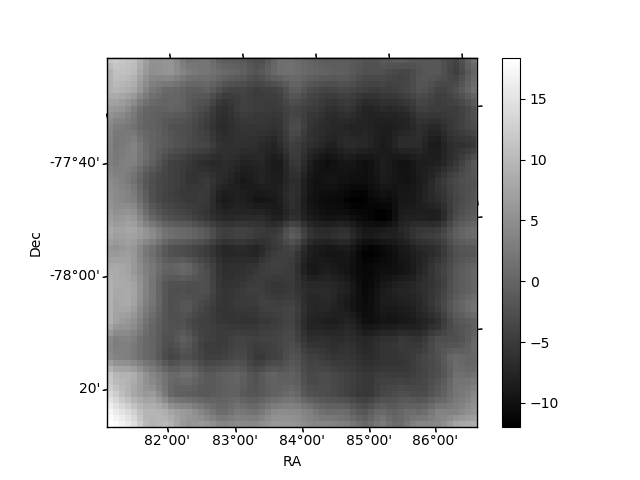
Quadrant B |
|---|---|---|---|
| Quadrant D | 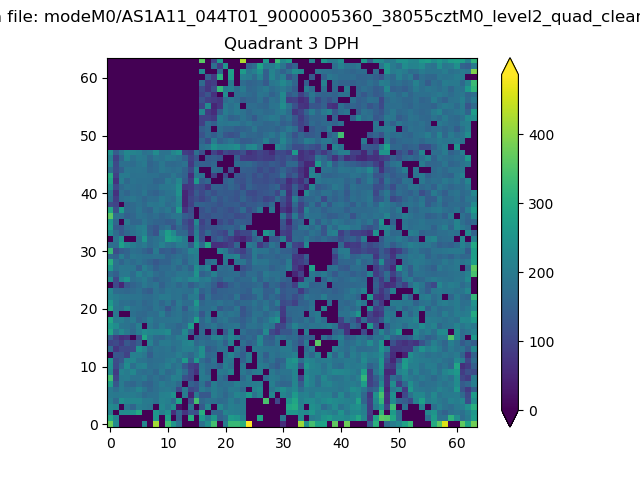 |
 |
Quadrant C |
| Plot type | Count rate plots | Images |
|---|---|---|
| Comparison with Poisson distribution Blue bars denote a histogram of data divided into 1 sec bins. Red curve is a Poisson curve with rate = median count rate of data. |
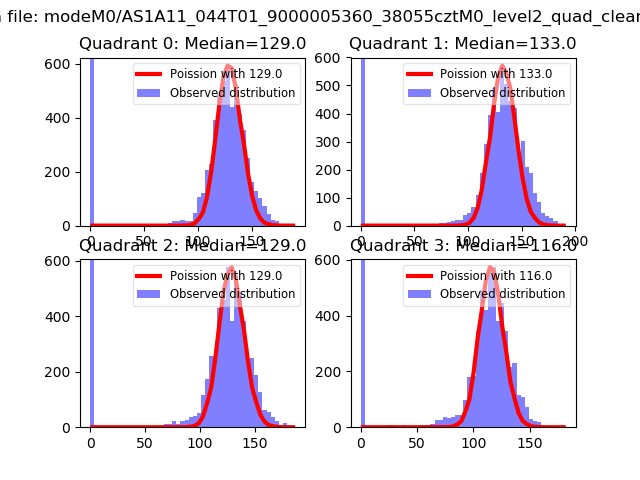 |
 |
| Quadrant-wise count rates Data is divided into 100 sec bins |
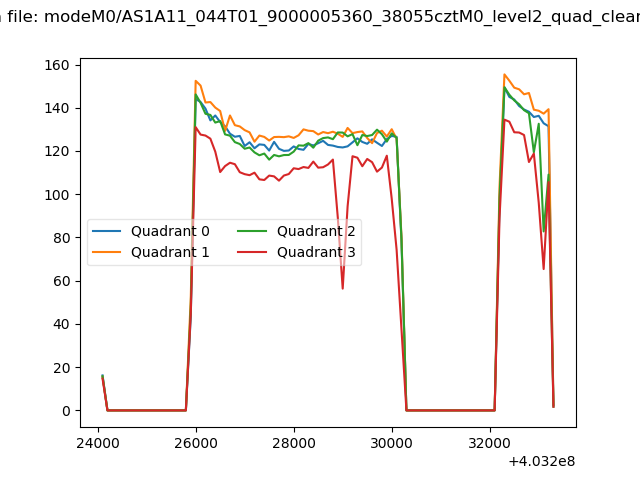 |
|
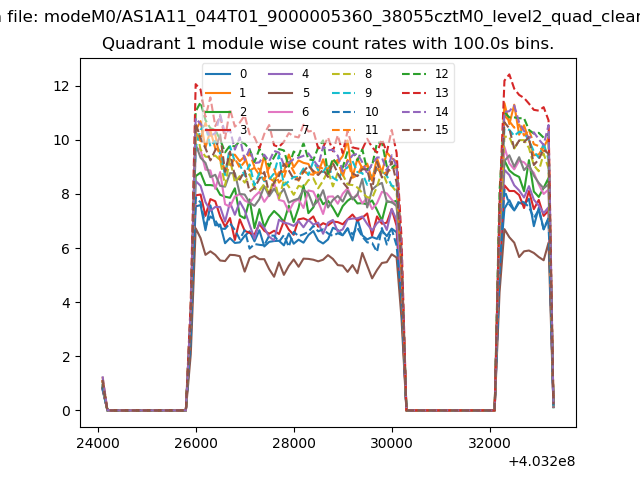
| Module-wise count rates for Quadrant A Data is divided into 100 sec bins |
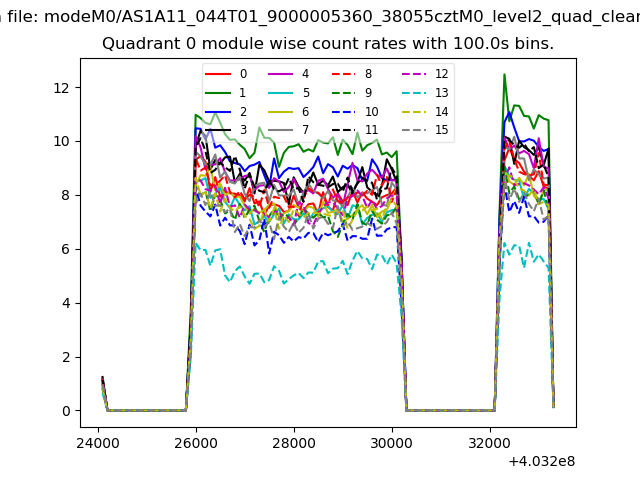 |
 |
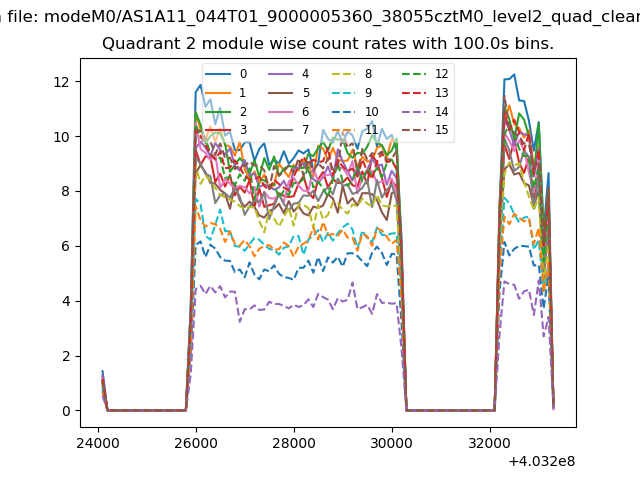
| Module-wise count rates for Quadrant B Data is divided into 100 sec bins |
 |
 |
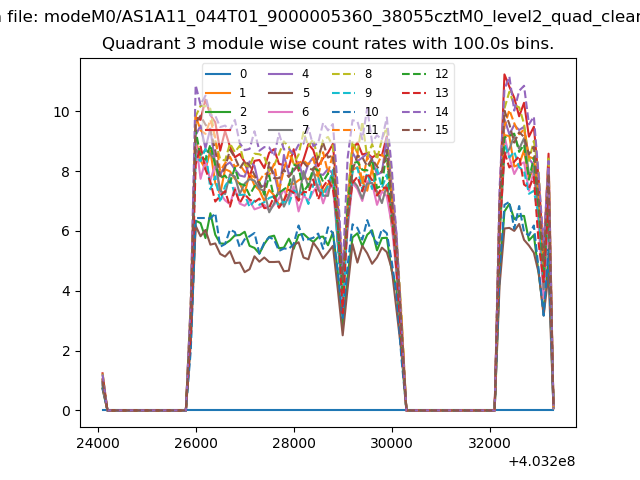
| Module-wise count rates for Quadrant C Data is divided into 100 sec bins |
 |
 |
| Module-wise count rates for Quadrant D Data is divided into 100 sec bins |
 |
 |
| Parameter | Plot |
|---|---|
| CZT HV Monitor | 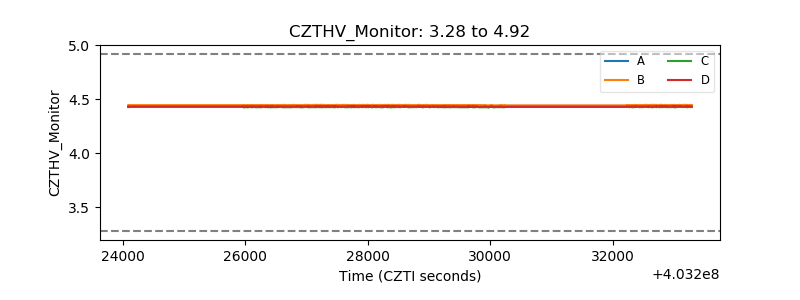 |
| D_VDD | 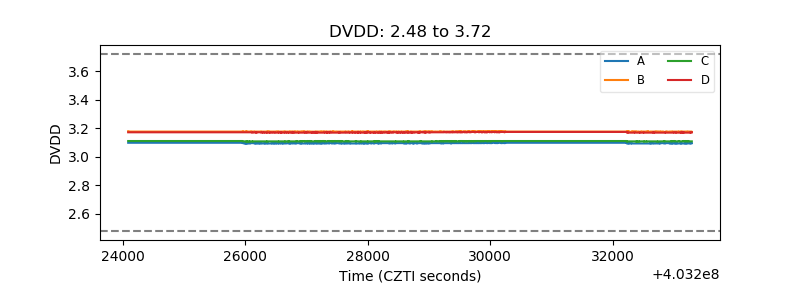 |
| Temperature 1 | 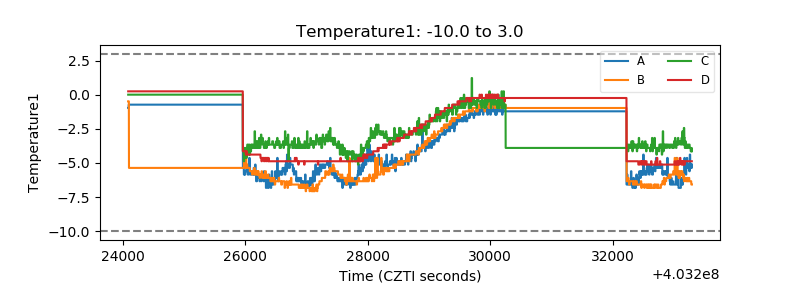 |
| Veto HV Monitor | 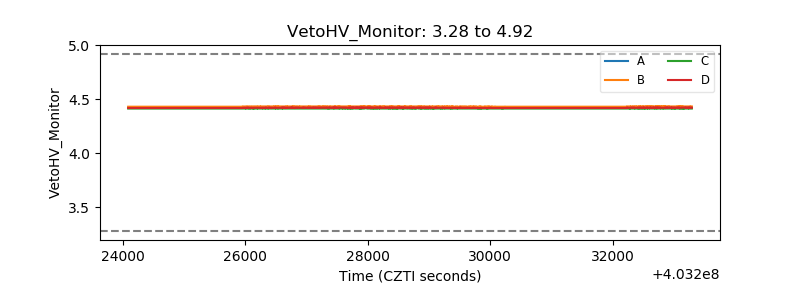 |
| Veto LLD | 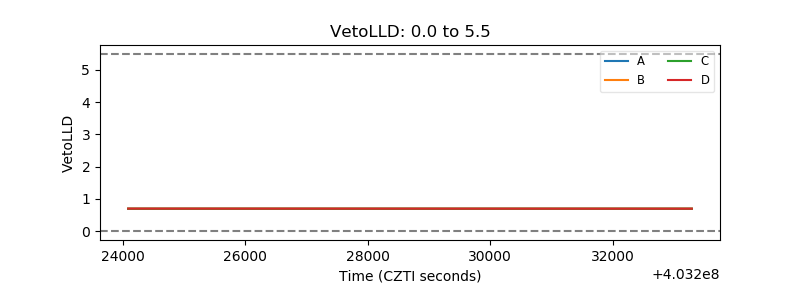 |
| Alpha Counter | 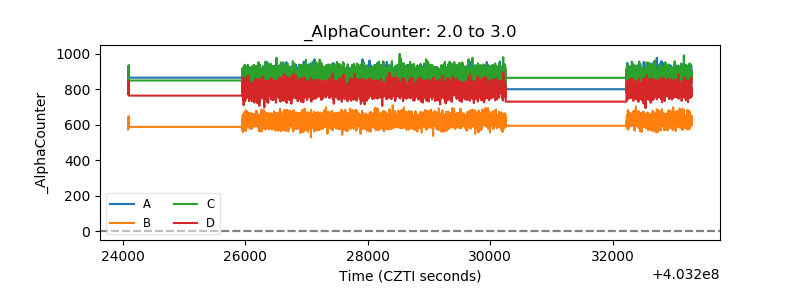 |
| _CPM_Rate | 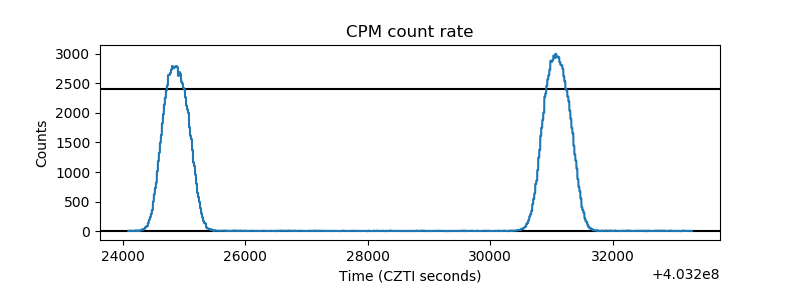 |
| CZT Counter |  |
| +2.5 Volts monitor | 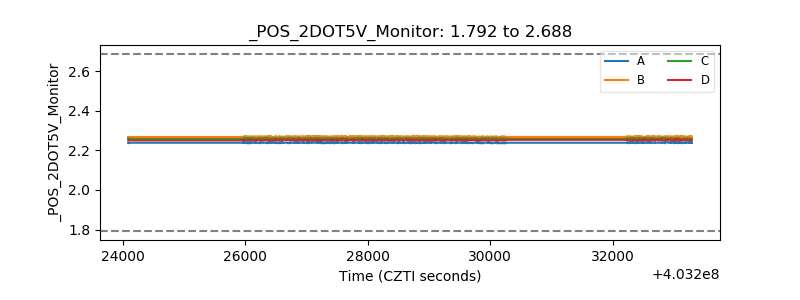 |
| +5 Volts monitor | 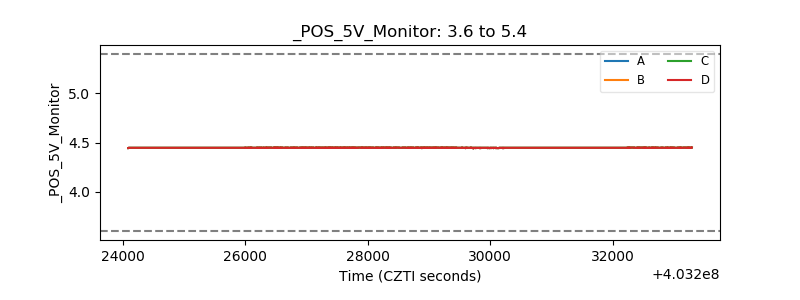 |
| _ROLL_ROT | 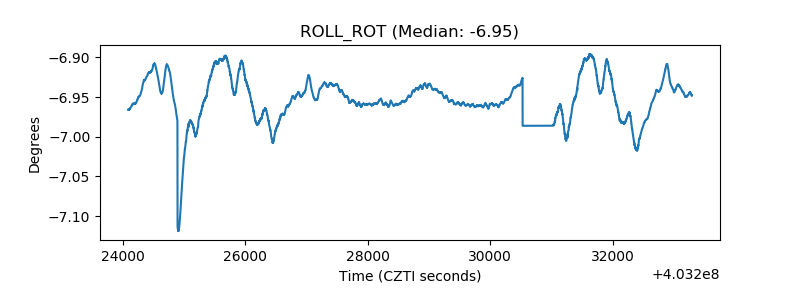 |
| _Roll_DEC | 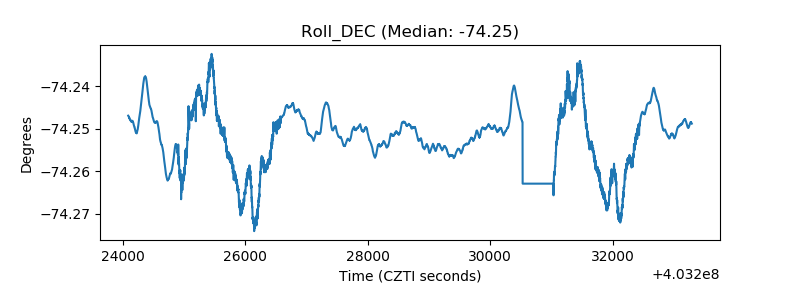 |
| _Roll_RA | 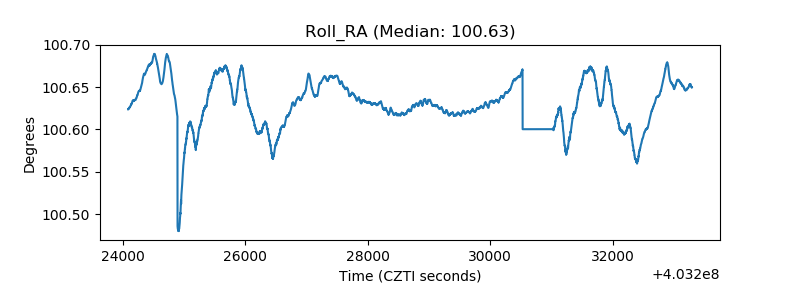 |
| Veto Counter | 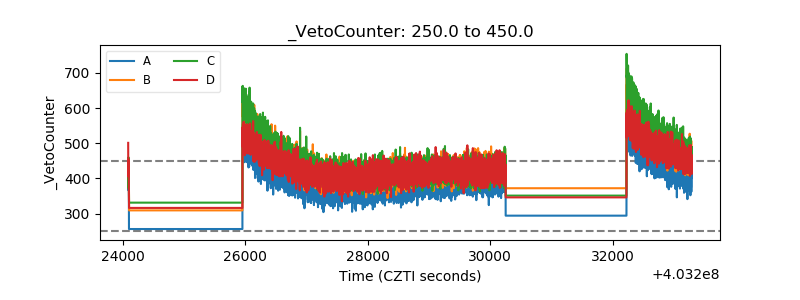 |