| Param | Original file | Final file |
|---|---|---|
| Filename | modeM0/AS1A11_044T01_9000005360_38056cztM0_level2.fits | modeM0/AS1A11_044T01_9000005360_38056cztM0_level2_quad_clean.evt |
| Size (bytes) | 408,928,320 | 98,334,720 |
| Size | 390.0 MB | 93.8 MB |
| Events in quadrant A | 2,806,102 | 684,586 |
| Events in quadrant B | 2,729,733 | 716,661 |
| Events in quadrant C | 5,031,577 | 603,701 |
| Events in quadrant D | 4,162,183 | 605,708 |
| Mode SS | |||
|---|---|---|---|
| Quadrant | BADHDUFLAG | Total packets | Discarded packets |
| A | 0 | 108 | 0 |
| B | 0 | 108 | 0 |
| C | 0 | 108 | 0 |
| D | 0 | 108 | 0 |
| Mode M9 | |||
|---|---|---|---|
| Quadrant | BADHDUFLAG | Total packets | Discarded packets |
| A | 0 | 31 | 0 |
| B | 0 | 31 | 0 |
| C | 0 | 31 | 0 |
| D | 0 | 32 | 0 |
| Mode M0 | |||
|---|---|---|---|
| Quadrant | BADHDUFLAG | Total packets | Discarded packets |
| A | 0 | 11359 | 3 |
| B | 0 | 11354 | 2 |
| C | 0 | 18326 | 2 |
| D | 0 | 15656 | 2 |
| Quadrant | Total seconds | Saturated seconds | Saturation percentage |
|---|---|---|---|
| A | 5238 | 16 | 0.305460% |
| B | 5238 | 37 | 0.706376% |
| C | 5238 | 817 | 15.597556% |
| D | 5238 | 325 | 6.204658% |
Noise dominated data is calculated using 1-second bins in cleaned event files. If a bin has >2000 counts, and if more than 50% of those come from <1% of pixels, then it is considered to be noise-dominated and hence unusable.
| Quadrant | # 1 sec bins | Bins with >0 counts | Bins with >2000 counts | High rate bins dominated by noise | Noise dominated (total time) | Noise dominated (detector-on time) | Marked lightcurve |
|---|---|---|---|---|---|---|---|
| A | 7300 | 5239 | 5 | 5 | 0.07% | 0.10% | 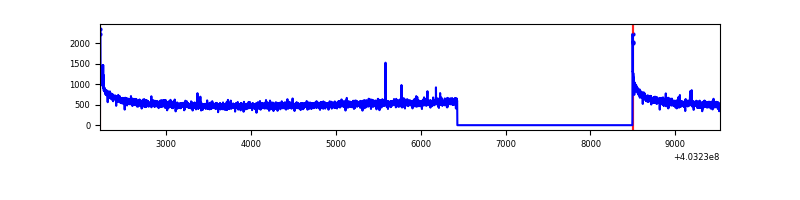 |
| B | 7300 | 5239 | 23 | 23 | 0.32% | 0.44% | 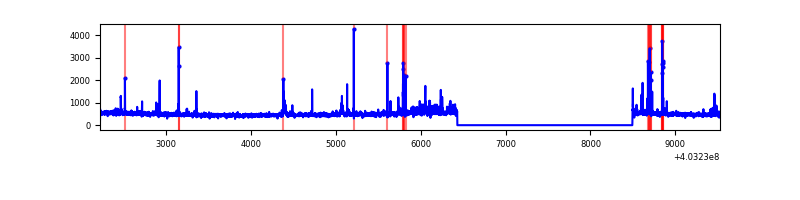 |
| C | 7300 | 5239 | 721 | 721 | 9.88% | 13.76% | 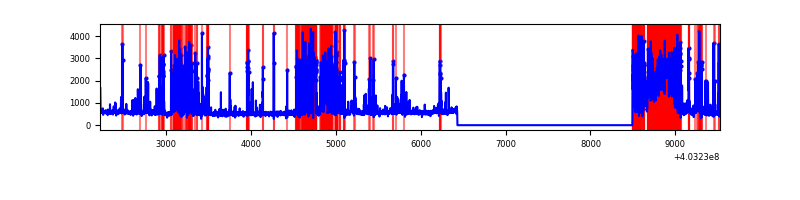 |
| D | 7300 | 5239 | 318 | 318 | 4.36% | 6.07% | 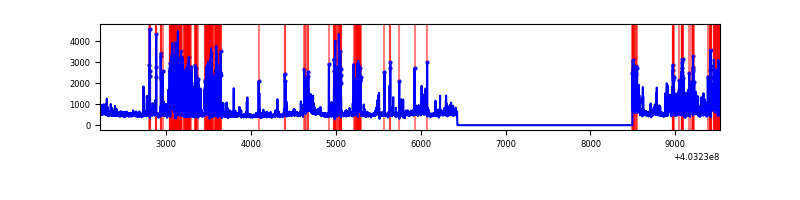 |
Top three noisy pixels from each quadrant. If the there are fewer than three noisy pixels in the level2.evt file, extra rows are filled as -1
| Pixel properties | Quadrant properties | ||||||
|---|---|---|---|---|---|---|---|
| Quadrant | DetID | PixID | Counts | Sigma | Mean | Median | Sigma |
| A | 10 | 83 | 350510 | 2794.39 | 627 | 615 | 125.2 |
| A | 13 | 6 | 11587 | 87.62 | 627 | 615 | 125.2 |
| A | 12 | 189 | 7767 | 57.11 | 627 | 615 | 125.2 |
| B | 5 | 172 | 83302 | 704.68 | 632 | 616 | 117.3 |
| B | 4 | 171 | 51579 | 434.32 | 632 | 616 | 117.3 |
| B | 0 | 229 | 33479 | 280.07 | 632 | 616 | 117.3 |
| C | 1 | 23 | 2423075 | 18130.16 | 583 | 589 | 133.6 |
| C | 15 | 214 | 202459 | 1510.82 | 583 | 589 | 133.6 |
| C | 3 | 233 | 113345 | 843.88 | 583 | 589 | 133.6 |
| D | 12 | 227 | 1155753 | 7905.67 | 615 | 600 | 146.1 |
| D | 13 | 249 | 288871 | 1972.88 | 615 | 600 | 146.1 |
| D | 10 | 199 | 128390 | 874.57 | 615 | 600 | 146.1 |
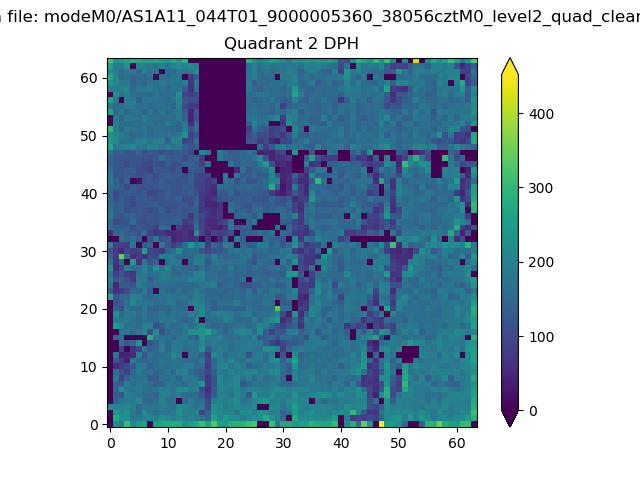
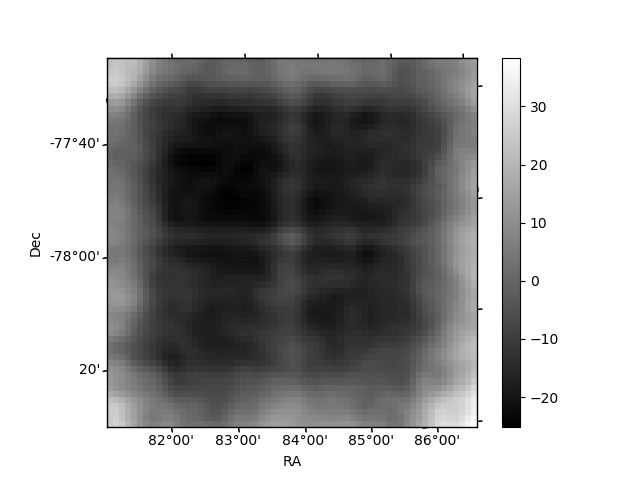
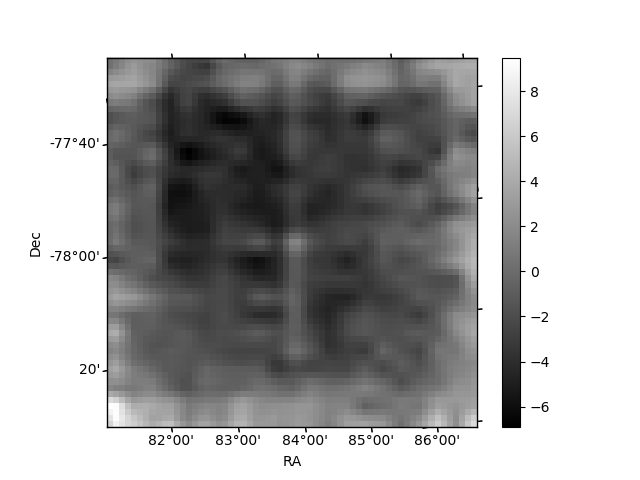
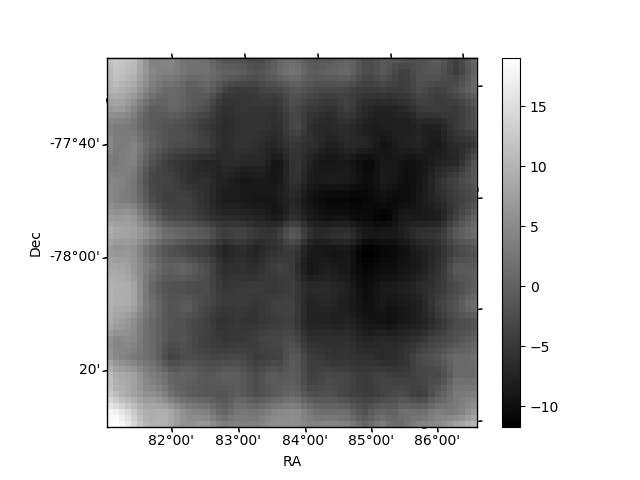
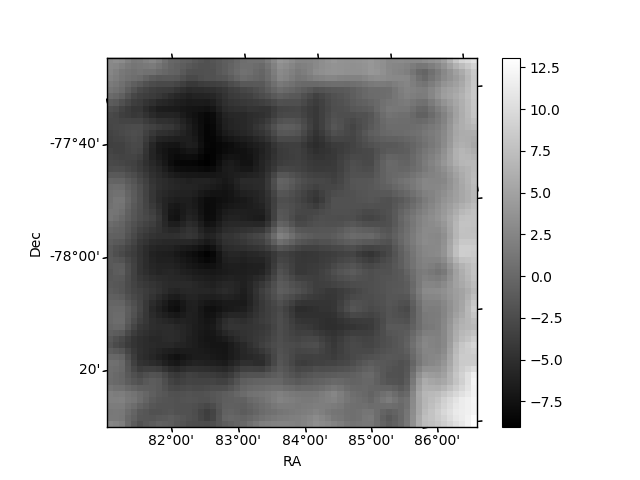
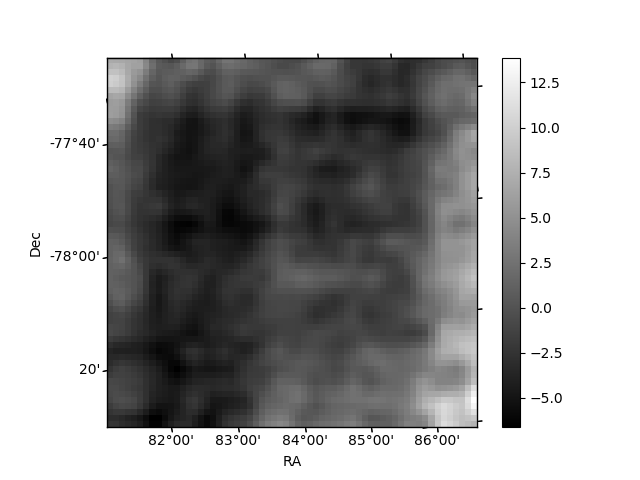
Histogram calculated using DETX and DETY for each event in the final _common_clean file
| Quadrant A | 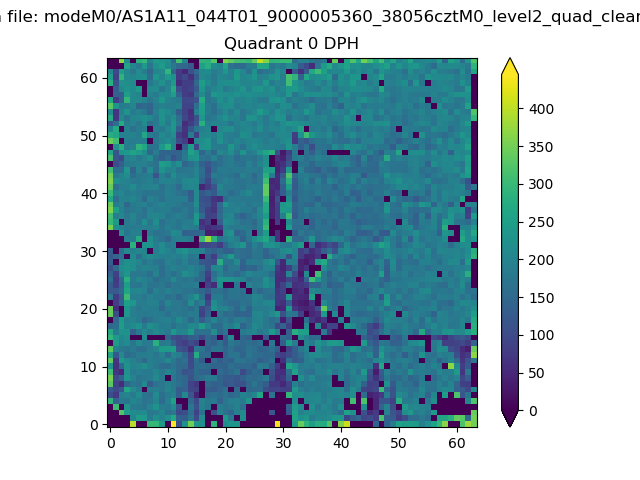 |
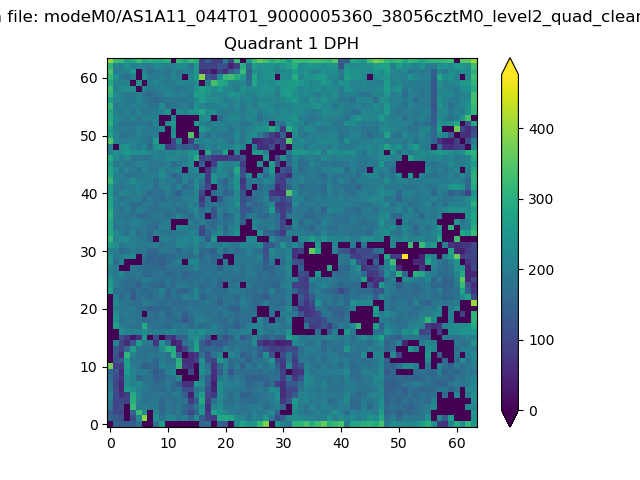 |
Quadrant B |
|---|---|---|---|
| Quadrant D | 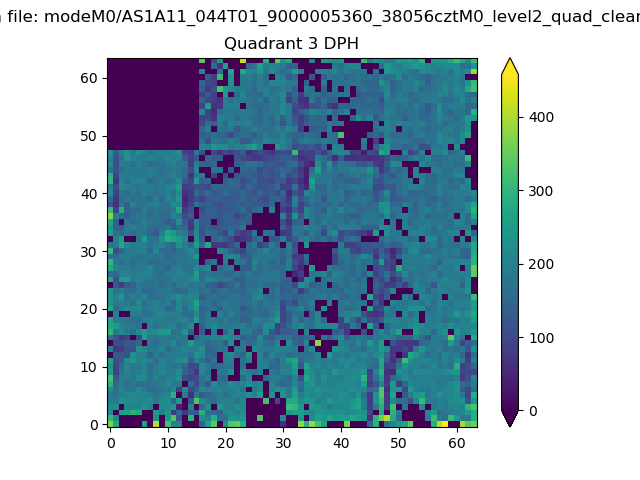 |
 |
Quadrant C |
| Plot type | Count rate plots | Images |
|---|---|---|
| Comparison with Poisson distribution Blue bars denote a histogram of data divided into 1 sec bins. Red curve is a Poisson curve with rate = median count rate of data. |
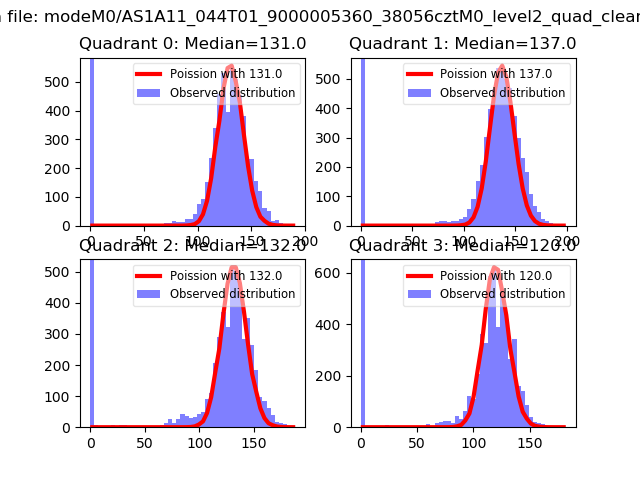 |
 |
| Quadrant-wise count rates Data is divided into 100 sec bins |
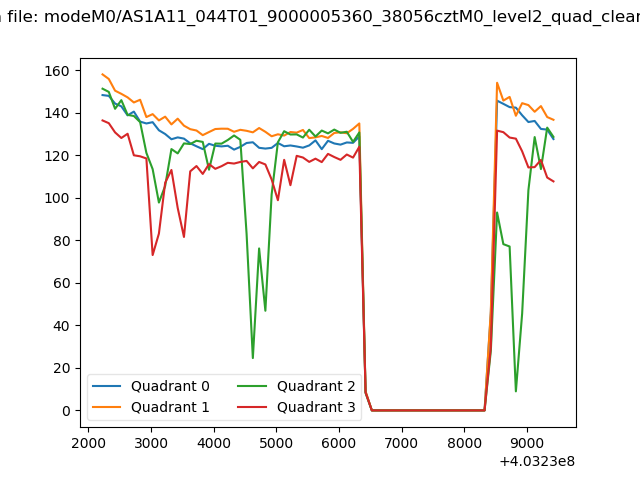 |
|
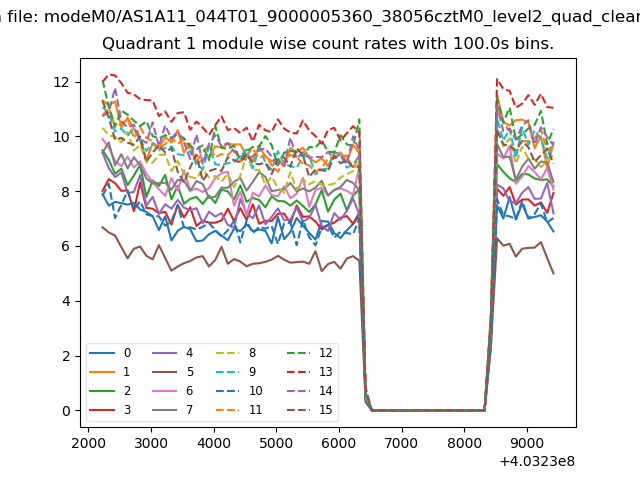
| Module-wise count rates for Quadrant A Data is divided into 100 sec bins |
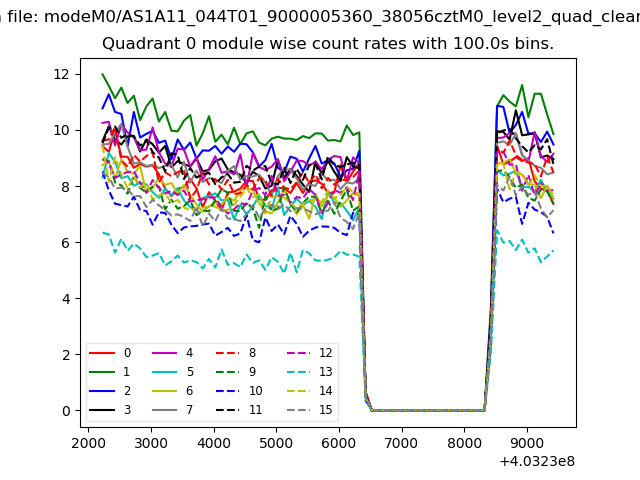 |
 |
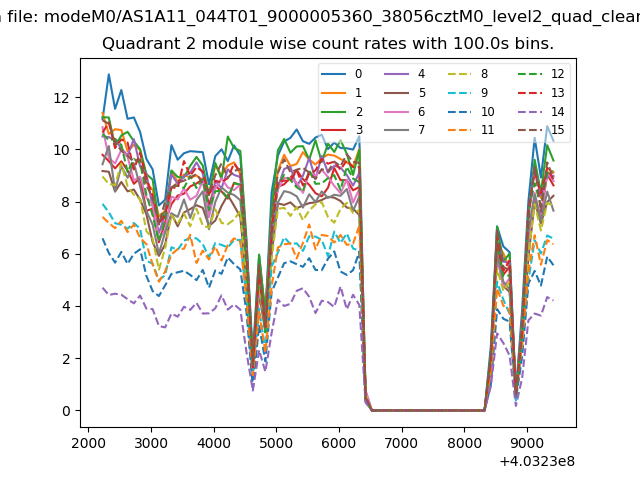
| Module-wise count rates for Quadrant B Data is divided into 100 sec bins |
 |
 |
| Module-wise count rates for Quadrant C Data is divided into 100 sec bins |
 |
 |
| Module-wise count rates for Quadrant D Data is divided into 100 sec bins |
 |
 |
| Parameter | Plot |
|---|---|
| CZT HV Monitor | 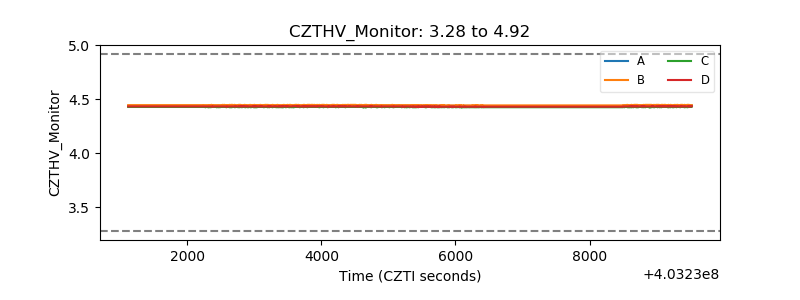 |
| D_VDD | 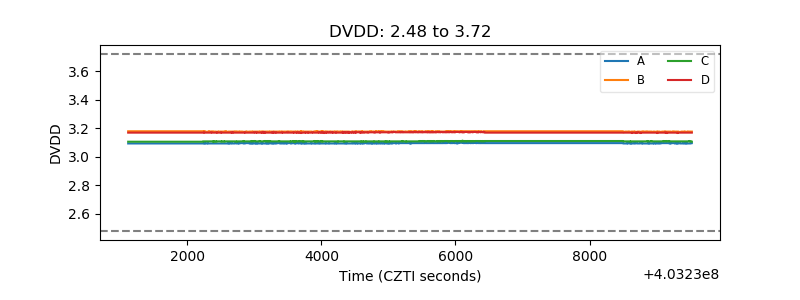 |
| Temperature 1 |  |
| Veto HV Monitor | 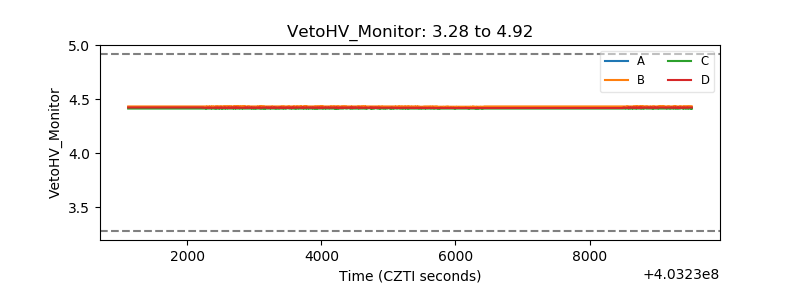 |
| Veto LLD | 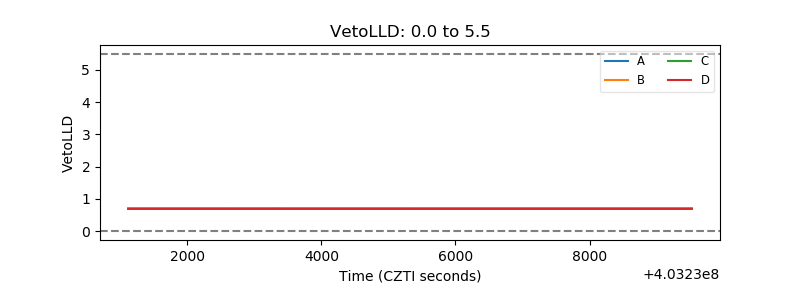 |
| Alpha Counter | 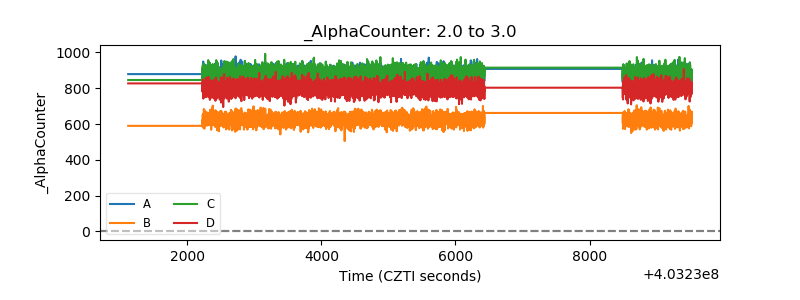 |
| _CPM_Rate | 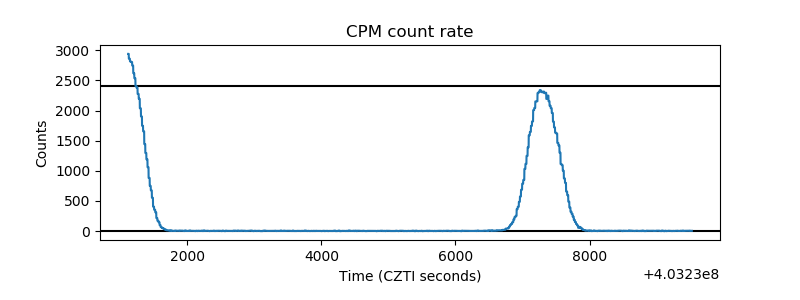 |
| CZT Counter |  |
| +2.5 Volts monitor | 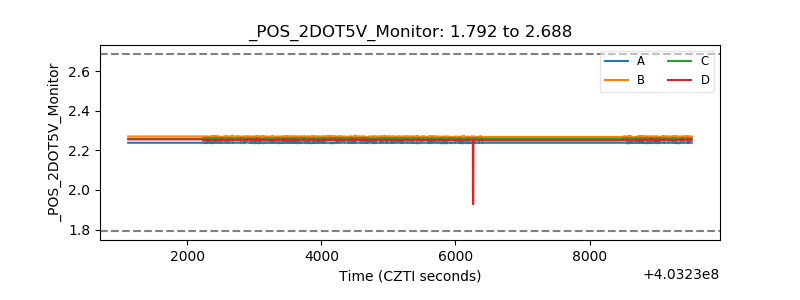 |
| +5 Volts monitor | 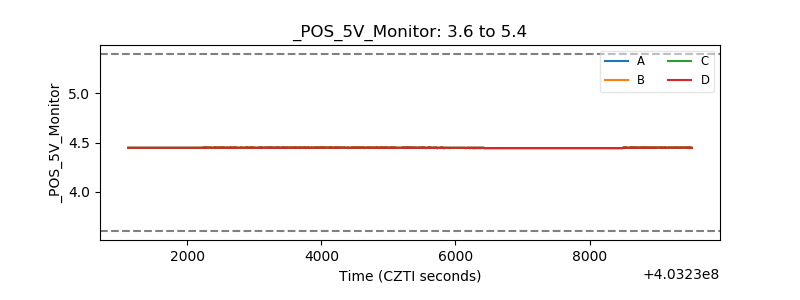 |
| _ROLL_ROT | 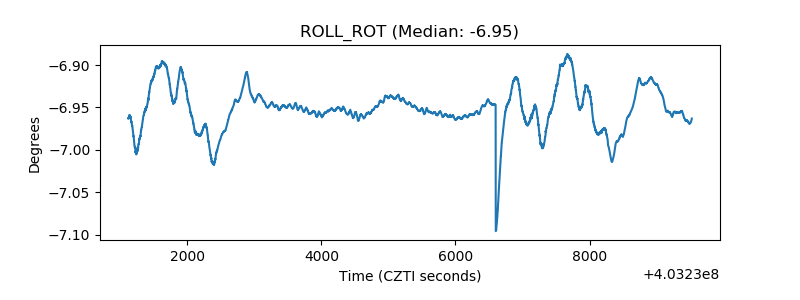 |
| _Roll_DEC | 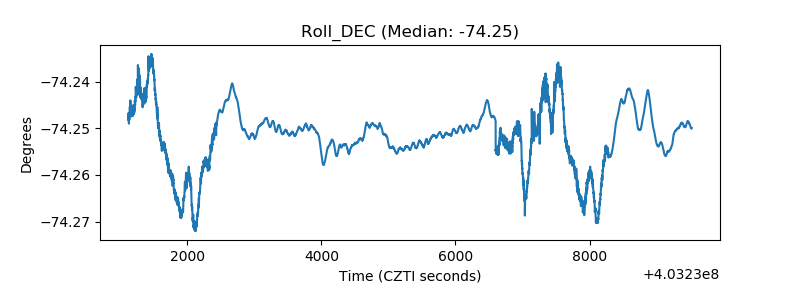 |
| _Roll_RA | 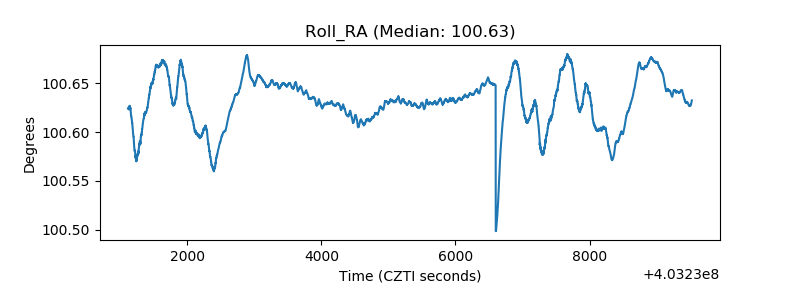 |
| Veto Counter | 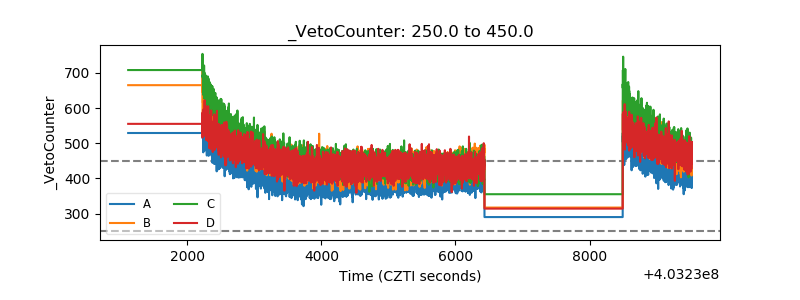 |