| Param | Original file | Final file |
|---|---|---|
| Filename | modeM0/AS1A11_044T01_9000005360_38057cztM0_level2.fits | modeM0/AS1A11_044T01_9000005360_38057cztM0_level2_quad_clean.evt |
| Size (bytes) | 493,444,800 | 87,301,440 |
| Size | 470.6 MB | 83.3 MB |
| Events in quadrant A | 2,726,193 | 649,038 |
| Events in quadrant B | 2,747,585 | 672,782 |
| Events in quadrant C | 5,117,273 | 565,076 |
| Events in quadrant D | 7,282,352 | 403,091 |
| Mode SS | |||
|---|---|---|---|
| Quadrant | BADHDUFLAG | Total packets | Discarded packets |
| A | 0 | 104 | 0 |
| B | 0 | 104 | 0 |
| C | 0 | 104 | 0 |
| D | 0 | 104 | 0 |
| Mode M9 | |||
|---|---|---|---|
| Quadrant | BADHDUFLAG | Total packets | Discarded packets |
| A | 0 | 23 | 0 |
| B | 0 | 23 | 0 |
| C | 0 | 23 | 0 |
| D | 0 | 24 | 0 |
| Mode M0 | |||
|---|---|---|---|
| Quadrant | BADHDUFLAG | Total packets | Discarded packets |
| A | 0 | 10980 | 3 |
| B | 0 | 11256 | 2 |
| C | 0 | 18444 | 2 |
| D | 0 | 24994 | 2 |
| Quadrant | Total seconds | Saturated seconds | Saturation percentage |
|---|---|---|---|
| A | 5042 | 7 | 0.138834% |
| B | 5042 | 78 | 1.547005% |
| C | 5042 | 900 | 17.850060% |
| D | 5042 | 1813 | 35.957953% |
Noise dominated data is calculated using 1-second bins in cleaned event files. If a bin has >2000 counts, and if more than 50% of those come from <1% of pixels, then it is considered to be noise-dominated and hence unusable.
| Quadrant | # 1 sec bins | Bins with >0 counts | Bins with >2000 counts | High rate bins dominated by noise | Noise dominated (total time) | Noise dominated (detector-on time) | Marked lightcurve |
|---|---|---|---|---|---|---|---|
| A | 7165 | 5043 | 6 | 6 | 0.08% | 0.12% | 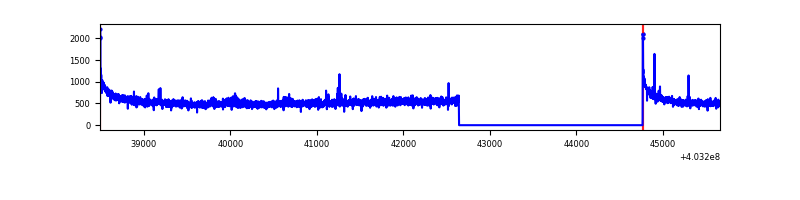 |
| B | 7165 | 5043 | 60 | 60 | 0.84% | 1.19% | 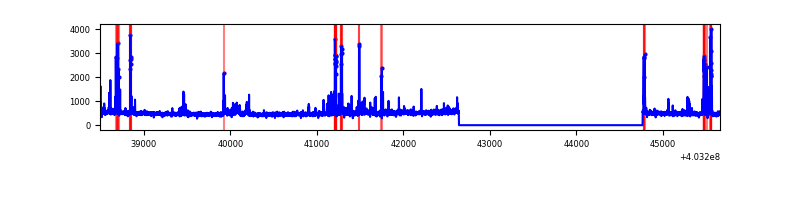 |
| C | 7165 | 5043 | 768 | 768 | 10.72% | 15.23% | 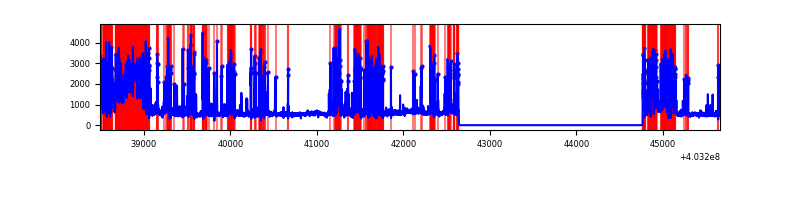 |
| D | 7165 | 5043 | 1727 | 1727 | 24.10% | 34.25% | 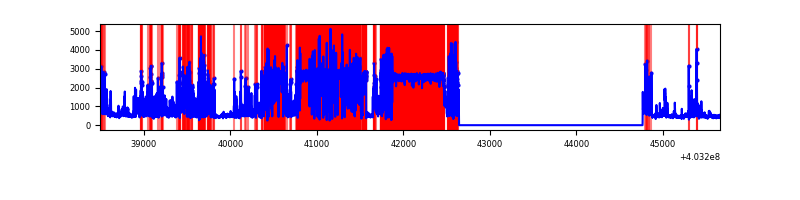 |
Top three noisy pixels from each quadrant. If the there are fewer than three noisy pixels in the level2.evt file, extra rows are filled as -1
| Pixel properties | Quadrant properties | ||||||
|---|---|---|---|---|---|---|---|
| Quadrant | DetID | PixID | Counts | Sigma | Mean | Median | Sigma |
| A | 10 | 83 | 357436 | 2971.86 | 600 | 589 | 120.1 |
| A | 12 | 227 | 20886 | 169.04 | 600 | 589 | 120.1 |
| A | 13 | 6 | 11643 | 92.06 | 600 | 589 | 120.1 |
| B | 5 | 172 | 157765 | 1411.48 | 599 | 584 | 111.4 |
| B | 4 | 171 | 126214 | 1128.15 | 599 | 584 | 111.4 |
| B | 4 | 232 | 47218 | 418.77 | 599 | 584 | 111.4 |
| C | 1 | 23 | 2600575 | 20394.25 | 557 | 562 | 127.5 |
| C | 15 | 214 | 196240 | 1534.88 | 557 | 562 | 127.5 |
| C | 3 | 233 | 123453 | 963.94 | 557 | 562 | 127.5 |
| D | 12 | 227 | 3553354 | 31197.19 | 469 | 456 | 113.9 |
| D | 12 | 233 | 1417461 | 12442.4 | 469 | 456 | 113.9 |
| D | 13 | 249 | 216756 | 1899.28 | 469 | 456 | 113.9 |
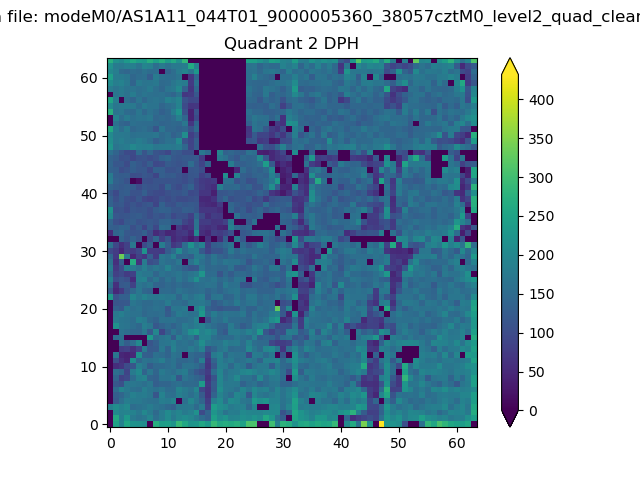
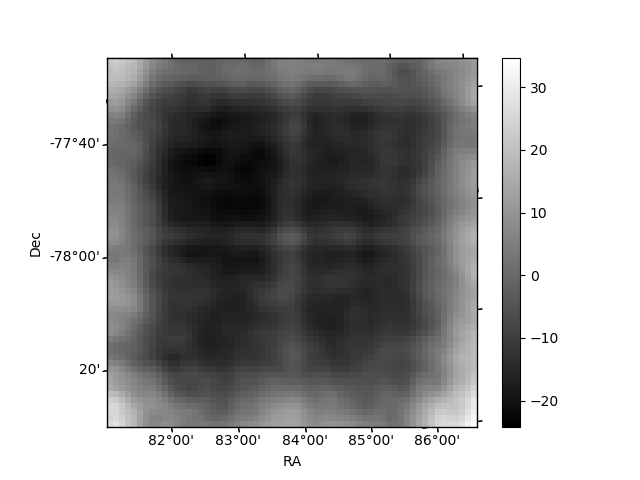
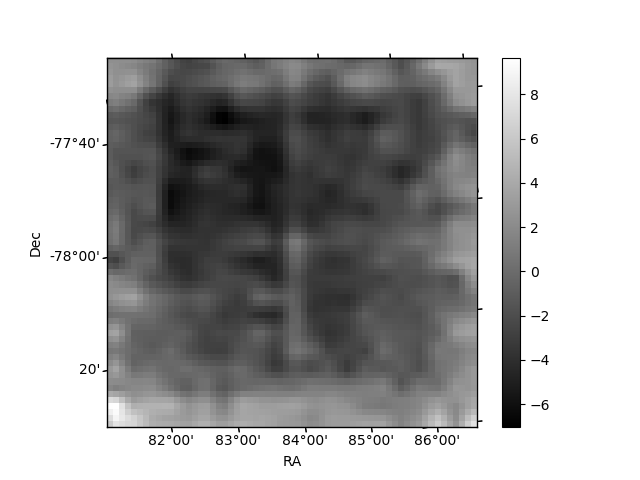
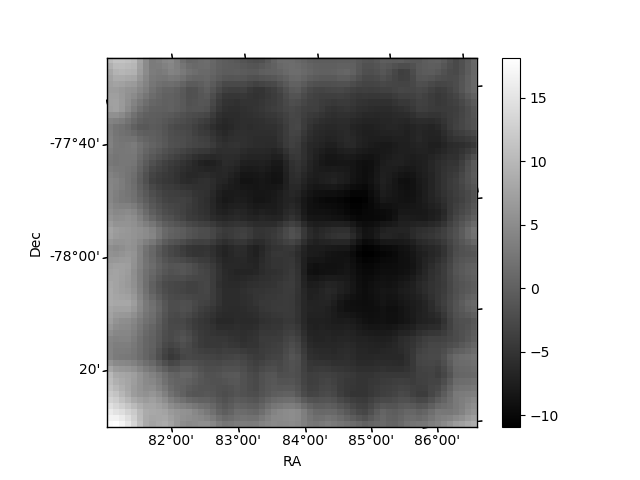
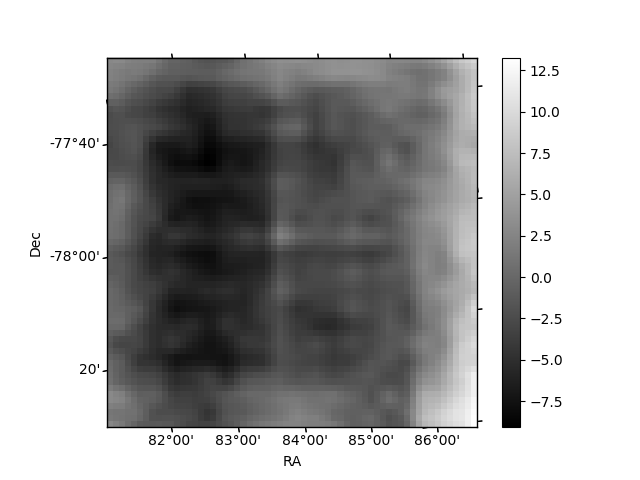
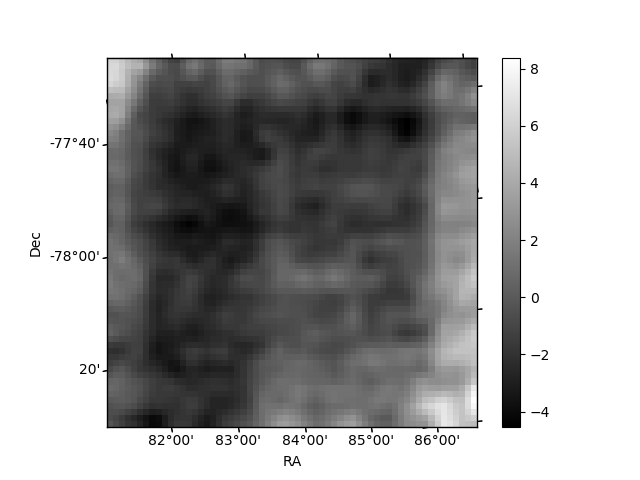
Histogram calculated using DETX and DETY for each event in the final _common_clean file
| Quadrant A | 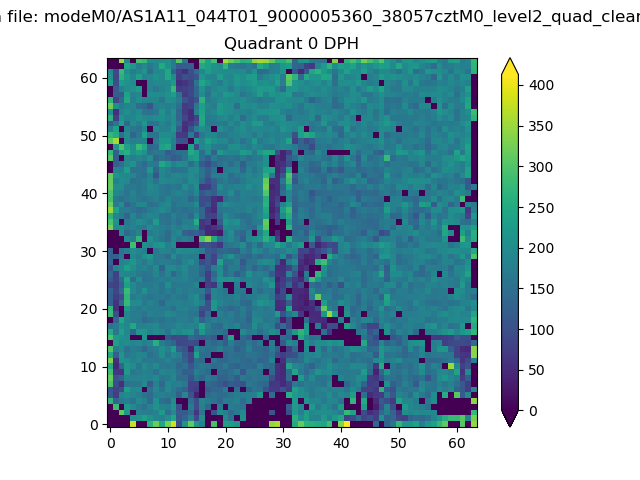 |
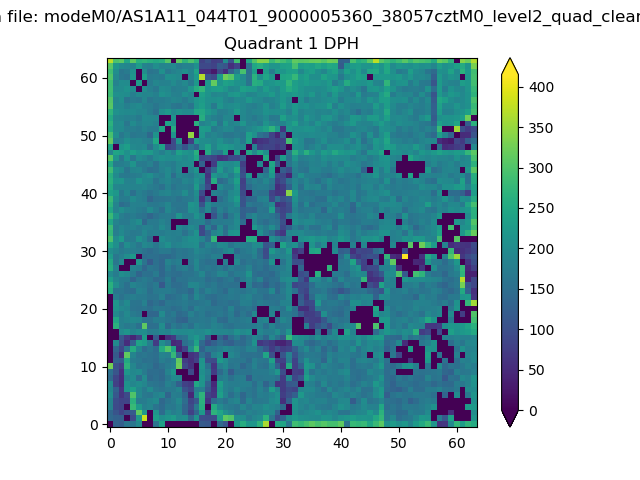 |
Quadrant B |
|---|---|---|---|
| Quadrant D | 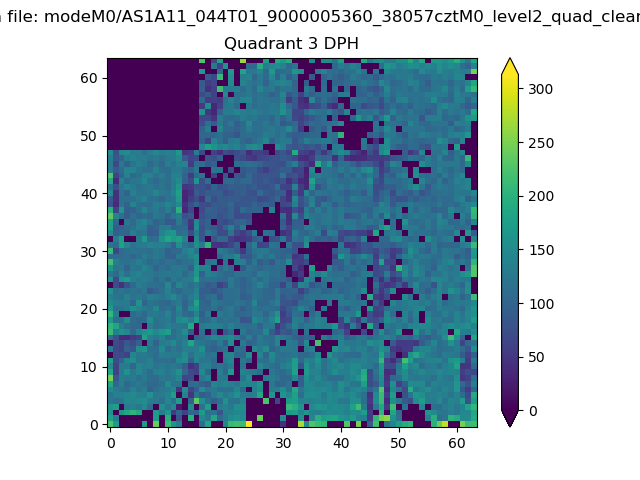 |
 |
Quadrant C |
| Plot type | Count rate plots | Images |
|---|---|---|
| Comparison with Poisson distribution Blue bars denote a histogram of data divided into 1 sec bins. Red curve is a Poisson curve with rate = median count rate of data. |
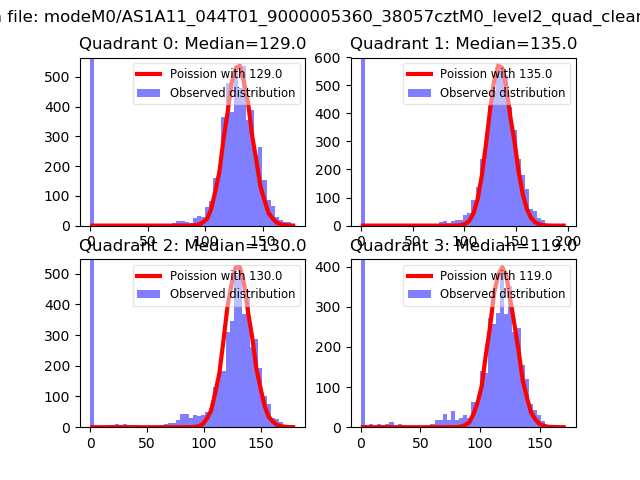 |
 |
| Quadrant-wise count rates Data is divided into 100 sec bins |
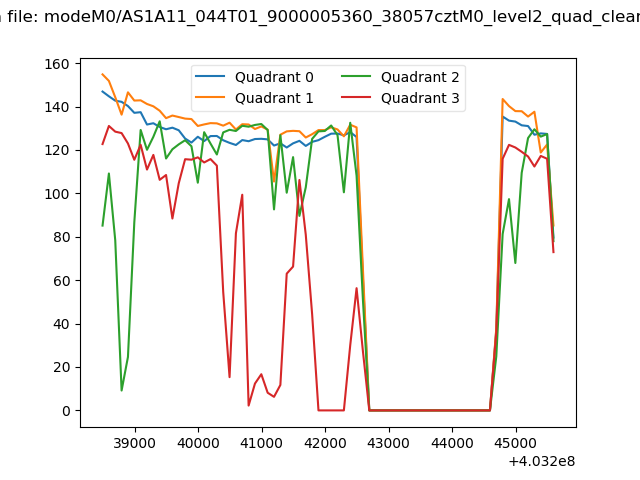 |
|
| Module-wise count rates for Quadrant A Data is divided into 100 sec bins |
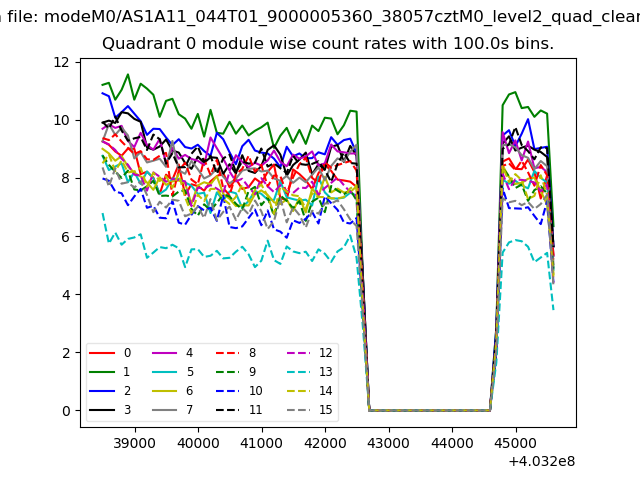 |
 |
| Module-wise count rates for Quadrant B Data is divided into 100 sec bins |
 |
 |
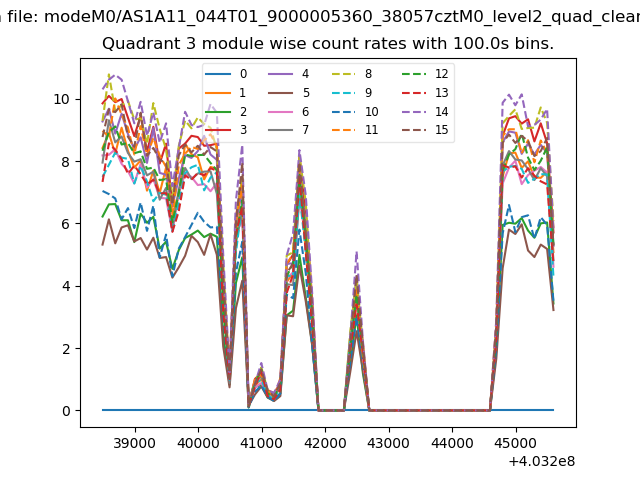
| Module-wise count rates for Quadrant C Data is divided into 100 sec bins |
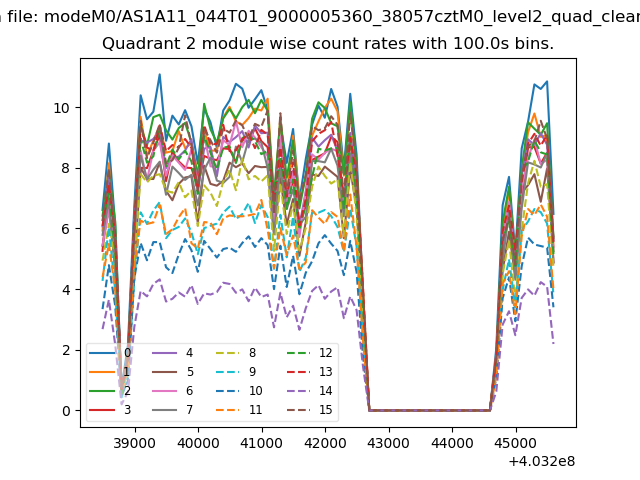 |
 |
| Module-wise count rates for Quadrant D Data is divided into 100 sec bins |
 |
 |
| Parameter | Plot |
|---|---|
| CZT HV Monitor |  |
| D_VDD | 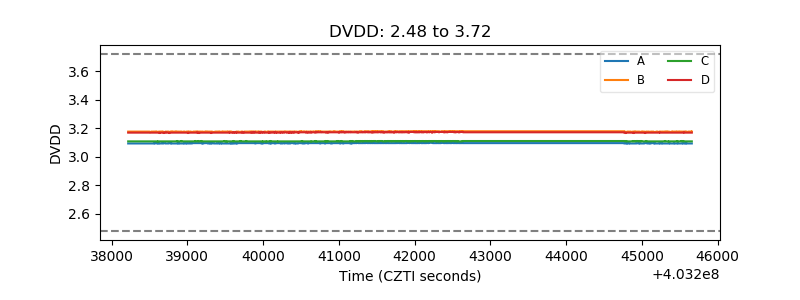 |
| Temperature 1 | 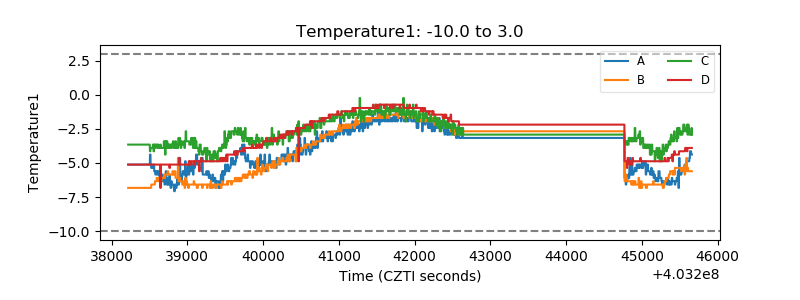 |
| Veto HV Monitor | 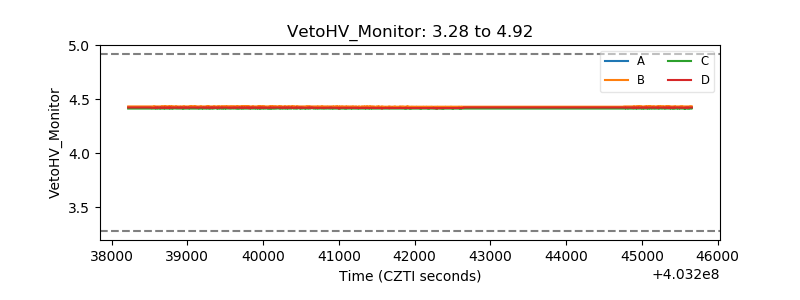 |
| Veto LLD | 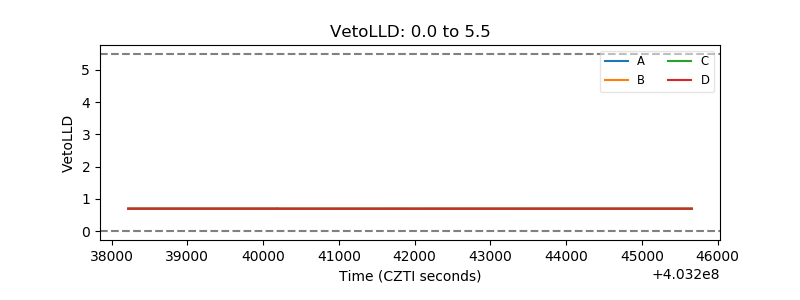 |
| Alpha Counter | 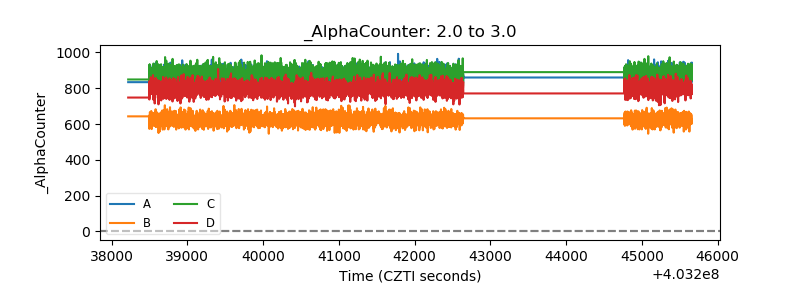 |
| _CPM_Rate | 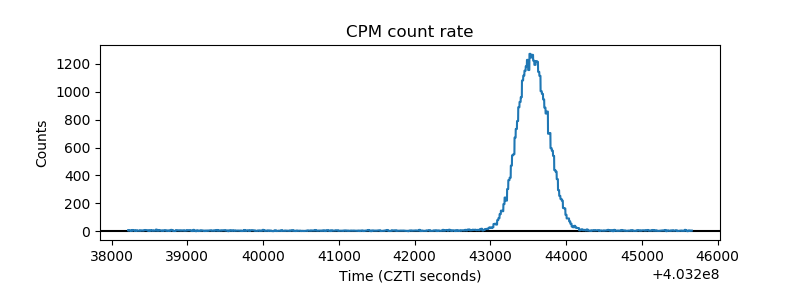 |
| CZT Counter | 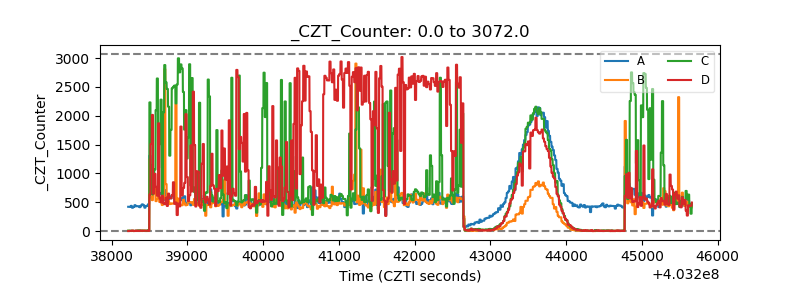 |
| +2.5 Volts monitor | 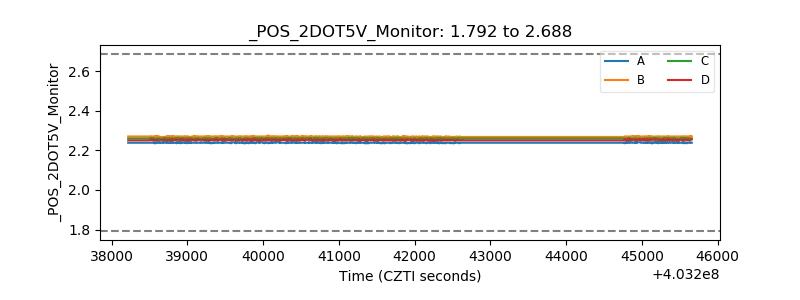 |
| +5 Volts monitor | 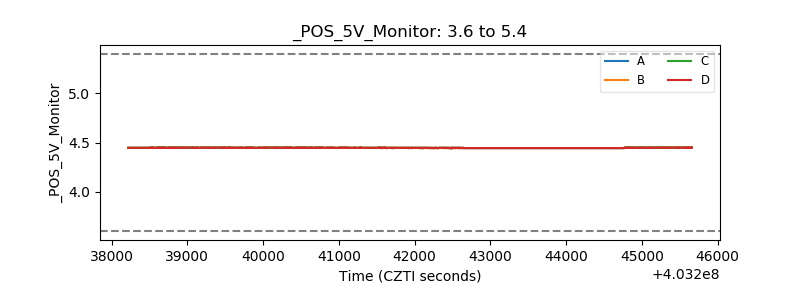 |
| _ROLL_ROT | 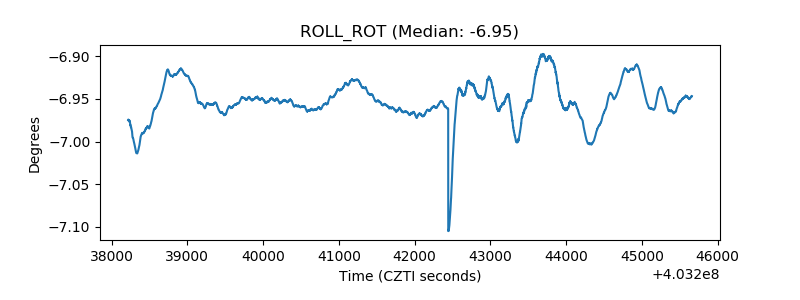 |
| _Roll_DEC | 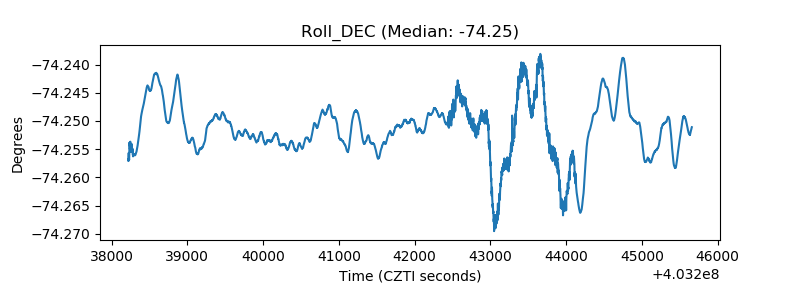 |
| _Roll_RA | 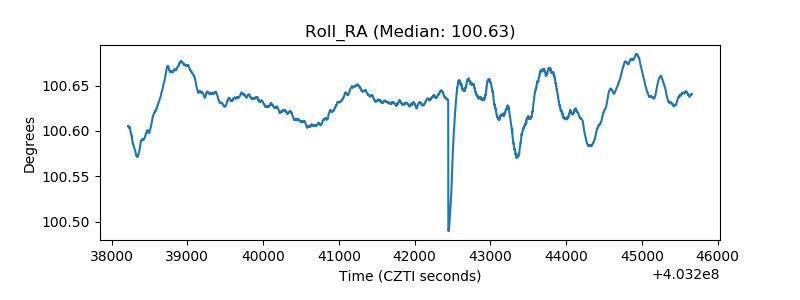 |
| Veto Counter | 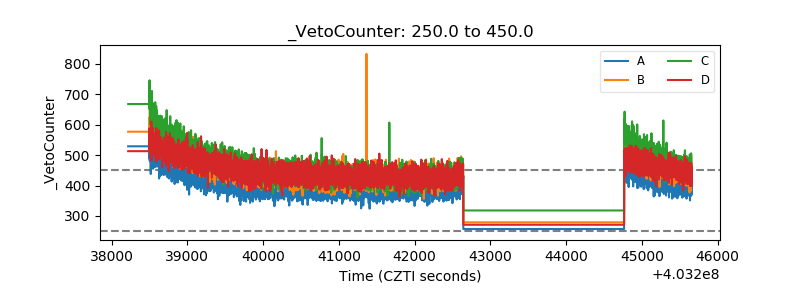 |