| Param | Original file | Final file |
|---|---|---|
| Filename | modeM0/AS1A11_044T01_9000005360_38058cztM0_level2.fits | modeM0/AS1A11_044T01_9000005360_38058cztM0_level2_quad_clean.evt |
| Size (bytes) | 361,915,200 | 89,029,440 |
| Size | 345.1 MB | 84.9 MB |
| Events in quadrant A | 2,684,154 | 608,879 |
| Events in quadrant B | 3,565,258 | 599,112 |
| Events in quadrant C | 3,994,619 | 574,107 |
| Events in quadrant D | 2,766,865 | 566,428 |
| Mode SS | |||
|---|---|---|---|
| Quadrant | BADHDUFLAG | Total packets | Discarded packets |
| A | 0 | 100 | 0 |
| B | 0 | 100 | 0 |
| C | 0 | 100 | 0 |
| D | 0 | 100 | 0 |
| Mode M9 | |||
|---|---|---|---|
| Quadrant | BADHDUFLAG | Total packets | Discarded packets |
| A | 0 | 22 | 0 |
| B | 0 | 22 | 0 |
| C | 0 | 22 | 0 |
| D | 0 | 22 | 0 |
| Mode M0 | |||
|---|---|---|---|
| Quadrant | BADHDUFLAG | Total packets | Discarded packets |
| A | 0 | 10844 | 3 |
| B | 0 | 13832 | 2 |
| C | 0 | 14826 | 2 |
| D | 0 | 11387 | 2 |
| Quadrant | Total seconds | Saturated seconds | Saturation percentage |
|---|---|---|---|
| A | 4956 | 9 | 0.181598% |
| B | 4956 | 369 | 7.445521% |
| C | 4956 | 481 | 9.705408% |
| D | 4957 | 73 | 1.472665% |
Noise dominated data is calculated using 1-second bins in cleaned event files. If a bin has >2000 counts, and if more than 50% of those come from <1% of pixels, then it is considered to be noise-dominated and hence unusable.
| Quadrant | # 1 sec bins | Bins with >0 counts | Bins with >2000 counts | High rate bins dominated by noise | Noise dominated (total time) | Noise dominated (detector-on time) | Marked lightcurve |
|---|---|---|---|---|---|---|---|
| A | 7078 | 4957 | 7 | 7 | 0.10% | 0.14% | 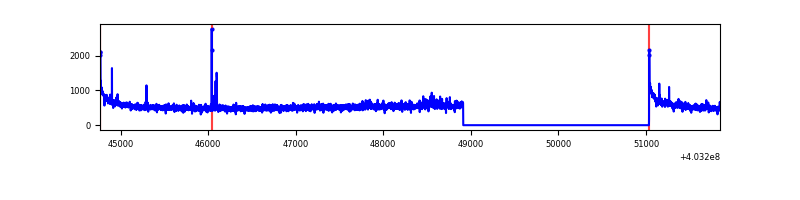 |
| B | 7078 | 4957 | 266 | 266 | 3.76% | 5.37% | 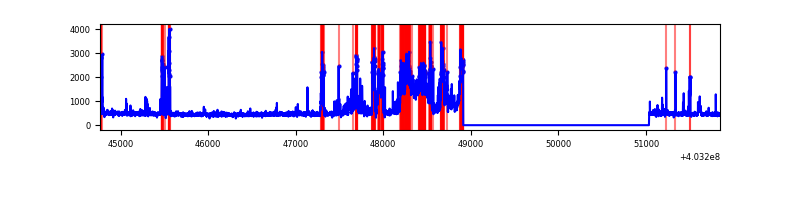 |
| C | 7078 | 4957 | 417 | 417 | 5.89% | 8.41% | 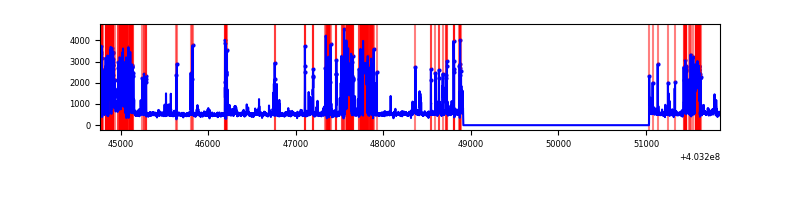 |
| D | 7079 | 4958 | 62 | 62 | 0.88% | 1.25% | 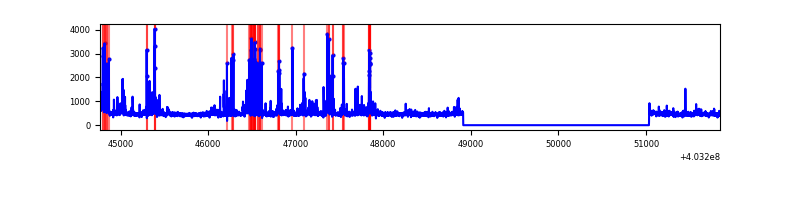 |
Top three noisy pixels from each quadrant. If the there are fewer than three noisy pixels in the level2.evt file, extra rows are filled as -1
| Pixel properties | Quadrant properties | ||||||
|---|---|---|---|---|---|---|---|
| Quadrant | DetID | PixID | Counts | Sigma | Mean | Median | Sigma |
| A | 10 | 83 | 363779 | 3095.78 | 577 | 566 | 117.3 |
| A | 12 | 16 | 32806 | 274.79 | 577 | 566 | 117.3 |
| A | 13 | 248 | 17667 | 145.76 | 577 | 566 | 117.3 |
| B | 5 | 172 | 1032800 | 9780.09 | 564 | 549 | 105.5 |
| B | 4 | 171 | 198601 | 1876.45 | 564 | 549 | 105.5 |
| B | 0 | 229 | 50108 | 469.55 | 564 | 549 | 105.5 |
| C | 1 | 23 | 1495747 | 11772.88 | 550 | 552 | 127.0 |
| C | 15 | 214 | 200536 | 1574.64 | 550 | 552 | 127.0 |
| C | 3 | 233 | 108230 | 847.84 | 550 | 552 | 127.0 |
| D | 12 | 227 | 254330 | 1833.26 | 574 | 560 | 138.4 |
| D | 13 | 249 | 84246 | 604.55 | 574 | 560 | 138.4 |
| D | 2 | 250 | 56718 | 405.69 | 574 | 560 | 138.4 |
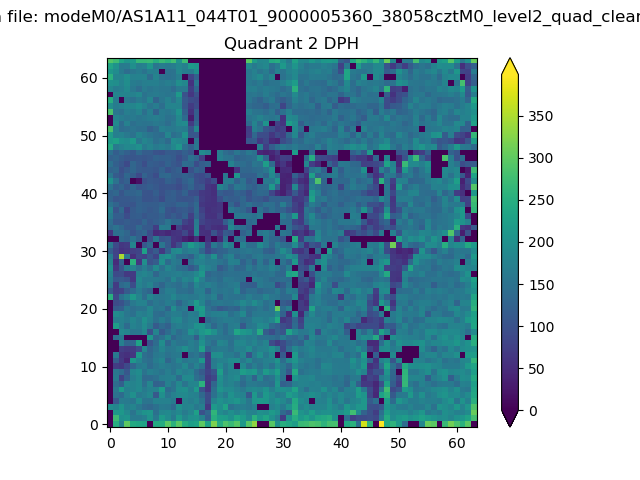
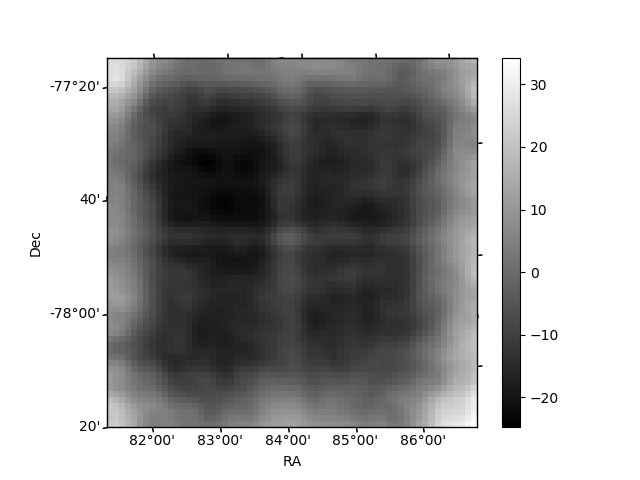
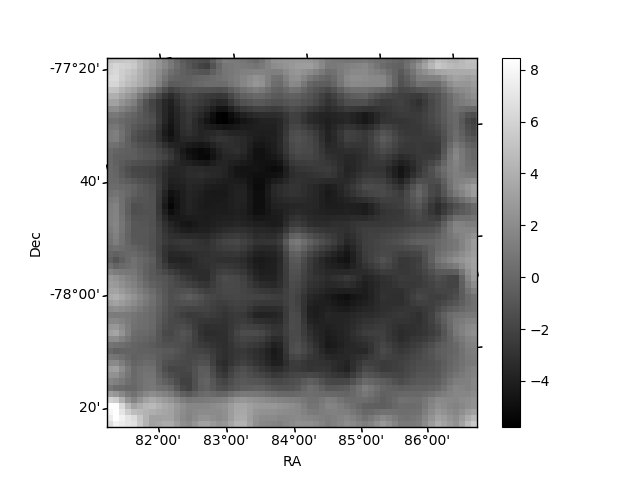
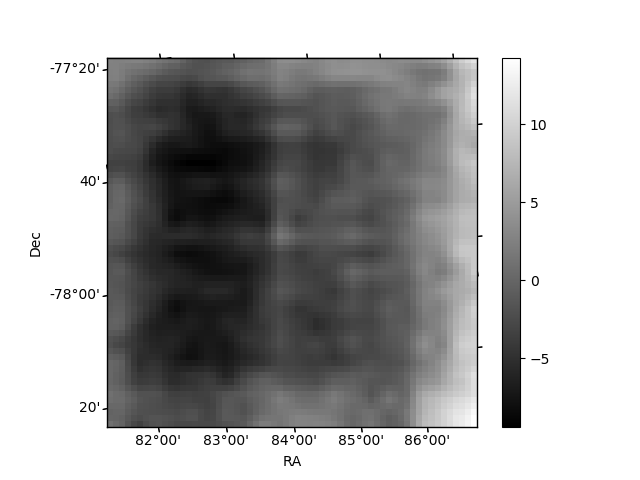
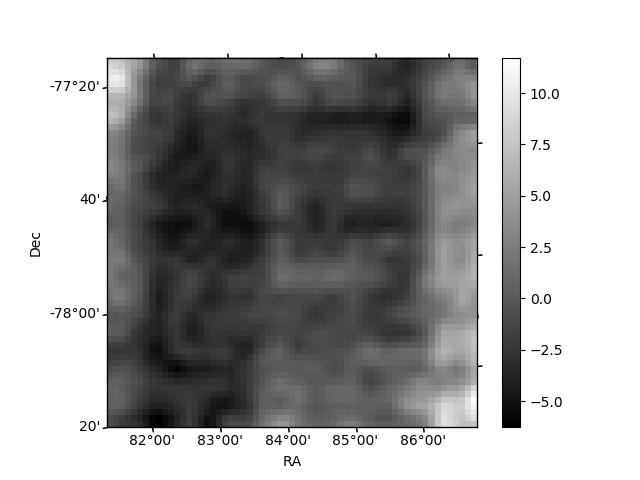
Histogram calculated using DETX and DETY for each event in the final _common_clean file
| Quadrant A | 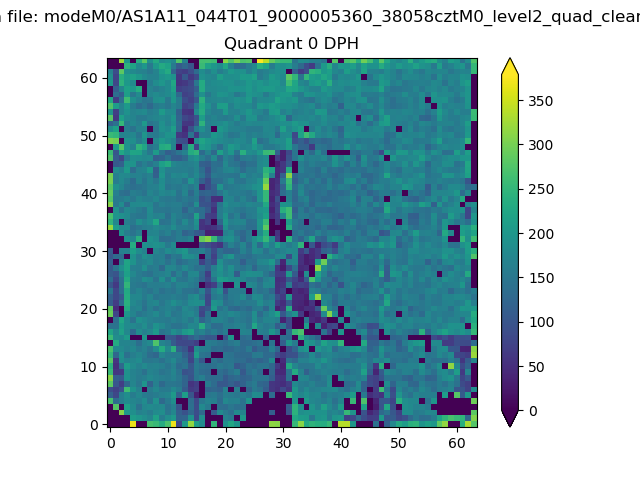 |
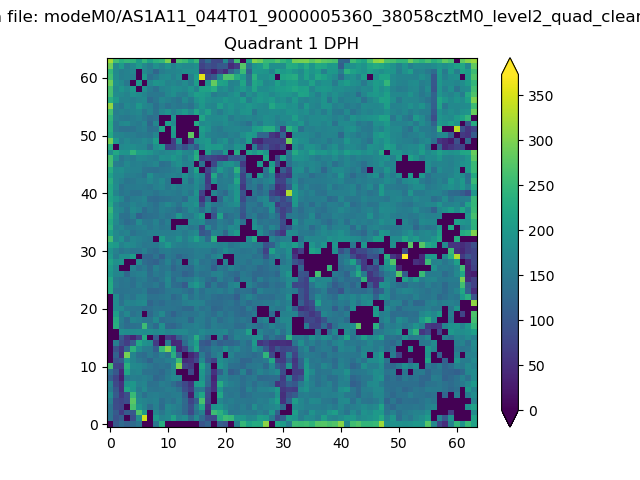 |
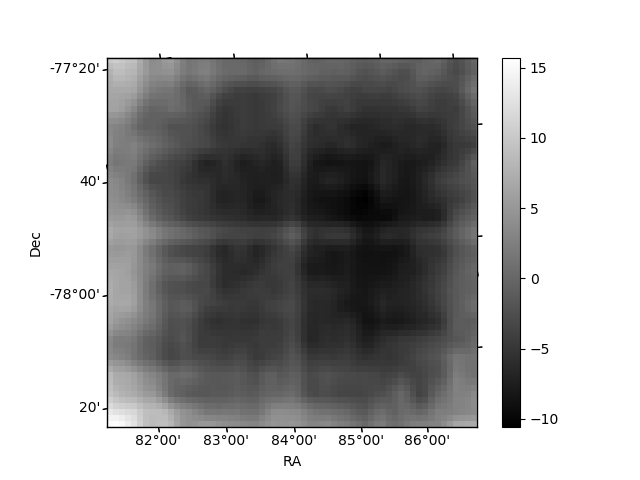
Quadrant B |
|---|---|---|---|
| Quadrant D | 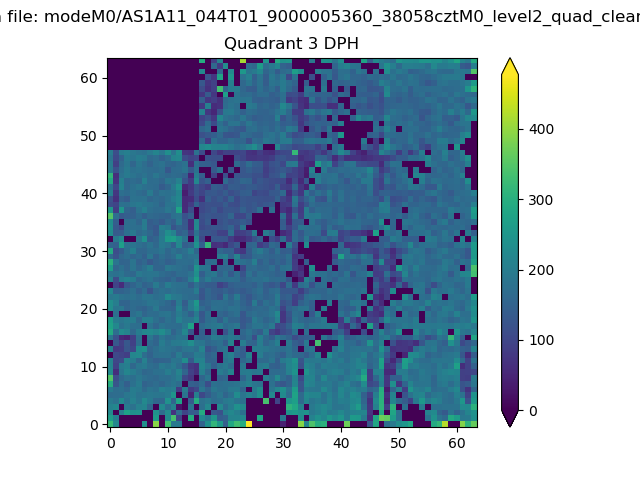 |
 |
Quadrant C |
| Plot type | Count rate plots | Images |
|---|---|---|
| Comparison with Poisson distribution Blue bars denote a histogram of data divided into 1 sec bins. Red curve is a Poisson curve with rate = median count rate of data. |
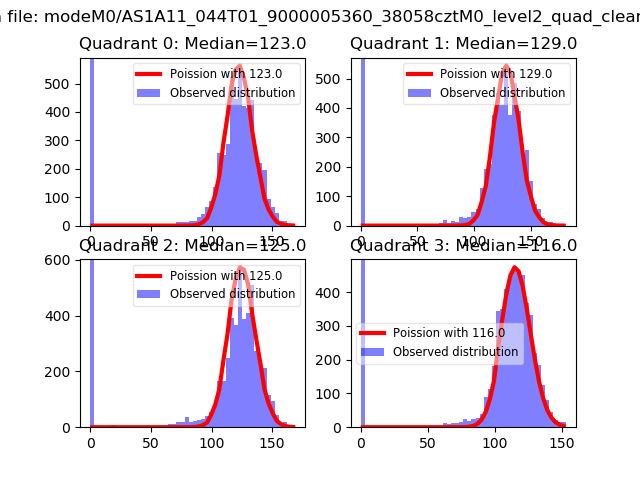 |
 |
| Quadrant-wise count rates Data is divided into 100 sec bins |
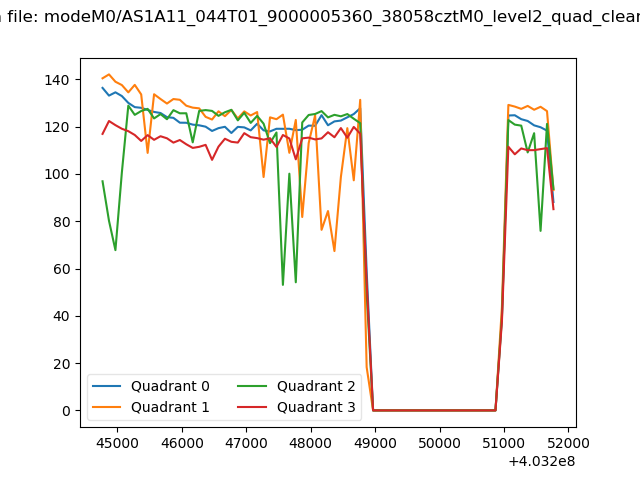 |
|
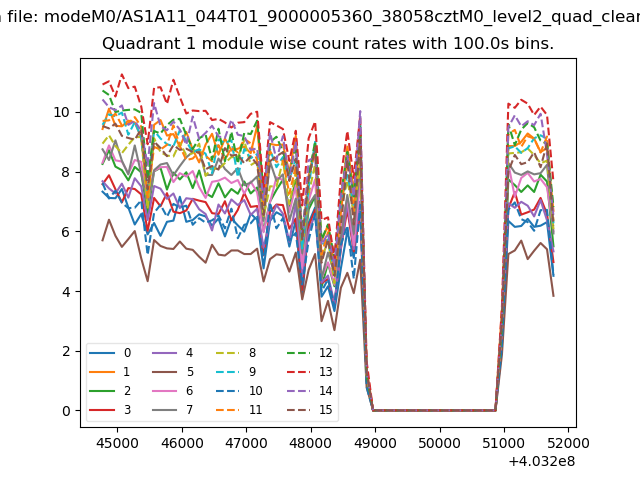
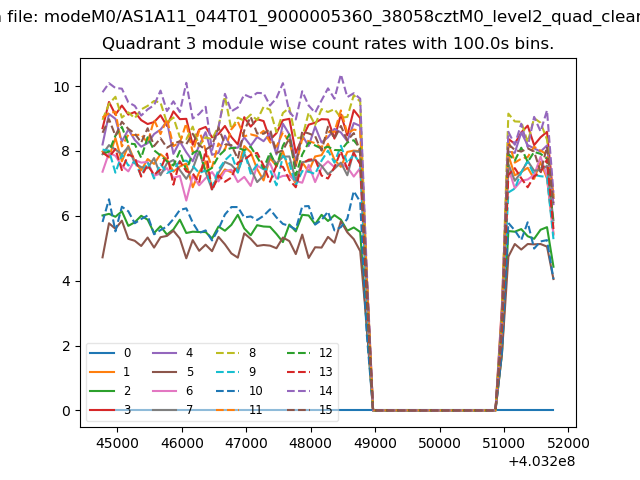
| Module-wise count rates for Quadrant A Data is divided into 100 sec bins |
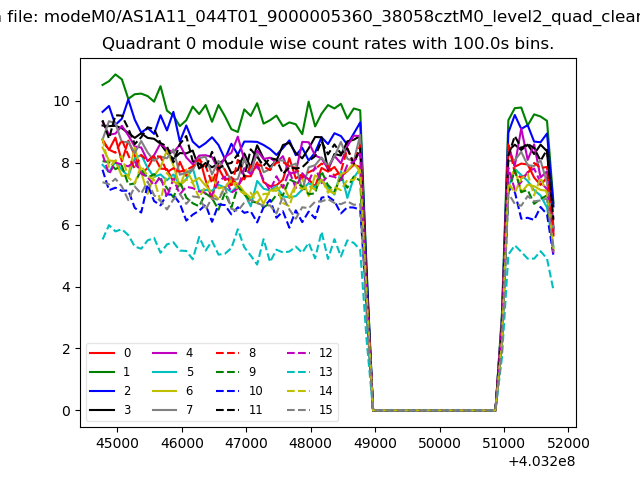 |
 |
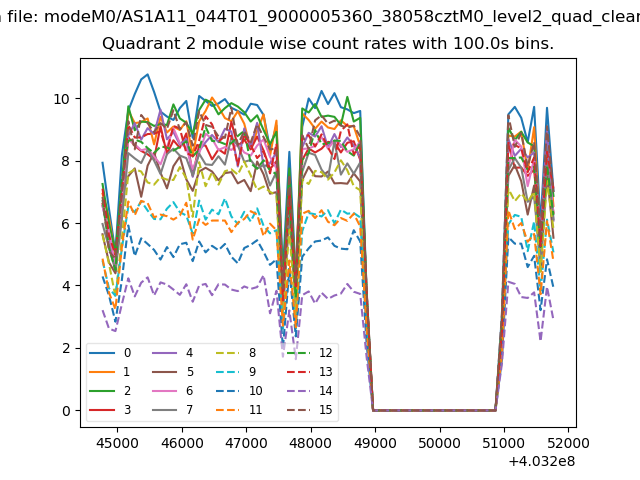
| Module-wise count rates for Quadrant B Data is divided into 100 sec bins |
 |
 |
| Module-wise count rates for Quadrant C Data is divided into 100 sec bins |
 |
 |
| Module-wise count rates for Quadrant D Data is divided into 100 sec bins |
 |
 |
| Parameter | Plot |
|---|---|
| CZT HV Monitor |  |
| D_VDD | 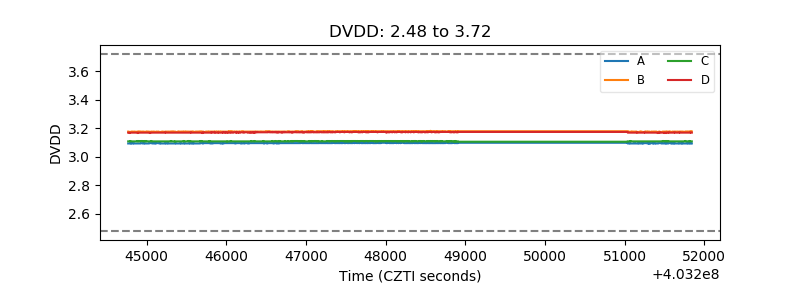 |
| Temperature 1 | 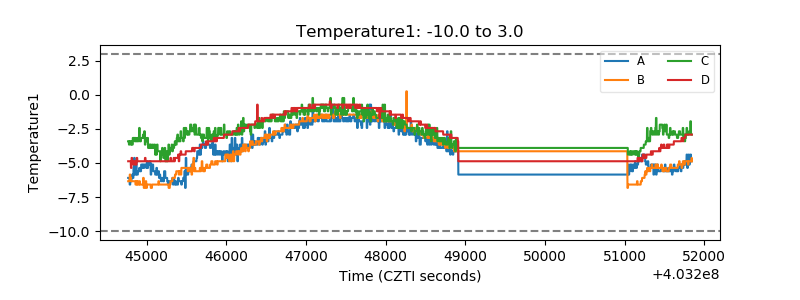 |
| Veto HV Monitor | 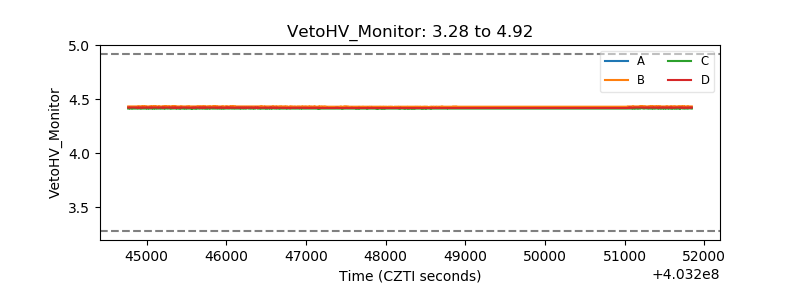 |
| Veto LLD | 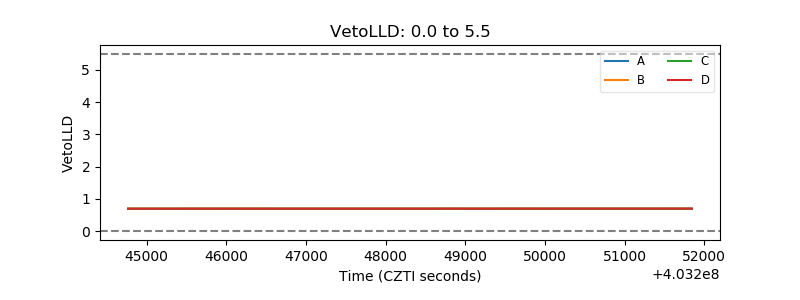 |
| Alpha Counter | 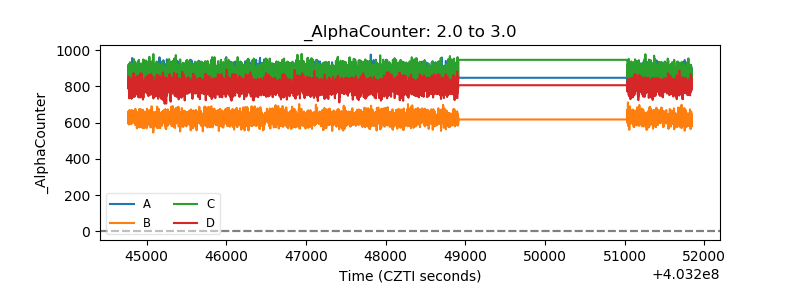 |
| _CPM_Rate |  |
| CZT Counter | 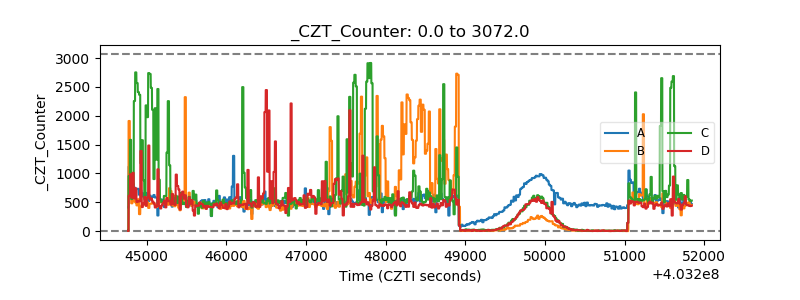 |
| +2.5 Volts monitor | 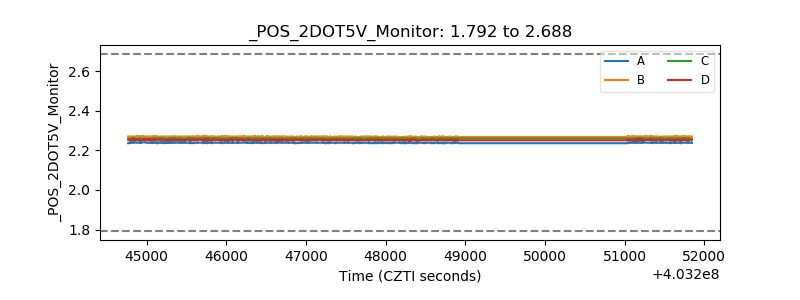 |
| +5 Volts monitor | 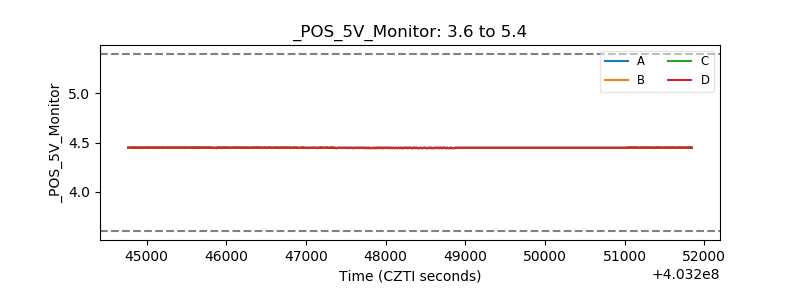 |
| _ROLL_ROT | 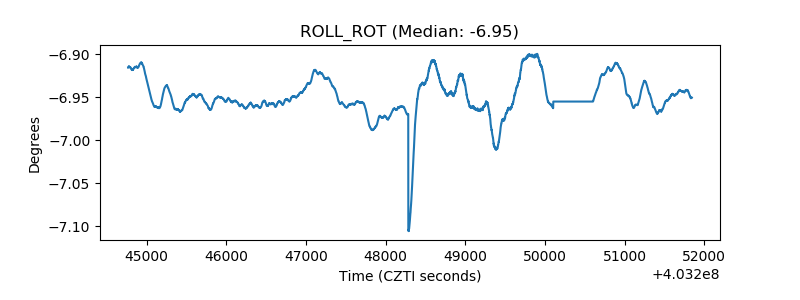 |
| _Roll_DEC | 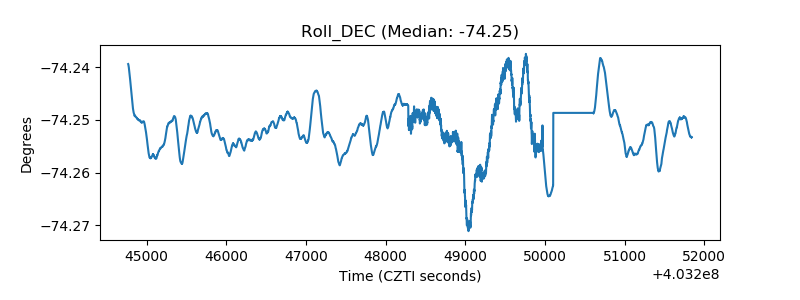 |
| _Roll_RA | 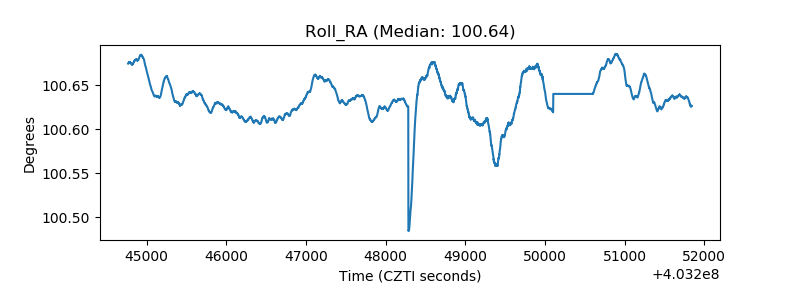 |
| Veto Counter | 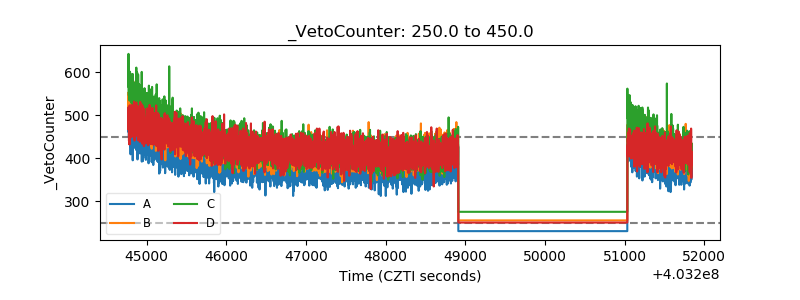 |