| Param | Original file | Final file |
|---|---|---|
| Filename | modeM0/AS1A11_044T01_9000005360_38059cztM0_level2.fits | modeM0/AS1A11_044T01_9000005360_38059cztM0_level2_quad_clean.evt |
| Size (bytes) | 385,917,120 | 87,655,680 |
| Size | 368.0 MB | 83.6 MB |
| Events in quadrant A | 2,950,488 | 595,614 |
| Events in quadrant B | 3,259,257 | 596,677 |
| Events in quadrant C | 3,811,541 | 581,432 |
| Events in quadrant D | 3,869,292 | 524,701 |
| Mode SS | |||
|---|---|---|---|
| Quadrant | BADHDUFLAG | Total packets | Discarded packets |
| A | 0 | 104 | 0 |
| B | 0 | 104 | 0 |
| C | 0 | 104 | 0 |
| D | 0 | 104 | 0 |
| Mode M9 | |||
|---|---|---|---|
| Quadrant | BADHDUFLAG | Total packets | Discarded packets |
| A | 0 | 23 | 0 |
| B | 0 | 23 | 0 |
| C | 0 | 23 | 0 |
| D | 0 | 24 | 0 |
| Mode M0 | |||
|---|---|---|---|
| Quadrant | BADHDUFLAG | Total packets | Discarded packets |
| A | 0 | 11894 | 3 |
| B | 0 | 13038 | 2 |
| C | 0 | 14410 | 2 |
| D | 0 | 14836 | 2 |
| Quadrant | Total seconds | Saturated seconds | Saturation percentage |
|---|---|---|---|
| A | 5074 | 13 | 0.256208% |
| B | 5074 | 244 | 4.808829% |
| C | 5074 | 327 | 6.444620% |
| D | 5074 | 409 | 8.060702% |
Noise dominated data is calculated using 1-second bins in cleaned event files. If a bin has >2000 counts, and if more than 50% of those come from <1% of pixels, then it is considered to be noise-dominated and hence unusable.
| Quadrant | # 1 sec bins | Bins with >0 counts | Bins with >2000 counts | High rate bins dominated by noise | Noise dominated (total time) | Noise dominated (detector-on time) | Marked lightcurve |
|---|---|---|---|---|---|---|---|
| A | 7047 | 5075 | 4 | 4 | 0.06% | 0.08% | 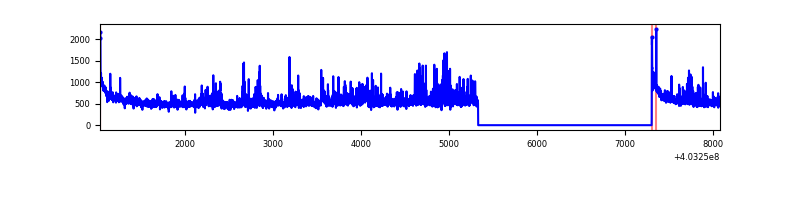 |
| B | 7047 | 5075 | 189 | 189 | 2.68% | 3.72% | 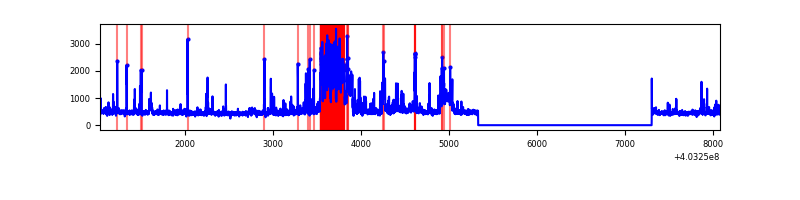 |
| C | 7047 | 5075 | 291 | 291 | 4.13% | 5.73% | 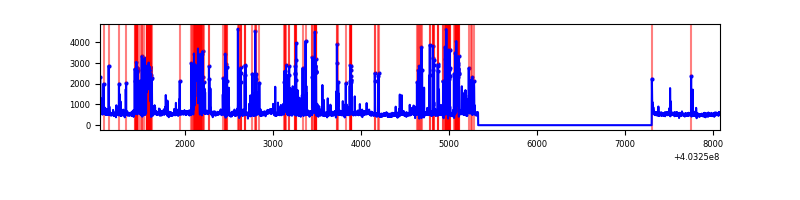 |
| D | 7047 | 5075 | 373 | 373 | 5.29% | 7.35% | 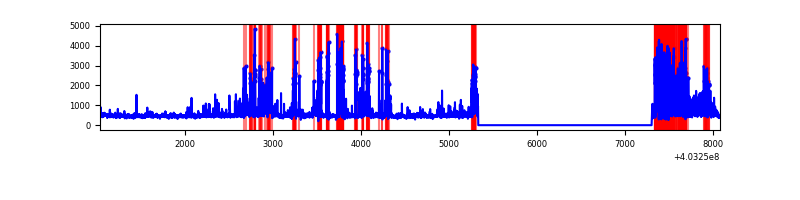 |
Top three noisy pixels from each quadrant. If the there are fewer than three noisy pixels in the level2.evt file, extra rows are filled as -1
| Pixel properties | Quadrant properties | ||||||
|---|---|---|---|---|---|---|---|
| Quadrant | DetID | PixID | Counts | Sigma | Mean | Median | Sigma |
| A | 10 | 83 | 368105 | 3155.66 | 576 | 566 | 116.5 |
| A | 12 | 16 | 262003 | 2244.68 | 576 | 566 | 116.5 |
| A | 12 | 194 | 42055 | 356.22 | 576 | 566 | 116.5 |
| B | 5 | 172 | 673944 | 6253.13 | 566 | 552 | 107.7 |
| B | 4 | 171 | 101255 | 935.13 | 566 | 552 | 107.7 |
| B | 5 | 184 | 101004 | 932.8 | 566 | 552 | 107.7 |
| C | 1 | 23 | 1116839 | 8640.01 | 556 | 560 | 129.2 |
| C | 3 | 233 | 297443 | 2297.88 | 556 | 560 | 129.2 |
| C | 15 | 214 | 208934 | 1612.82 | 556 | 560 | 129.2 |
| D | 12 | 227 | 1374272 | 10126.27 | 557 | 541 | 135.7 |
| D | 13 | 249 | 109460 | 802.88 | 557 | 541 | 135.7 |
| D | 2 | 250 | 63505 | 464.13 | 557 | 541 | 135.7 |
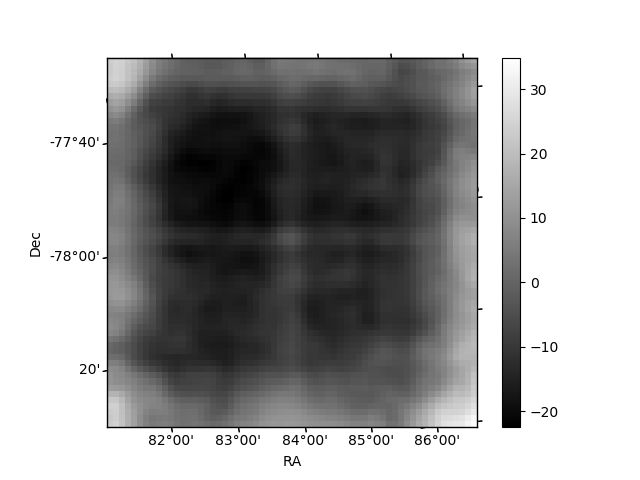
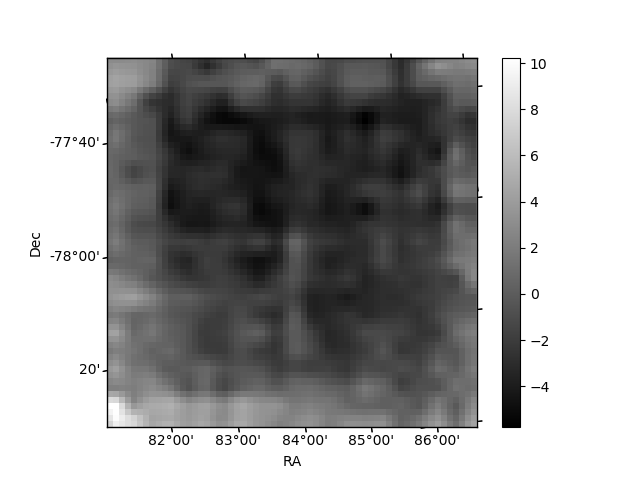
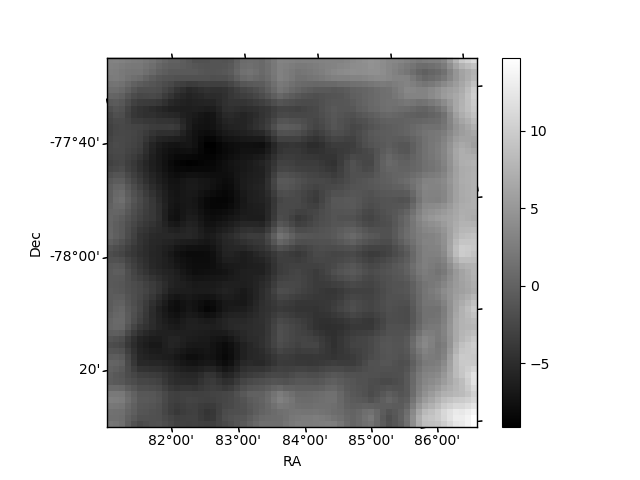
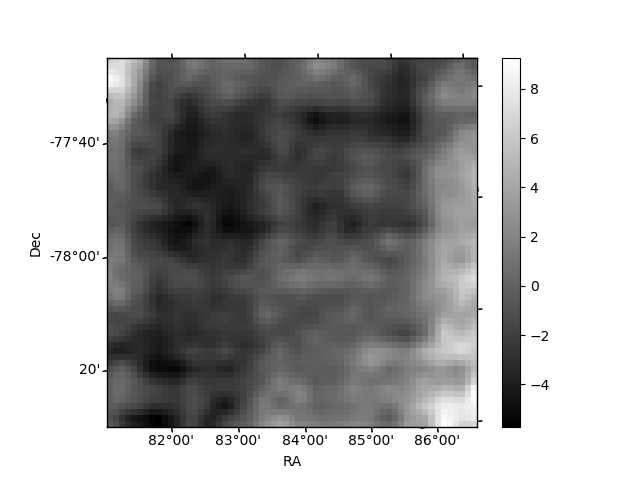
Histogram calculated using DETX and DETY for each event in the final _common_clean file
| Quadrant A | 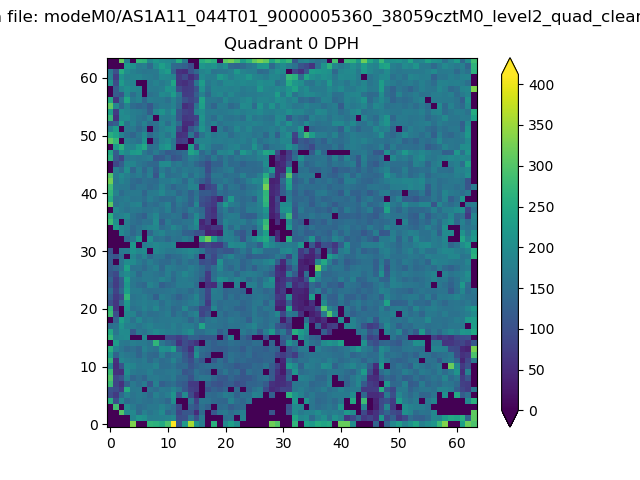 |
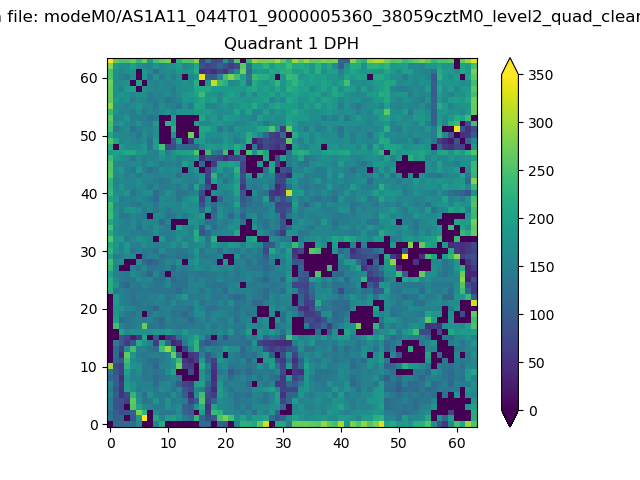 |
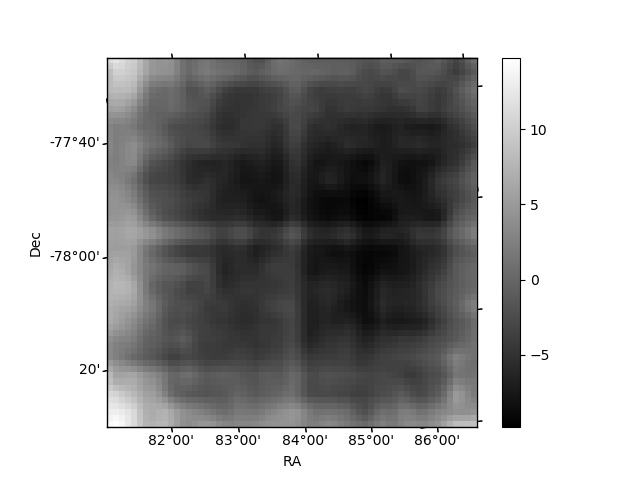
Quadrant B |
|---|---|---|---|
| Quadrant D | 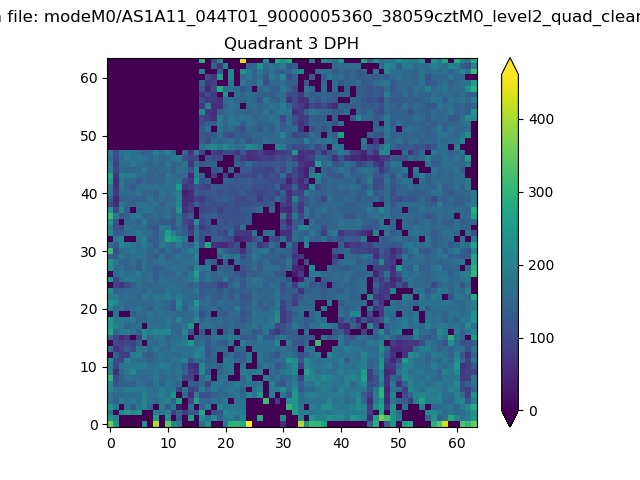 |
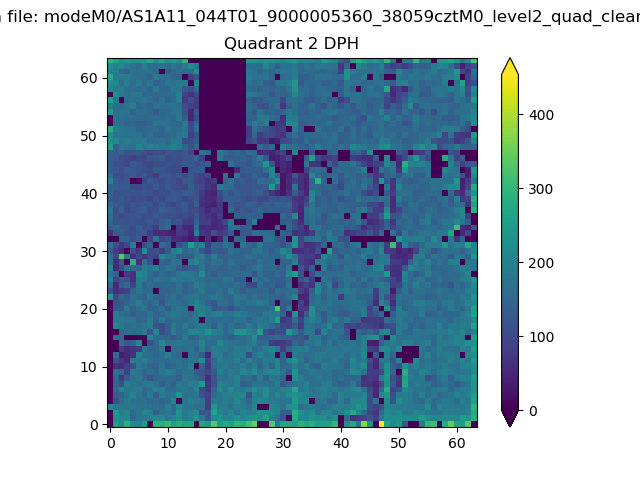 |
Quadrant C |
| Plot type | Count rate plots | Images |
|---|---|---|
| Comparison with Poisson distribution Blue bars denote a histogram of data divided into 1 sec bins. Red curve is a Poisson curve with rate = median count rate of data. |
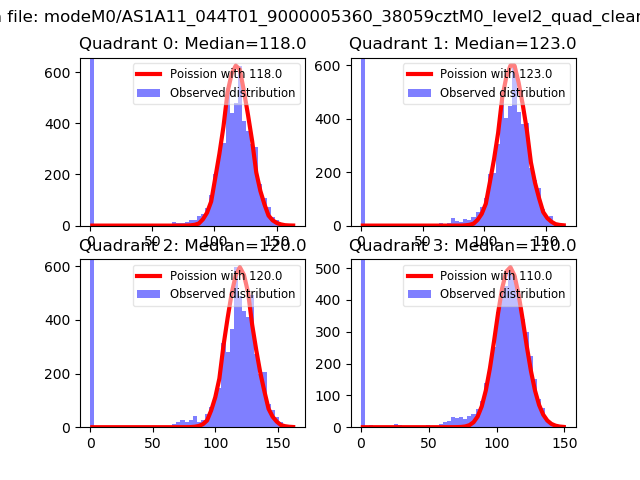 |
 |
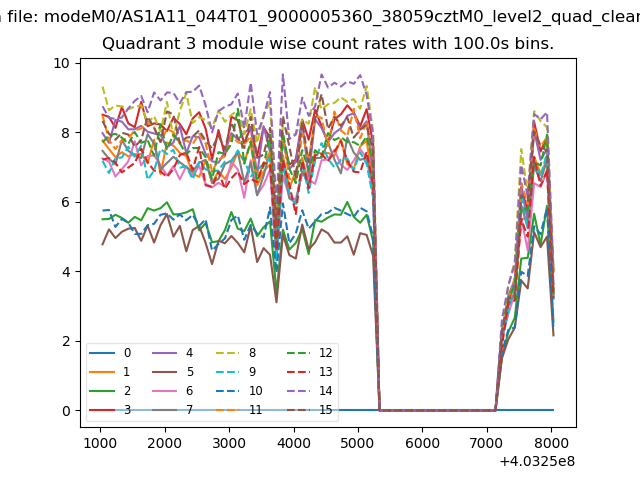
| Quadrant-wise count rates Data is divided into 100 sec bins |
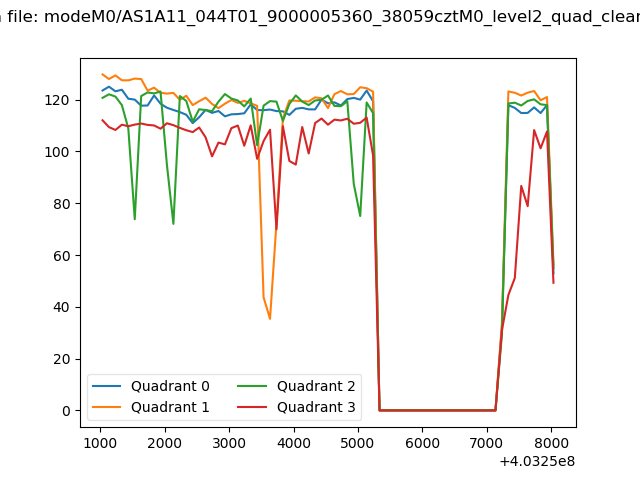 |
|
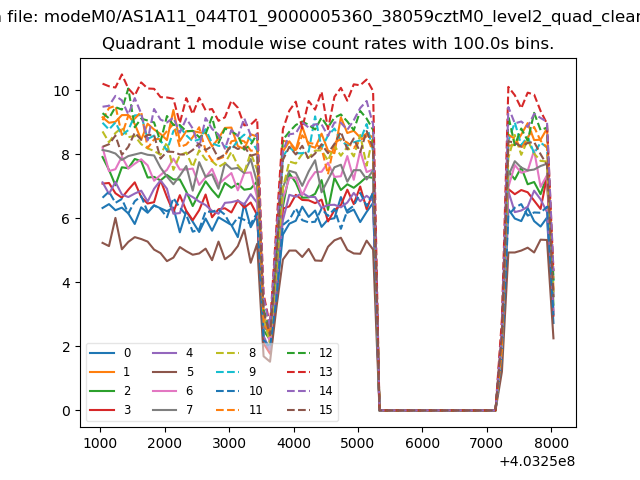
| Module-wise count rates for Quadrant A Data is divided into 100 sec bins |
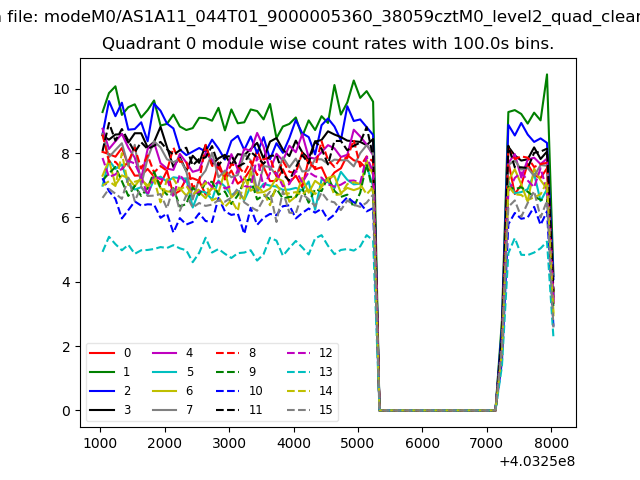 |
 |
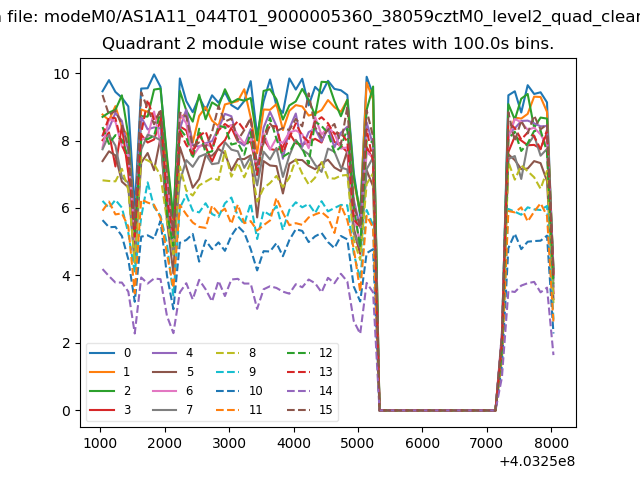
| Module-wise count rates for Quadrant B Data is divided into 100 sec bins |
 |
 |
| Module-wise count rates for Quadrant C Data is divided into 100 sec bins |
 |
 |
| Module-wise count rates for Quadrant D Data is divided into 100 sec bins |
 |
 |
| Parameter | Plot |
|---|---|
| CZT HV Monitor | 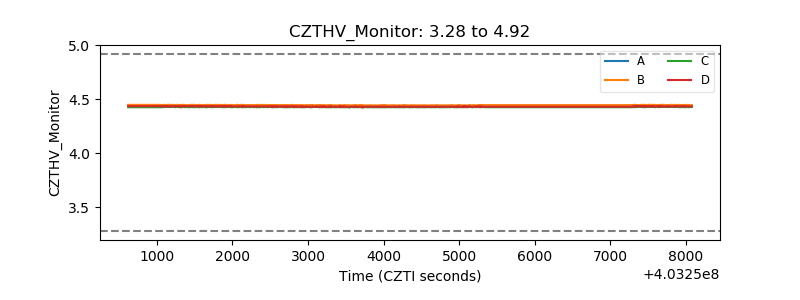 |
| D_VDD | 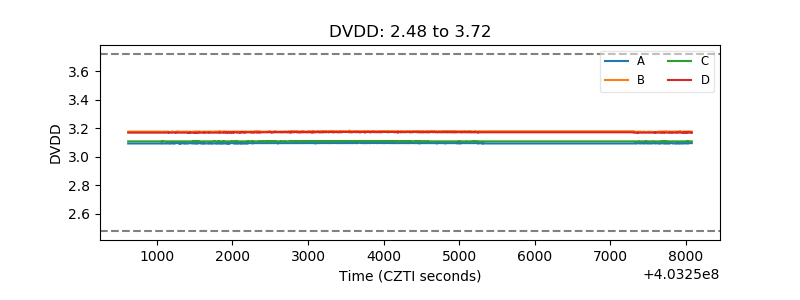 |
| Temperature 1 | 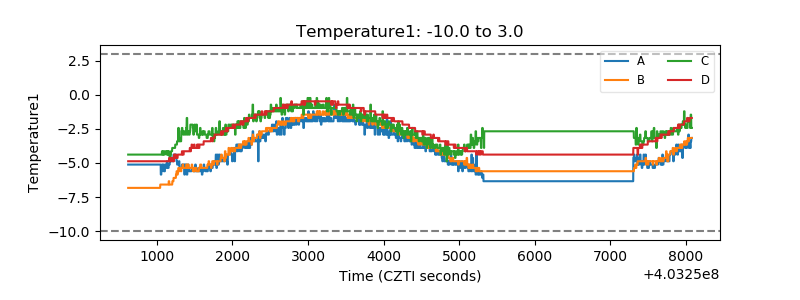 |
| Veto HV Monitor | 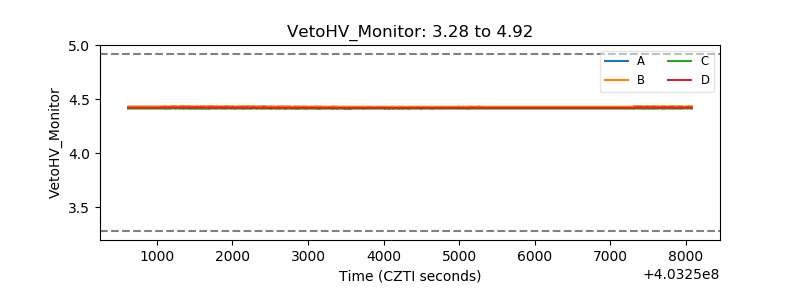 |
| Veto LLD | 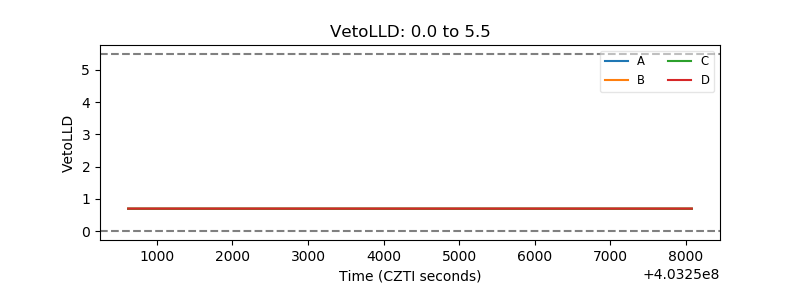 |
| Alpha Counter | 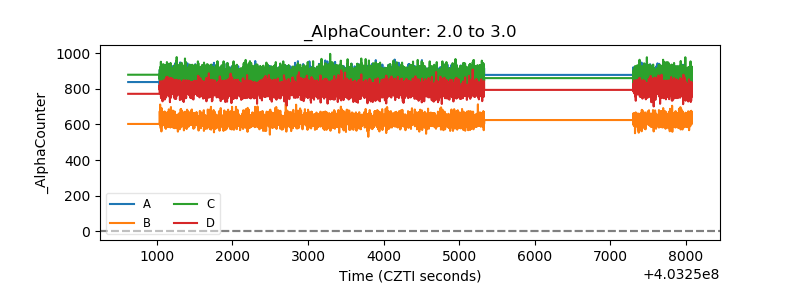 |
| _CPM_Rate | 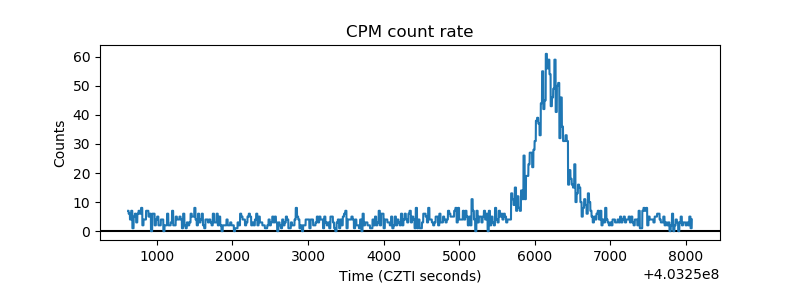 |
| CZT Counter | 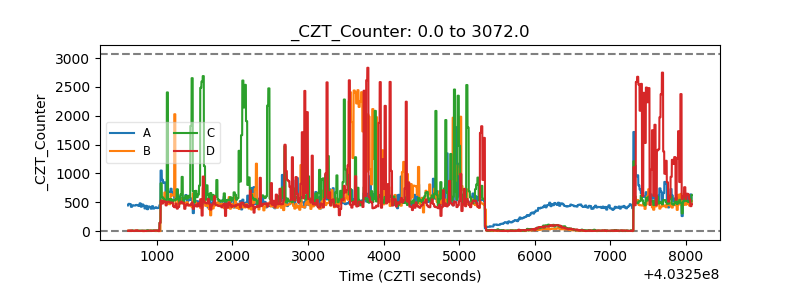 |
| +2.5 Volts monitor | 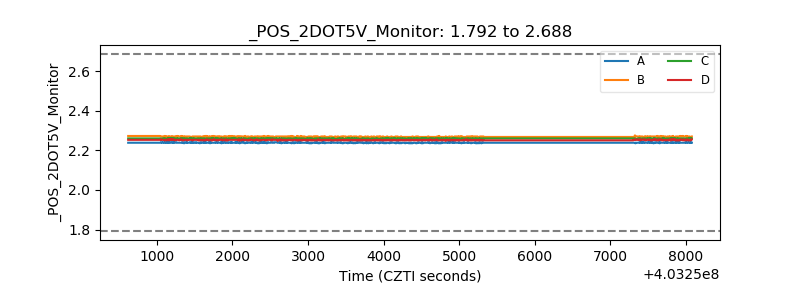 |
| +5 Volts monitor | 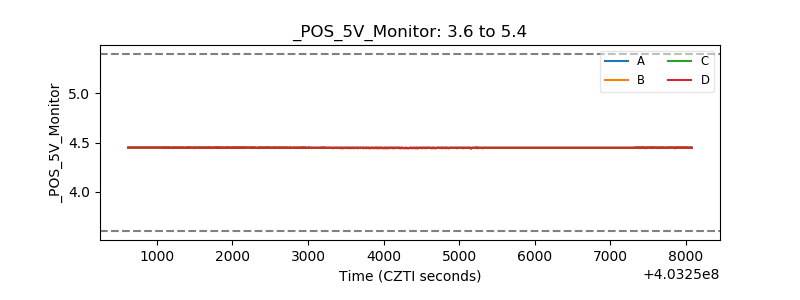 |
| _ROLL_ROT | 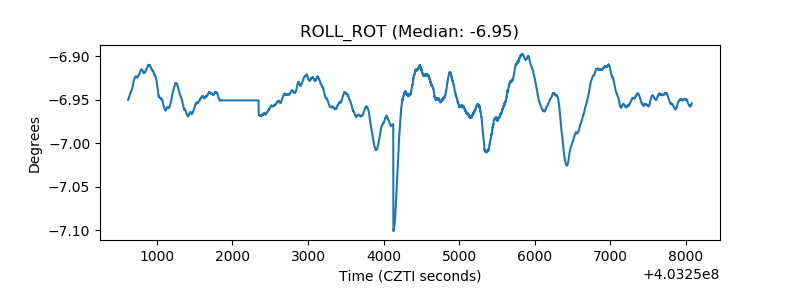 |
| _Roll_DEC | 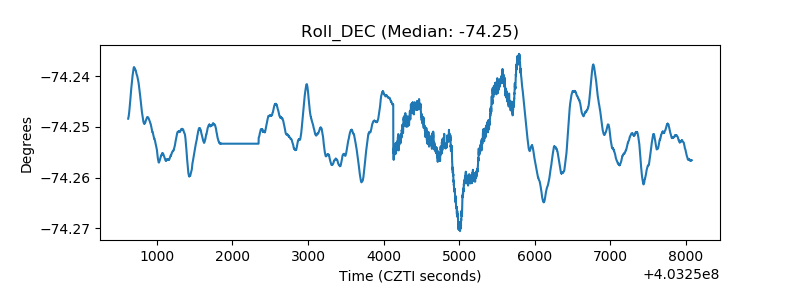 |
| _Roll_RA | 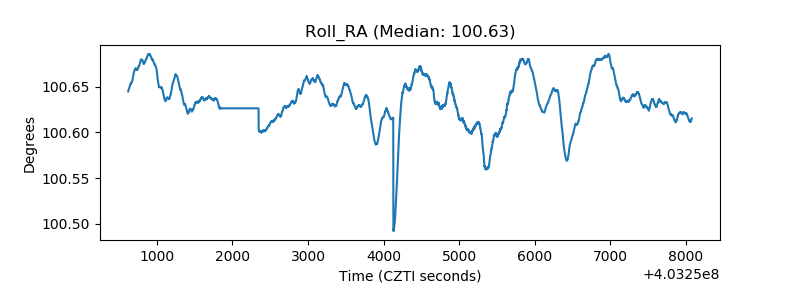 |
| Veto Counter | 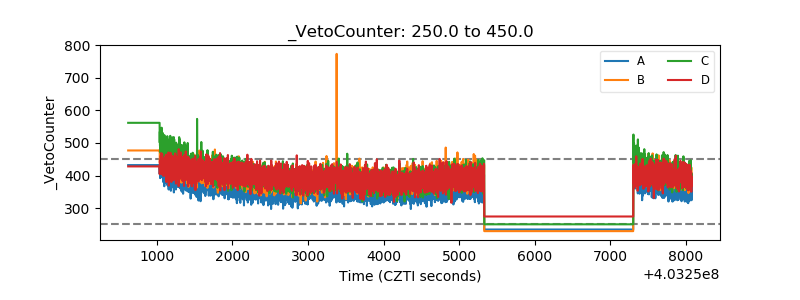 |