| Param | Original file | Final file |
|---|---|---|
| Filename | modeM0/AS1A11_044T01_9000005360_38061cztM0_level2.fits | modeM0/AS1A11_044T01_9000005360_38061cztM0_level2_quad_clean.evt |
| Size (bytes) | 578,848,320 | 93,588,480 |
| Size | 552.0 MB | 89.3 MB |
| Events in quadrant A | 3,386,465 | 677,089 |
| Events in quadrant B | 3,350,197 | 688,977 |
| Events in quadrant C | 3,621,209 | 687,803 |
| Events in quadrant D | 10,600,356 | 358,326 |
| Mode SS | |||
|---|---|---|---|
| Quadrant | BADHDUFLAG | Total packets | Discarded packets |
| A | 0 | 122 | 0 |
| B | 0 | 122 | 0 |
| C | 0 | 122 | 0 |
| D | 0 | 122 | 0 |
| Mode M9 | |||
|---|---|---|---|
| Quadrant | BADHDUFLAG | Total packets | Discarded packets |
| A | 0 | 17 | 0 |
| B | 0 | 17 | 0 |
| C | 0 | 17 | 0 |
| D | 0 | 18 | 0 |
| Mode M0 | |||
|---|---|---|---|
| Quadrant | BADHDUFLAG | Total packets | Discarded packets |
| A | 0 | 13772 | 3 |
| B | 0 | 13893 | 2 |
| C | 0 | 14578 | 2 |
| D | 0 | 35637 | 2 |
| Quadrant | Total seconds | Saturated seconds | Saturation percentage |
|---|---|---|---|
| A | 6035 | 38 | 0.629660% |
| B | 6035 | 133 | 2.203811% |
| C | 6035 | 37 | 0.613090% |
| D | 6035 | 2870 | 47.555924% |
Noise dominated data is calculated using 1-second bins in cleaned event files. If a bin has >2000 counts, and if more than 50% of those come from <1% of pixels, then it is considered to be noise-dominated and hence unusable.
| Quadrant | # 1 sec bins | Bins with >0 counts | Bins with >2000 counts | High rate bins dominated by noise | Noise dominated (total time) | Noise dominated (detector-on time) | Marked lightcurve |
|---|---|---|---|---|---|---|---|
| A | 7408 | 6036 | 18 | 18 | 0.24% | 0.30% | 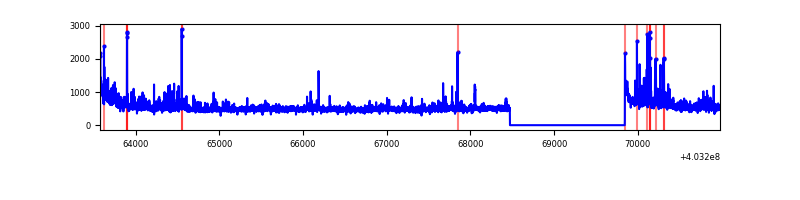 |
| B | 7408 | 6036 | 93 | 93 | 1.26% | 1.54% | 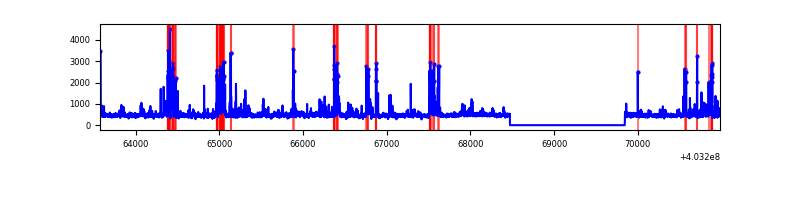 |
| C | 7408 | 6036 | 18 | 18 | 0.24% | 0.30% | 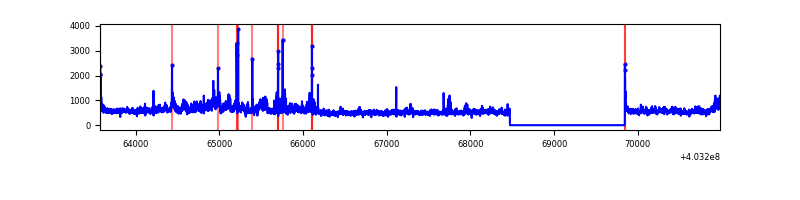 |
| D | 7407 | 6034 | 2727 | 2727 | 36.82% | 45.19% | 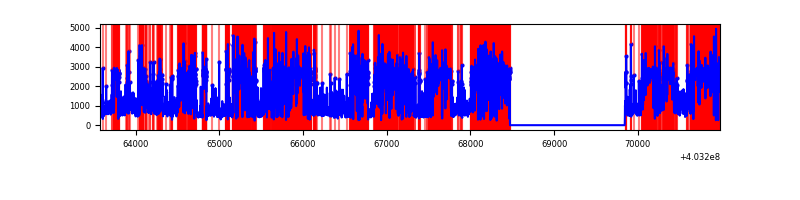 |
Top three noisy pixels from each quadrant. If the there are fewer than three noisy pixels in the level2.evt file, extra rows are filled as -1
| Pixel properties | Quadrant properties | ||||||
|---|---|---|---|---|---|---|---|
| Quadrant | DetID | PixID | Counts | Sigma | Mean | Median | Sigma |
| A | 10 | 83 | 407308 | 3014.88 | 672 | 658 | 134.9 |
| A | 12 | 16 | 184397 | 1362.23 | 672 | 658 | 134.9 |
| A | 7 | 3 | 69766 | 512.36 | 672 | 658 | 134.9 |
| B | 5 | 172 | 300018 | 2340.04 | 668 | 649 | 127.9 |
| B | 4 | 171 | 215737 | 1681.25 | 668 | 649 | 127.9 |
| B | 0 | 229 | 83034 | 643.97 | 668 | 649 | 127.9 |
| C | 3 | 233 | 611711 | 3941.68 | 665 | 670 | 155.0 |
| C | 15 | 214 | 254211 | 1635.53 | 665 | 670 | 155.0 |
| C | 1 | 23 | 126291 | 810.35 | 665 | 670 | 155.0 |
| D | 12 | 227 | 7728161 | 61506.11 | 514 | 498 | 125.6 |
| D | 13 | 249 | 193104 | 1532.99 | 514 | 498 | 125.6 |
| D | 12 | 233 | 184975 | 1468.29 | 514 | 498 | 125.6 |
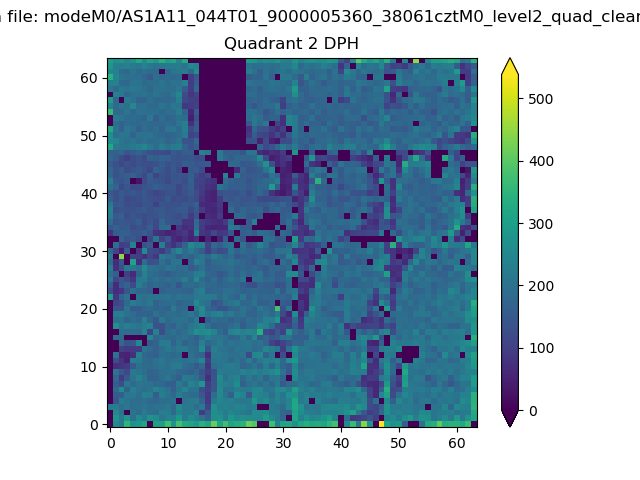
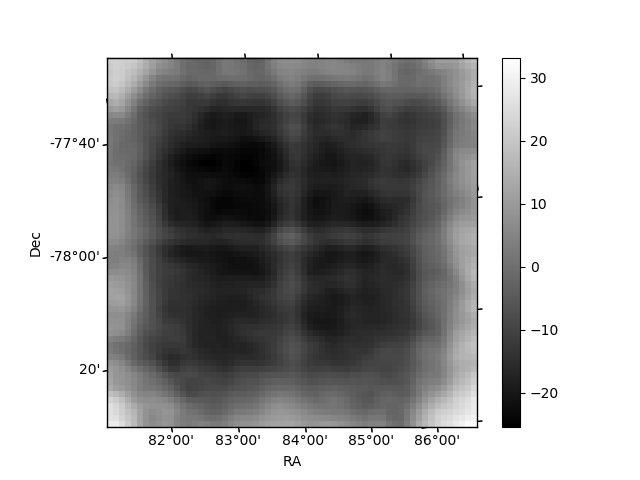
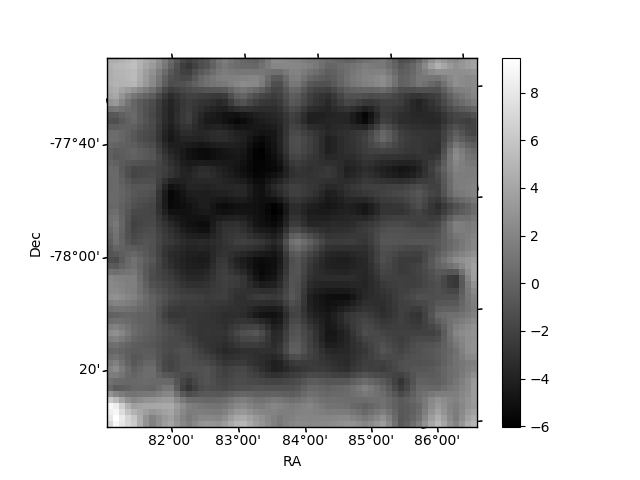
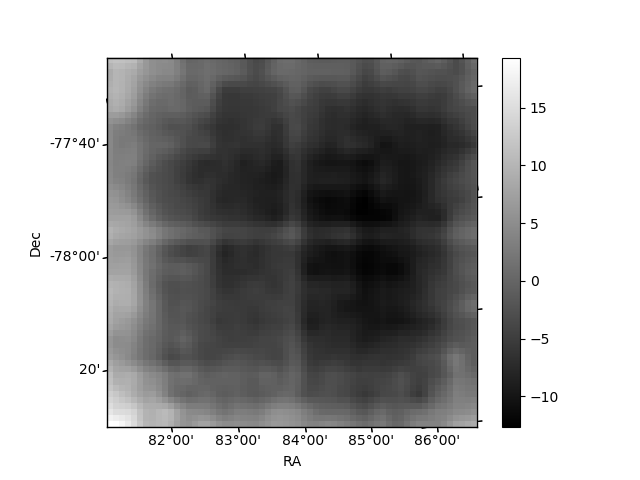
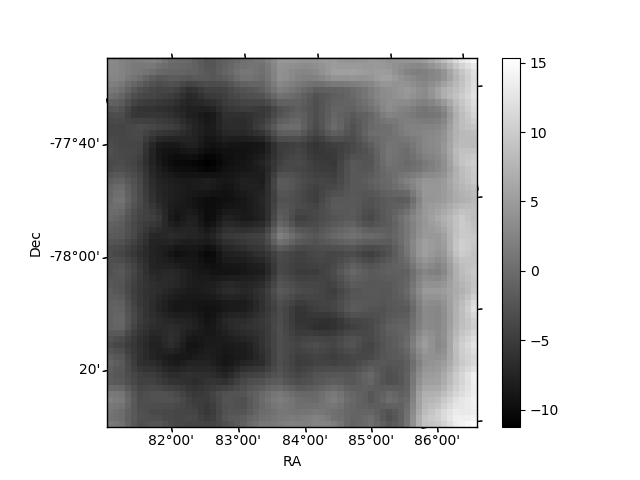
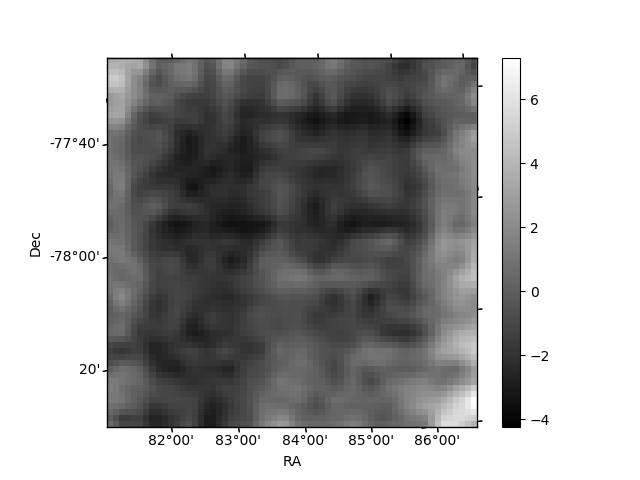
Histogram calculated using DETX and DETY for each event in the final _common_clean file
| Quadrant A | 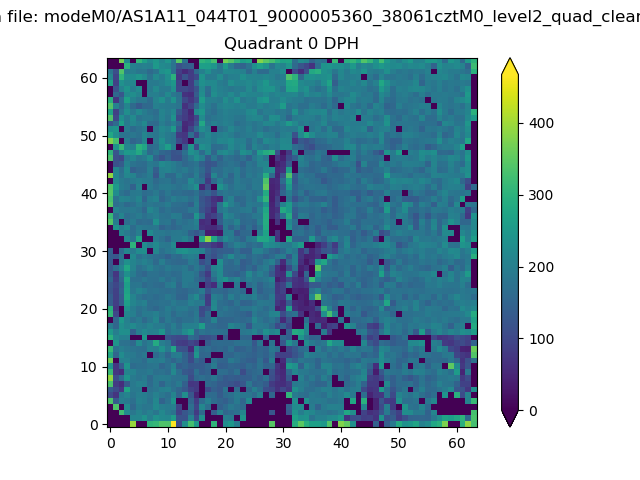 |
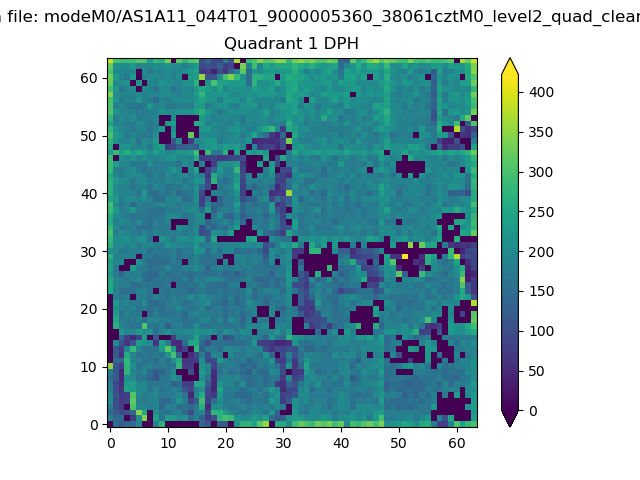 |
Quadrant B |
|---|---|---|---|
| Quadrant D | 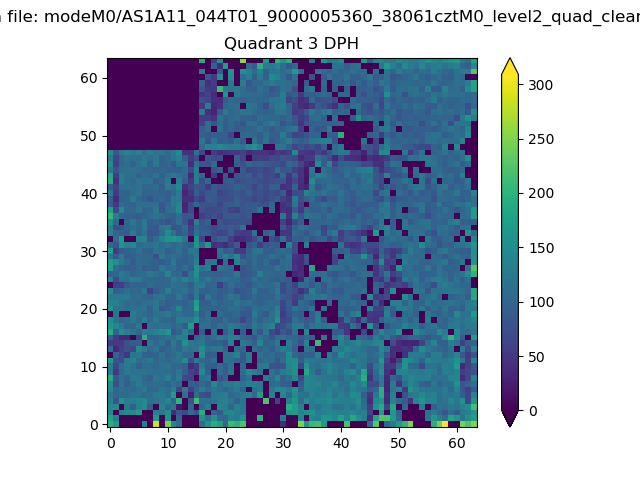 |
 |
Quadrant C |
| Plot type | Count rate plots | Images |
|---|---|---|
| Comparison with Poisson distribution Blue bars denote a histogram of data divided into 1 sec bins. Red curve is a Poisson curve with rate = median count rate of data. |
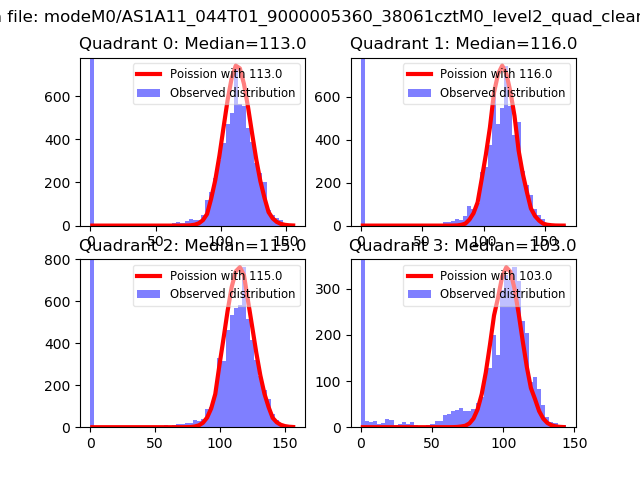 |
 |
| Quadrant-wise count rates Data is divided into 100 sec bins |
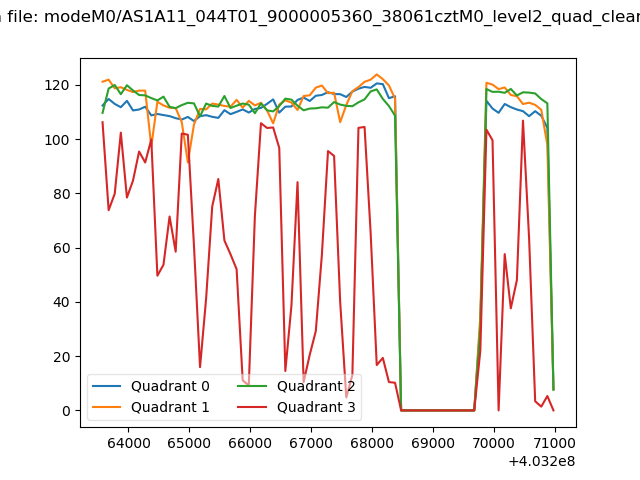 |
|
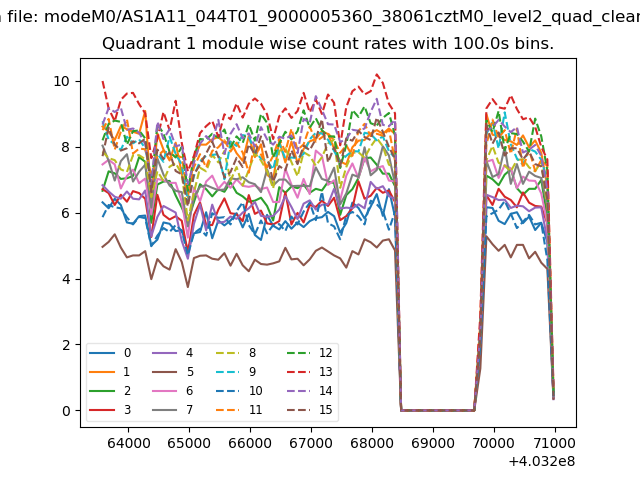
| Module-wise count rates for Quadrant A Data is divided into 100 sec bins |
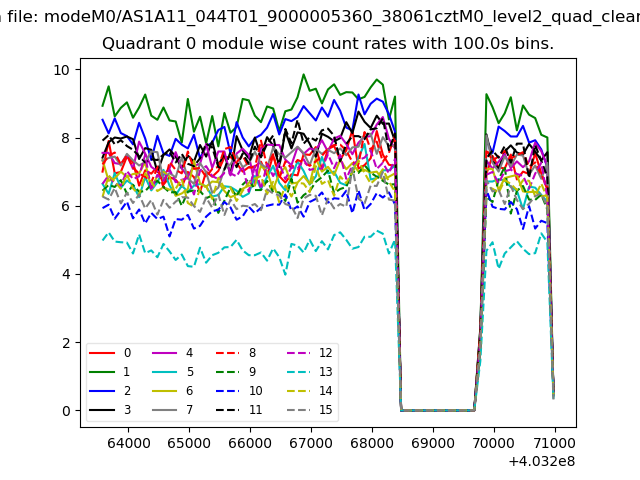 |
 |
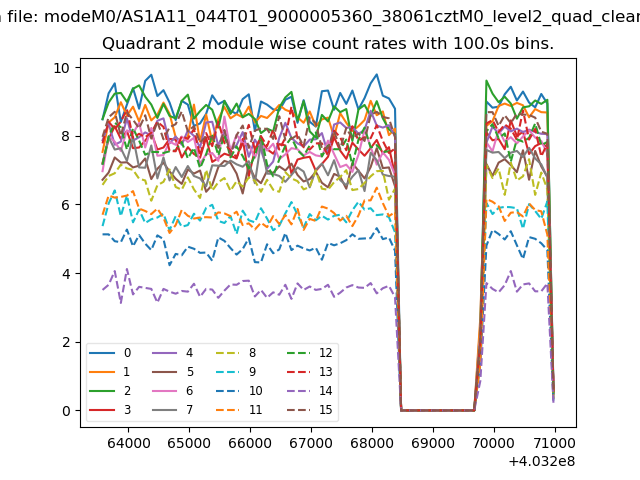
| Module-wise count rates for Quadrant B Data is divided into 100 sec bins |
 |
 |
| Module-wise count rates for Quadrant C Data is divided into 100 sec bins |
 |
 |
| Module-wise count rates for Quadrant D Data is divided into 100 sec bins |
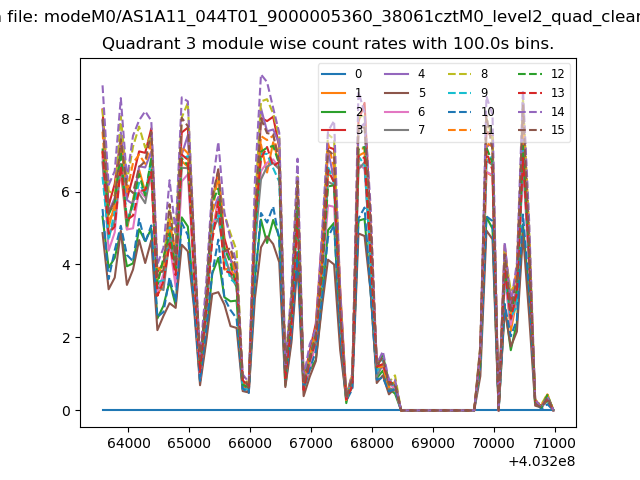 |
 |
| Parameter | Plot |
|---|---|
| CZT HV Monitor | 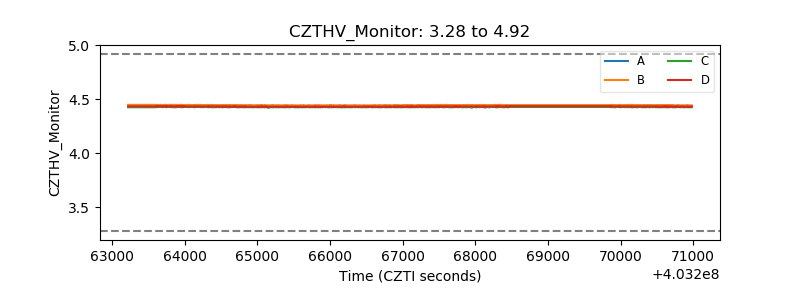 |
| D_VDD | 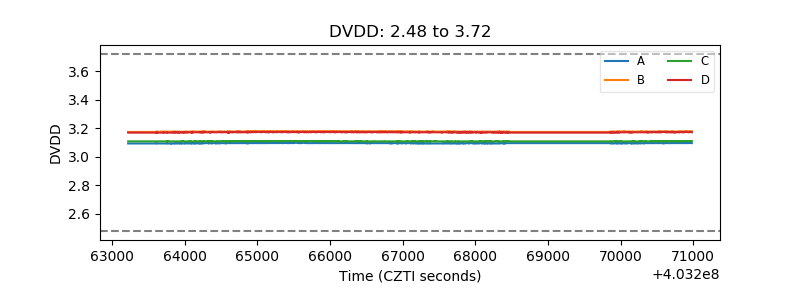 |
| Temperature 1 | 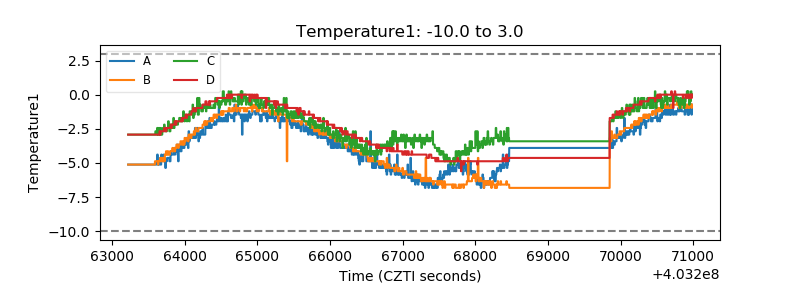 |
| Veto HV Monitor | 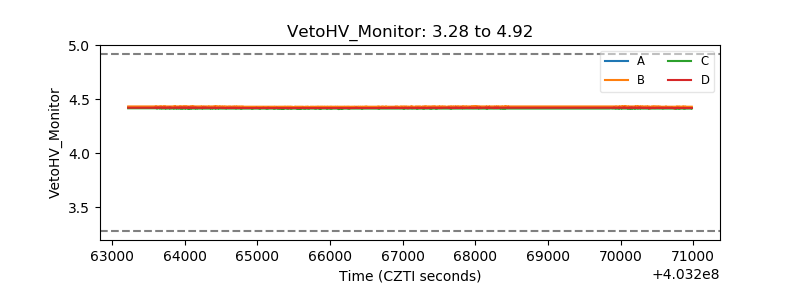 |
| Veto LLD | 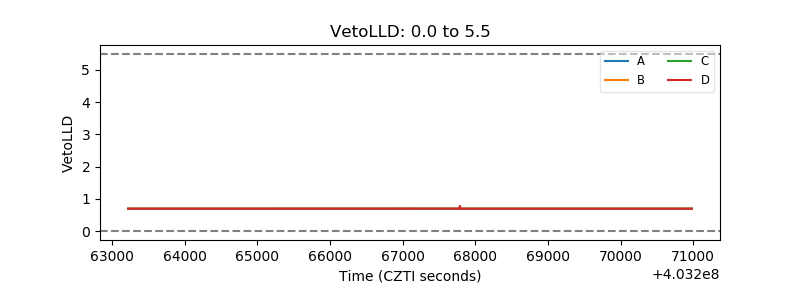 |
| Alpha Counter | 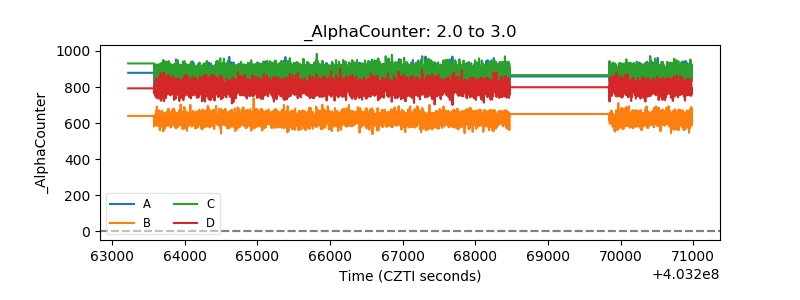 |
| _CPM_Rate | 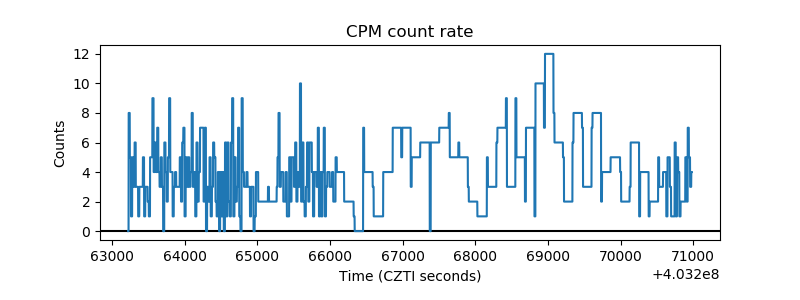 |
| CZT Counter | 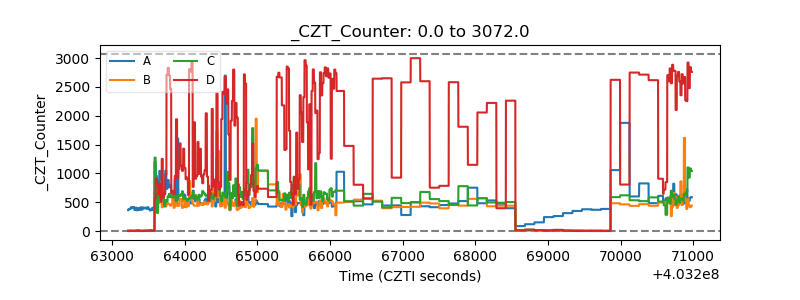 |
| +2.5 Volts monitor | 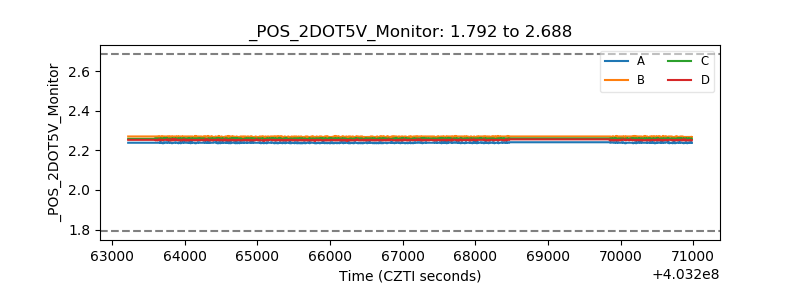 |
| +5 Volts monitor | 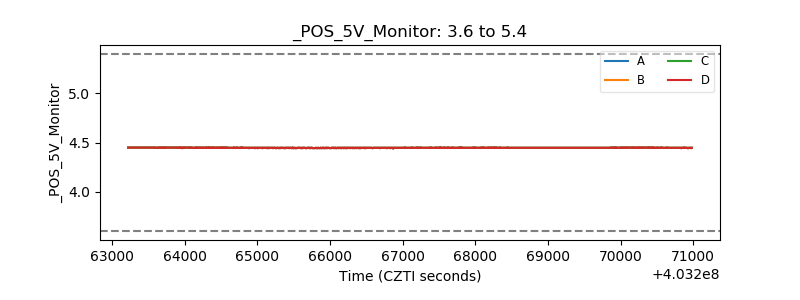 |
| _ROLL_ROT | 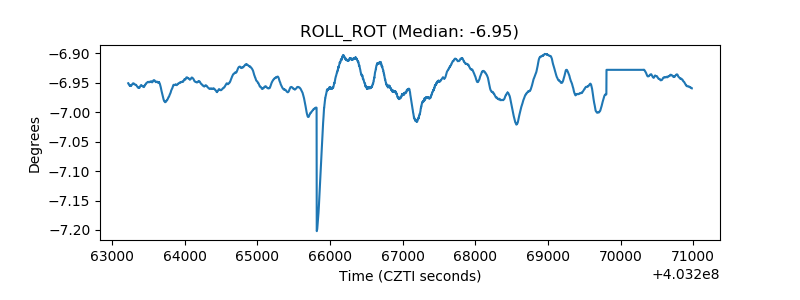 |
| _Roll_DEC | 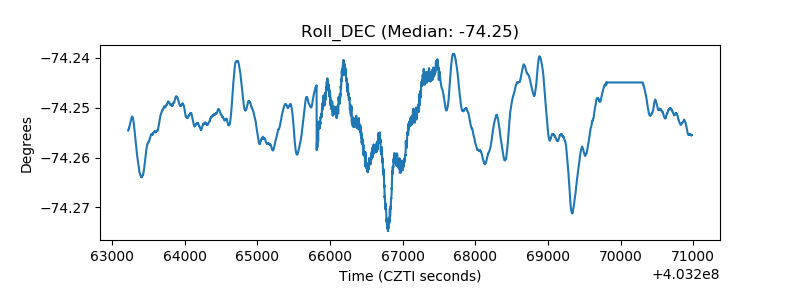 |
| _Roll_RA | 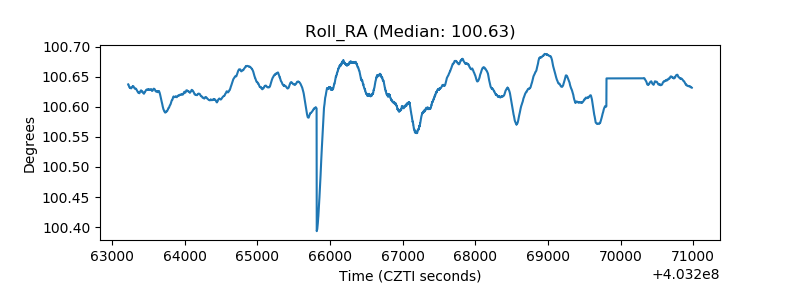 |
| Veto Counter | 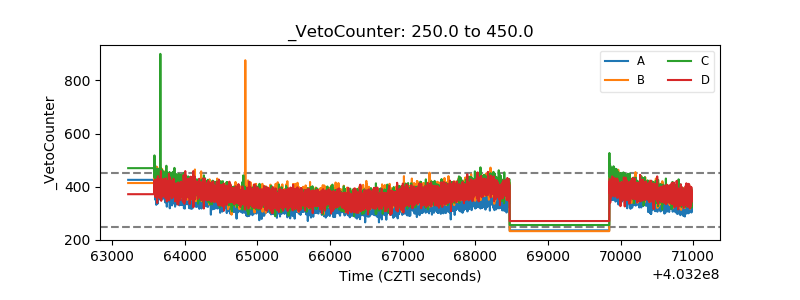 |