| Param | Original file | Final file |
|---|---|---|
| Filename | modeM0/AS1A11_044T01_9000005360_38062cztM0_level2.fits | modeM0/AS1A11_044T01_9000005360_38062cztM0_level2_quad_clean.evt |
| Size (bytes) | 225,020,160 | 29,439,360 |
| Size | 214.6 MB | 28.1 MB |
| Events in quadrant A | 1,124,408 | 215,433 |
| Events in quadrant B | 1,254,471 | 220,461 |
| Events in quadrant C | 1,582,683 | 223,785 |
| Events in quadrant D | 4,211,126 | 86,912 |
| Mode SS | |||
|---|---|---|---|
| Quadrant | BADHDUFLAG | Total packets | Discarded packets |
| A | 0 | 40 | 0 |
| B | 0 | 40 | 0 |
| C | 0 | 40 | 0 |
| D | 0 | 40 | 0 |
| Mode M0 | |||
|---|---|---|---|
| Quadrant | BADHDUFLAG | Total packets | Discarded packets |
| A | 0 | 4539 | 0 |
| B | 0 | 5043 | 0 |
| C | 0 | 6032 | 0 |
| D | 0 | 13846 | 0 |
| Quadrant | Total seconds | Saturated seconds | Saturation percentage |
|---|---|---|---|
| A | 1990 | 14 | 0.703518% |
| B | 1990 | 49 | 2.462312% |
| C | 1990 | 26 | 1.306533% |
| D | 1990 | 1254 | 63.015075% |
Noise dominated data is calculated using 1-second bins in cleaned event files. If a bin has >2000 counts, and if more than 50% of those come from <1% of pixels, then it is considered to be noise-dominated and hence unusable.
| Quadrant | # 1 sec bins | Bins with >0 counts | Bins with >2000 counts | High rate bins dominated by noise | Noise dominated (total time) | Noise dominated (detector-on time) | Marked lightcurve |
|---|---|---|---|---|---|---|---|
| A | 1990 | 1990 | 9 | 9 | 0.45% | 0.45% | 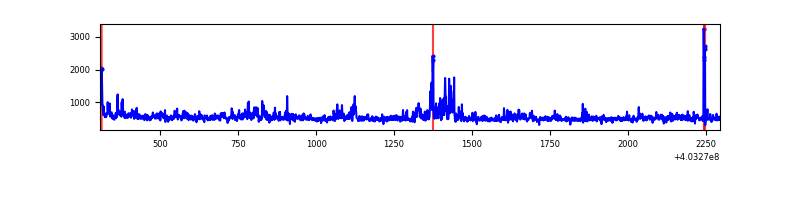 |
| B | 1990 | 1990 | 19 | 19 | 0.95% | 0.95% | 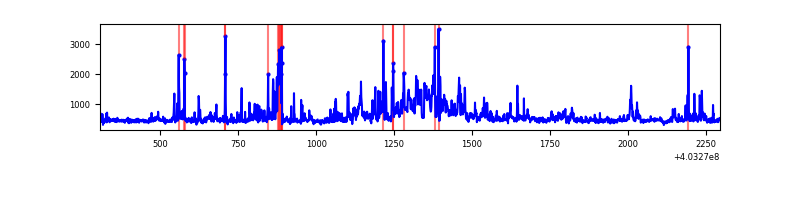 |
| C | 1990 | 1990 | 21 | 21 | 1.06% | 1.06% | 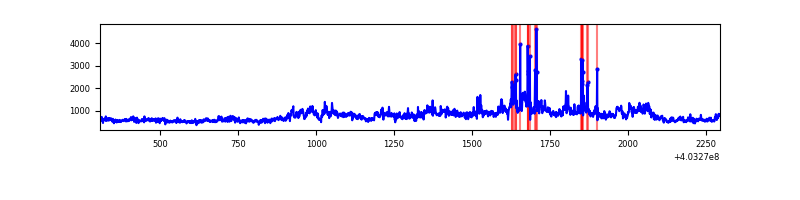 |
| D | 1990 | 1990 | 1172 | 1172 | 58.89% | 58.89% | 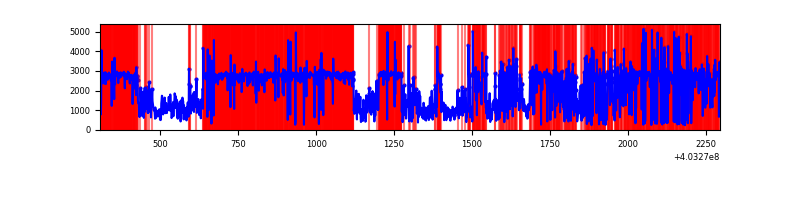 |
Top three noisy pixels from each quadrant. If the there are fewer than three noisy pixels in the level2.evt file, extra rows are filled as -1
| Pixel properties | Quadrant properties | ||||||
|---|---|---|---|---|---|---|---|
| Quadrant | DetID | PixID | Counts | Sigma | Mean | Median | Sigma |
| A | 12 | 16 | 120525 | 2614.51 | 216 | 211 | 46.0 |
| A | 10 | 83 | 107595 | 2333.54 | 216 | 211 | 46.0 |
| A | 15 | 222 | 18897 | 406.06 | 216 | 211 | 46.0 |
| B | 4 | 171 | 191751 | 4476.15 | 213 | 208 | 42.8 |
| B | 0 | 229 | 87993 | 2051.44 | 213 | 208 | 42.8 |
| B | 5 | 172 | 50932 | 1185.36 | 213 | 208 | 42.8 |
| C | 3 | 233 | 615923 | 12319.31 | 208 | 209 | 50.0 |
| C | 15 | 214 | 82116 | 1638.81 | 208 | 209 | 50.0 |
| C | 1 | 23 | 72443 | 1445.27 | 208 | 209 | 50.0 |
| D | 12 | 227 | 3416181 | 95639.44 | 136 | 131 | 35.7 |
| D | 12 | 233 | 118364 | 3310.18 | 136 | 131 | 35.7 |
| D | 10 | 199 | 37526 | 1046.95 | 136 | 131 | 35.7 |
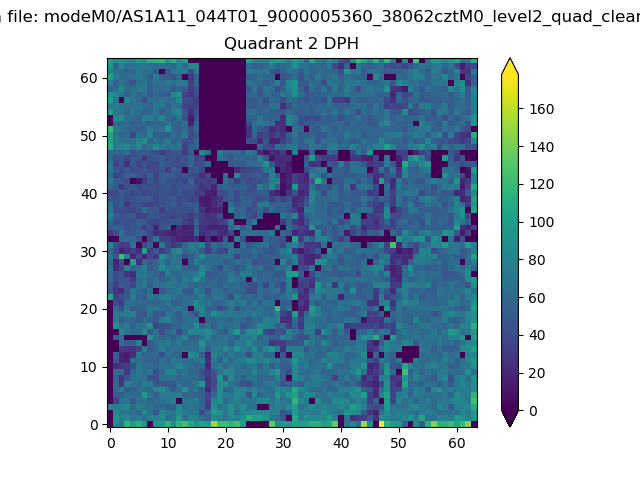
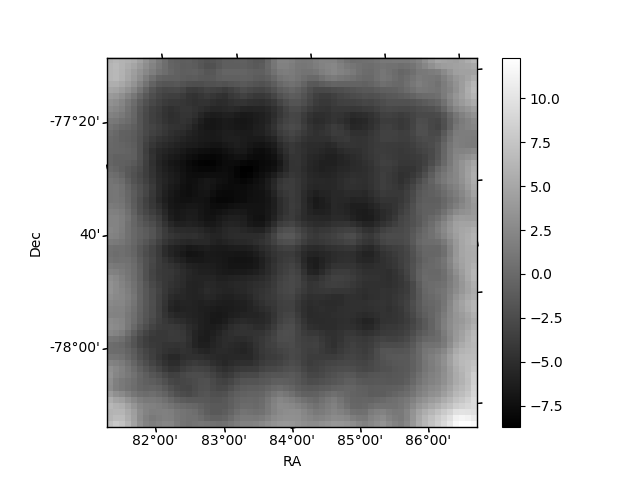
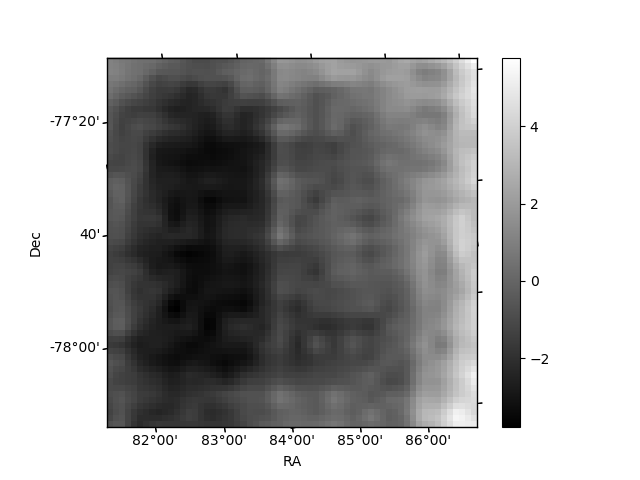
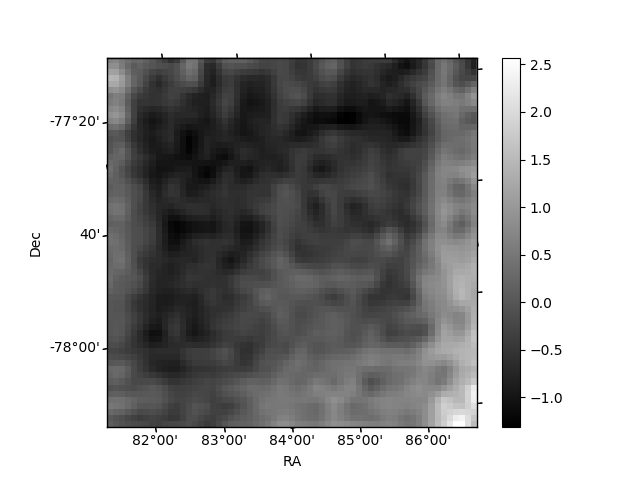
Histogram calculated using DETX and DETY for each event in the final _common_clean file
| Quadrant A | 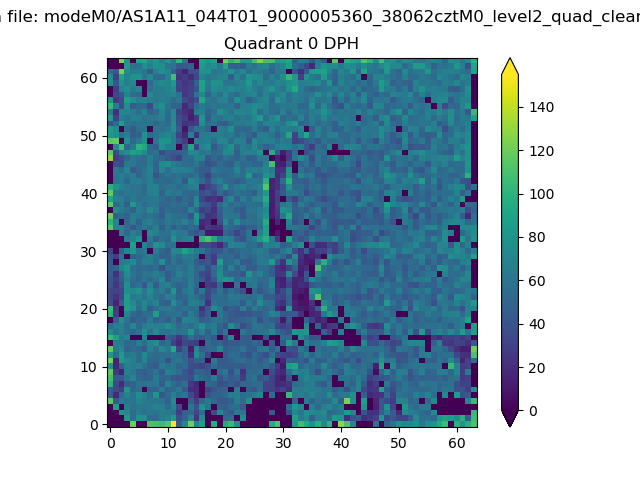 |
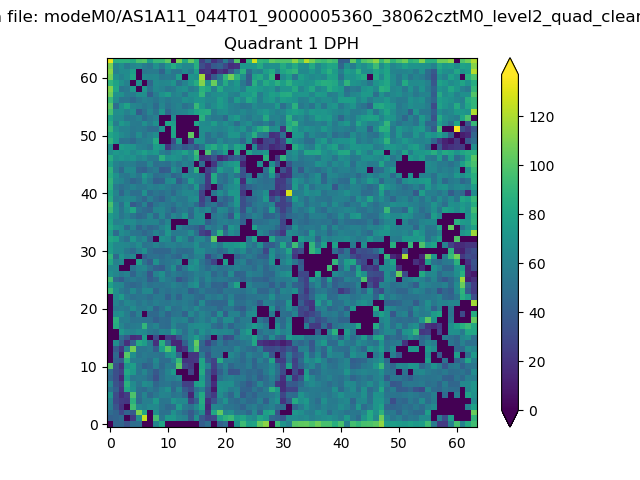 |
Quadrant B |
|---|---|---|---|
| Quadrant D | 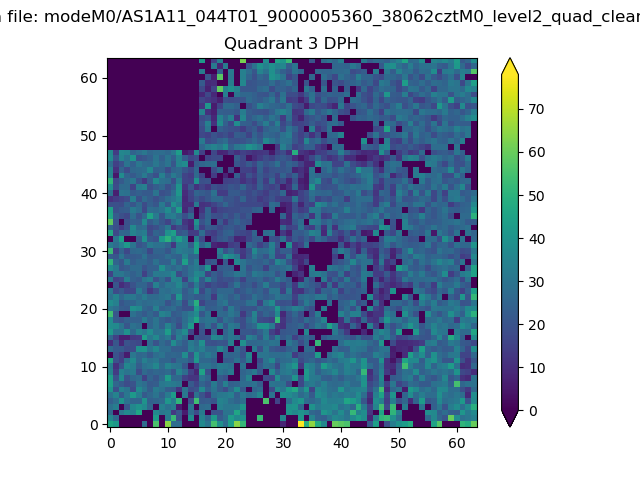 |
 |
Quadrant C |
| Plot type | Count rate plots | Images |
|---|---|---|
| Comparison with Poisson distribution Blue bars denote a histogram of data divided into 1 sec bins. Red curve is a Poisson curve with rate = median count rate of data. |
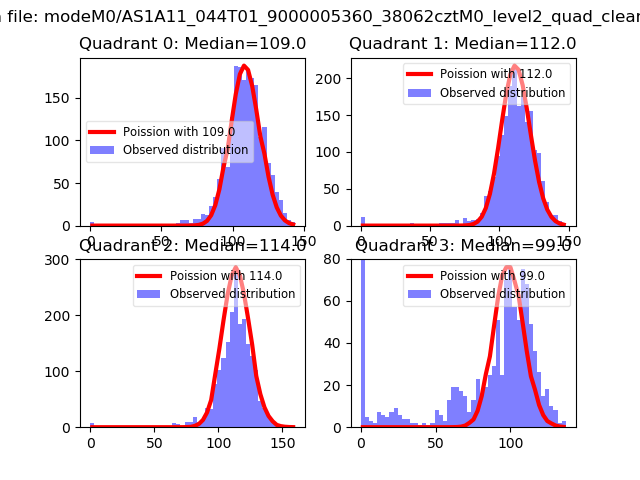 |
 |
| Quadrant-wise count rates Data is divided into 100 sec bins |
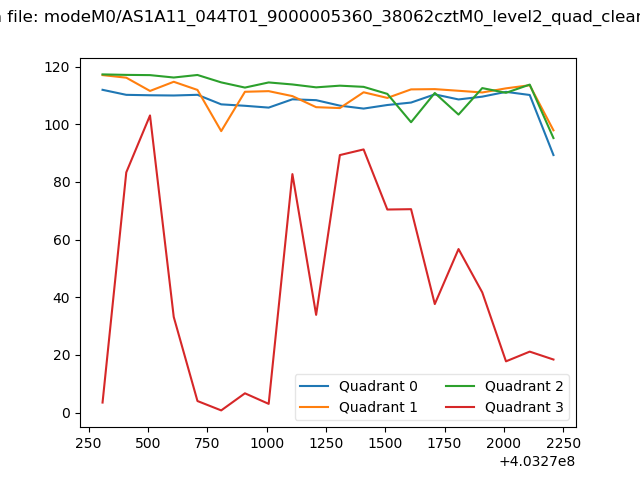 |
|
| Module-wise count rates for Quadrant A Data is divided into 100 sec bins |
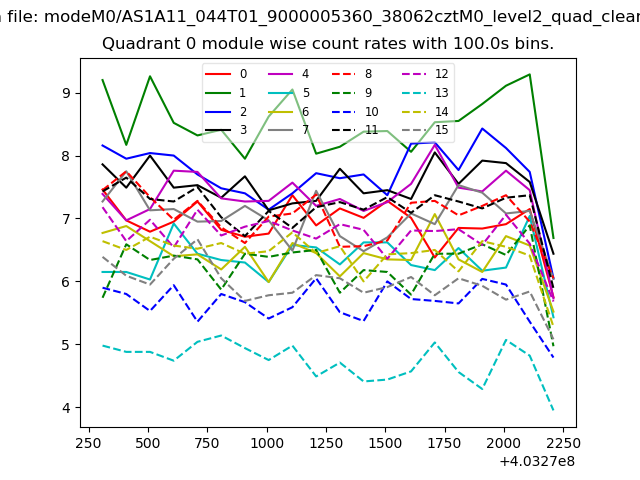 |
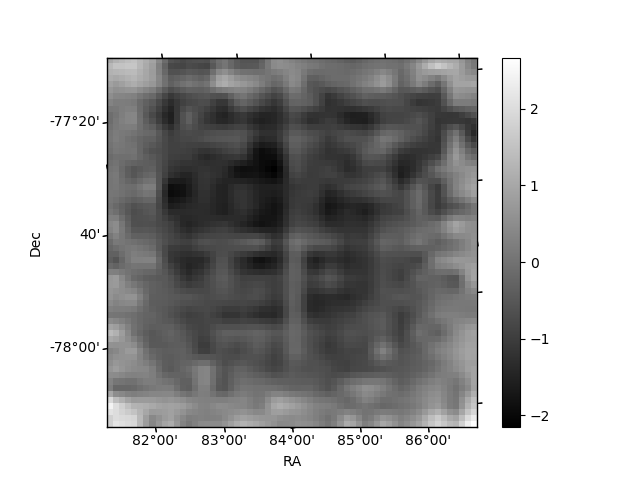 |
| Module-wise count rates for Quadrant B Data is divided into 100 sec bins |
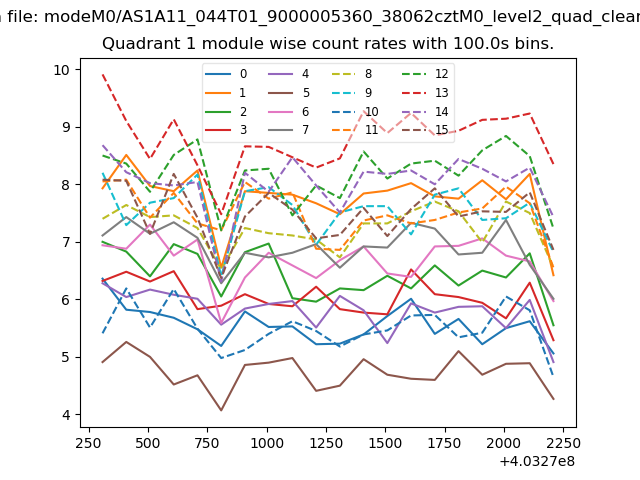 |
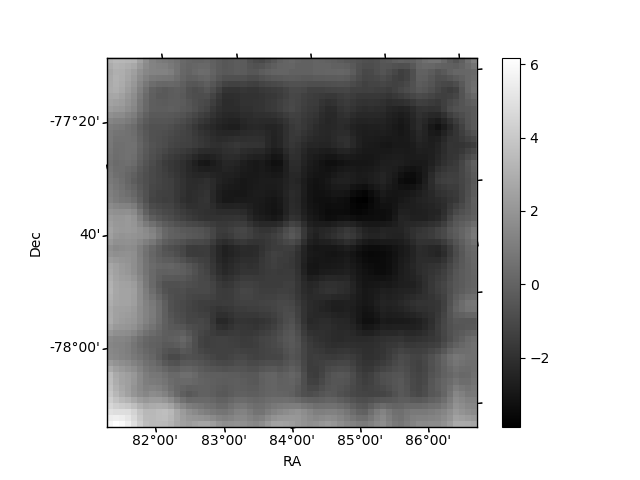 |
| Module-wise count rates for Quadrant C Data is divided into 100 sec bins |
 |
 |
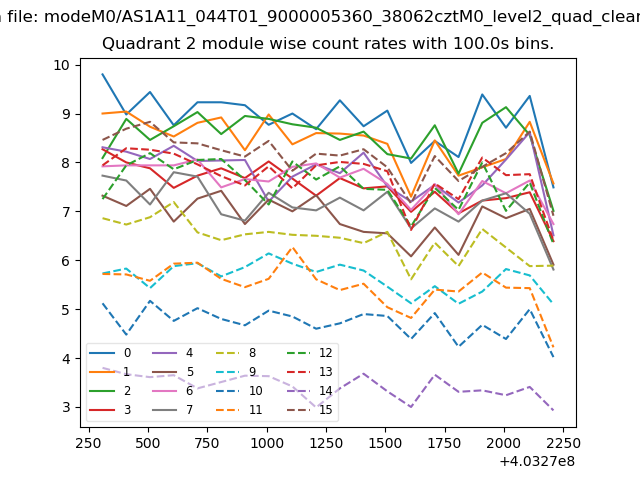
| Module-wise count rates for Quadrant D Data is divided into 100 sec bins |
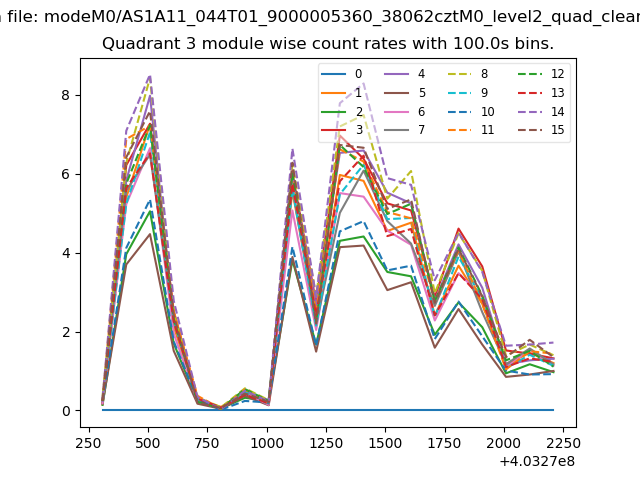 |
 |
| Parameter | Plot |
|---|---|
| CZT HV Monitor | 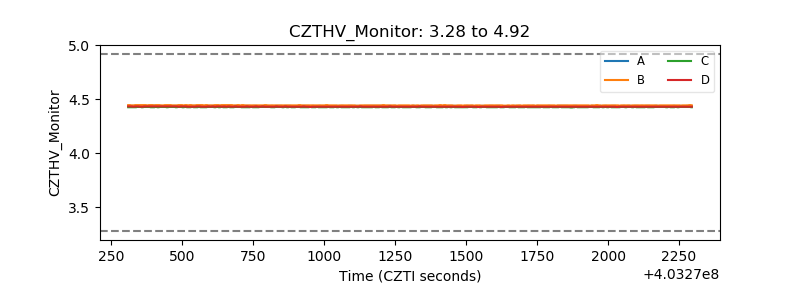 |
| D_VDD | 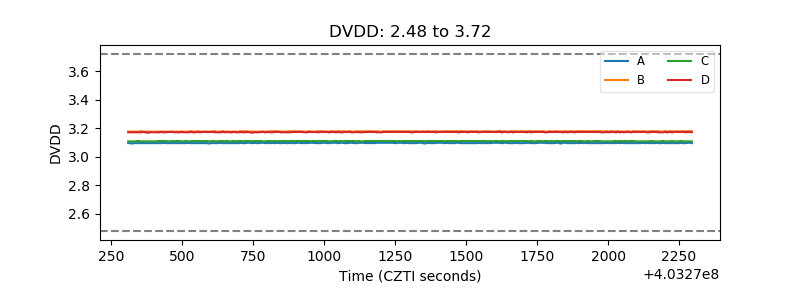 |
| Temperature 1 | 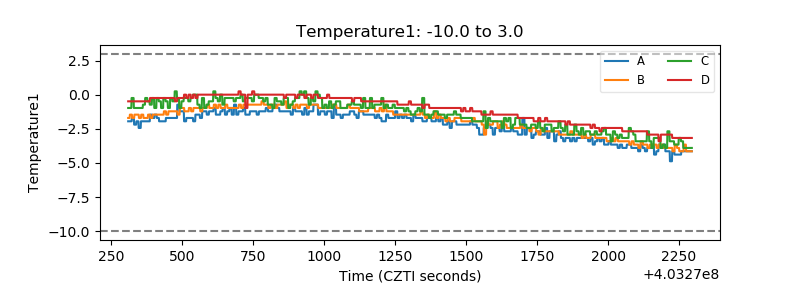 |
| Veto HV Monitor |  |
| Veto LLD | 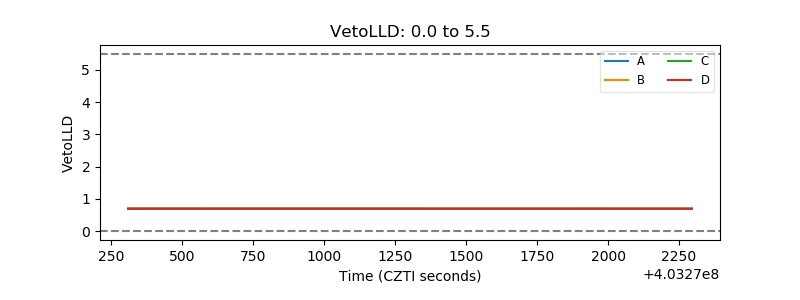 |
| Alpha Counter | 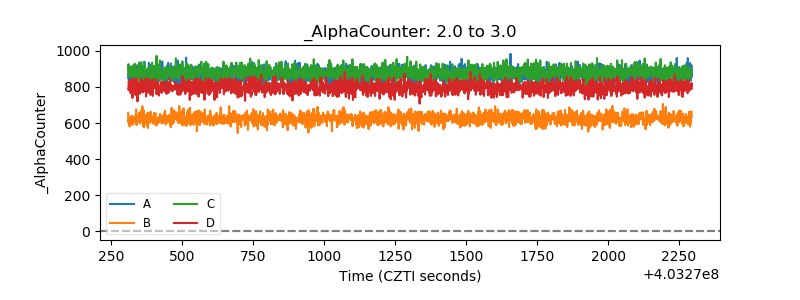 |
| _CPM_Rate | 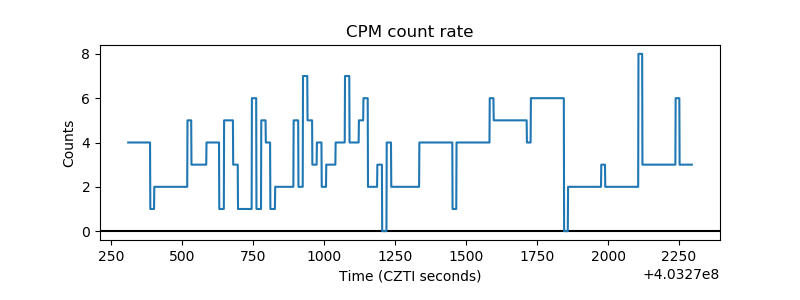 |
| CZT Counter | 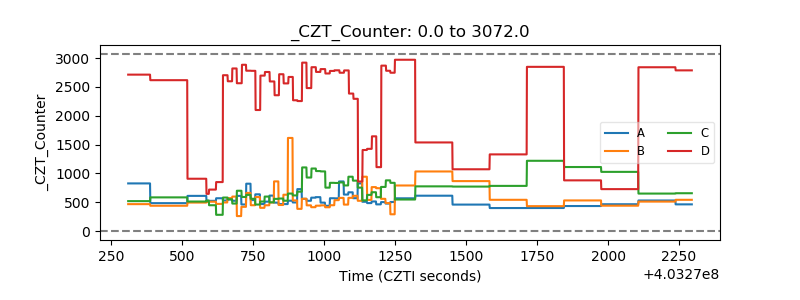 |
| +2.5 Volts monitor | 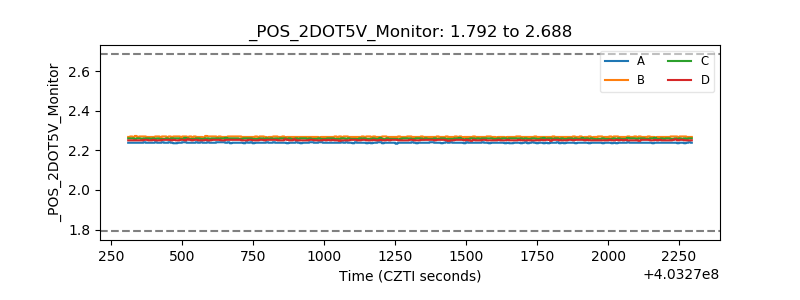 |
| +5 Volts monitor | 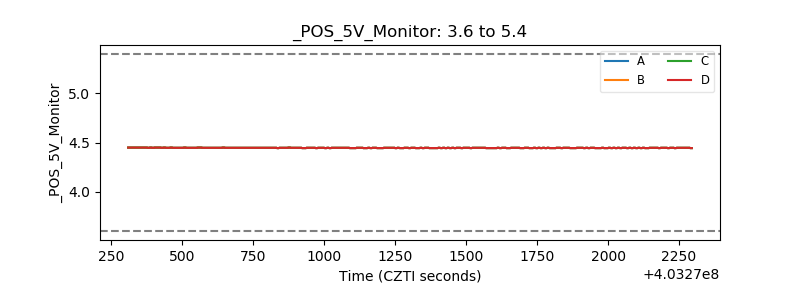 |
| _ROLL_ROT | 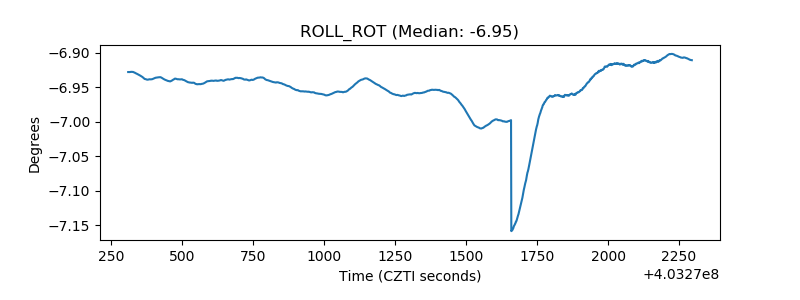 |
| _Roll_DEC | 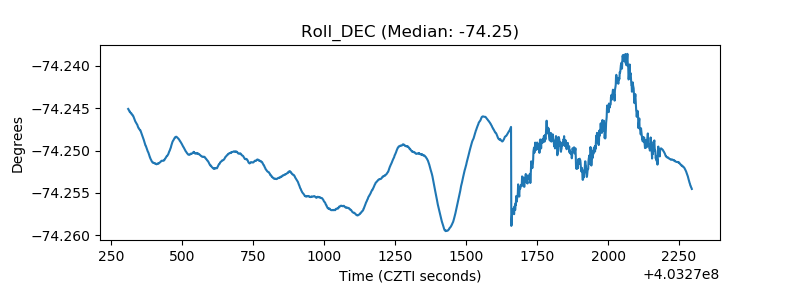 |
| _Roll_RA | 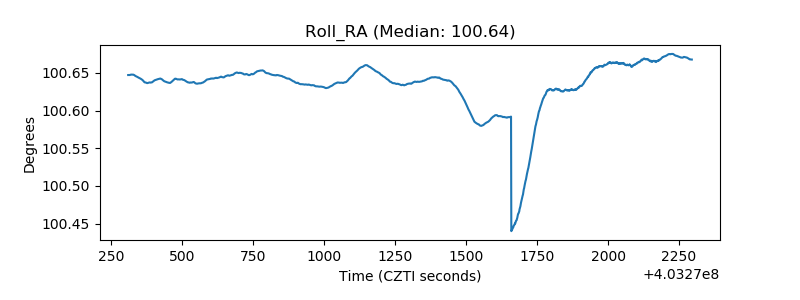 |
| Veto Counter | 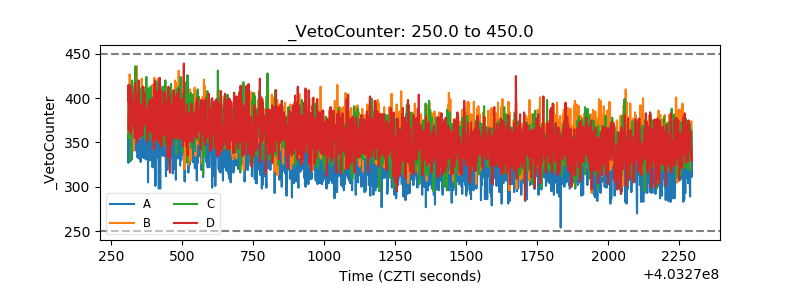 |