| Param | Original file | Final file |
|---|---|---|
| Filename | modeM0/AS1A11_047T09_9000005362cztM0_level2.fits | modeM0/AS1A11_047T09_9000005362cztM0_level2_quad_clean.evt |
| Size (bytes) | 71,375,040 | 62,458,560 |
| Size | 68.1 MB | 59.6 MB |
| Events in quadrant A | 431,848 | 359,990 |
| Events in quadrant B | 414,464 | 358,328 |
| Events in quadrant C | 412,146 | 341,199 |
| Events in quadrant D | 341,586 | 270,084 |
| Mode M0 | |||
|---|---|---|---|
| Quadrant | BADHDUFLAG | Total packets | Discarded packets |
| A | 0 | 19179 | 0 |
| B | 0 | 18102 | 0 |
| C | 0 | 20854 | 0 |
| D | 0 | 33964 | 0 |
| Mode SS | |||
|---|---|---|---|
| Quadrant | BADHDUFLAG | Total packets | Discarded packets |
| A | 0 | 164 | 0 |
| B | 0 | 164 | 0 |
| C | 0 | 164 | 0 |
| D | 0 | 164 | 0 |
| Mode M9 | |||
|---|---|---|---|
| Quadrant | BADHDUFLAG | Total packets | Discarded packets |
| A | 0 | 19 | 0 |
| B | 0 | 19 | 0 |
| C | 0 | 19 | 0 |
| D | 0 | 20 | 0 |
| Quadrant | Total seconds | Saturated seconds | Saturation percentage |
|---|---|---|---|
| A | 8066 | 51 | 0.632284% |
| B | 8077 | 161 | 1.993314% |
| C | 8073 | 440 | 5.450266% |
| D | 8061 | 1079 | 13.385436% |
Noise dominated data is calculated using 1-second bins in cleaned event files. If a bin has >2000 counts, and if more than 50% of those come from <1% of pixels, then it is considered to be noise-dominated and hence unusable.
| Quadrant | # 1 sec bins | Bins with >0 counts | Bins with >2000 counts | High rate bins dominated by noise | Noise dominated (total time) | Noise dominated (detector-on time) | Marked lightcurve |
|---|---|---|---|---|---|---|---|
| A | 9397 | 8079 | 0 | 0 | 0.00% | 0.00% |  |
| B | 9396 | 8080 | 0 | 0 | 0.00% | 0.00% |  |
| C | 9396 | 8046 | 0 | 0 | 0.00% | 0.00% |  |
| D | 9396 | 8050 | 0 | 0 | 0.00% | 0.00% |  |
Top three noisy pixels from each quadrant. If the there are fewer than three noisy pixels in the level2.evt file, extra rows are filled as -1
| Pixel properties | Quadrant properties | ||||||
|---|---|---|---|---|---|---|---|
| Quadrant | DetID | PixID | Counts | Sigma | Mean | Median | Sigma |
| A | 9 | 19 | 368 | 8.8 | 112 | 105 | 29.9 |
| A | 7 | 110 | 335 | 7.7 | 112 | 105 | 29.9 |
| A | 0 | 29 | 332 | 7.6 | 112 | 105 | 29.9 |
| B | 2 | 9 | 340 | 9.77 | 109 | 104 | 24.2 |
| B | 3 | 80 | 296 | 7.94 | 109 | 104 | 24.2 |
| B | 5 | 232 | 294 | 7.86 | 109 | 104 | 24.2 |
| C | 1 | 81 | 367 | 8.9 | 109 | 102 | 29.8 |
| C | 1 | 80 | 342 | 8.06 | 109 | 102 | 29.8 |
| C | 3 | 187 | 289 | 6.28 | 109 | 102 | 29.8 |
| D | 7 | 3 | 263 | 6.3 | 97 | 89 | 27.6 |
| D | 4 | 160 | 255 | 6.01 | 97 | 89 | 27.6 |
| D | 3 | 31 | 247 | 5.72 | 97 | 89 | 27.6 |
Histogram calculated using DETX and DETY for each event in the final _common_clean file
| Quadrant A |  |
 |
Quadrant B |
|---|---|---|---|
| Quadrant D |  |
 |
Quadrant C |
| Plot type | Count rate plots | Images |
|---|---|---|
| Comparison with Poisson distribution Blue bars denote a histogram of data divided into 1 sec bins. Red curve is a Poisson curve with rate = median count rate of data. |
 |
 |
| Quadrant-wise count rates Data is divided into 100 sec bins |
 |
|
| Module-wise count rates for Quadrant A Data is divided into 100 sec bins |
 |
 |
| Module-wise count rates for Quadrant B Data is divided into 100 sec bins |
 |
 |
| Module-wise count rates for Quadrant C Data is divided into 100 sec bins |
 |
 |
| Module-wise count rates for Quadrant D Data is divided into 100 sec bins |
 |
 |
| Parameter | Plot |
|---|---|
| CZT HV Monitor |  |
| D_VDD | 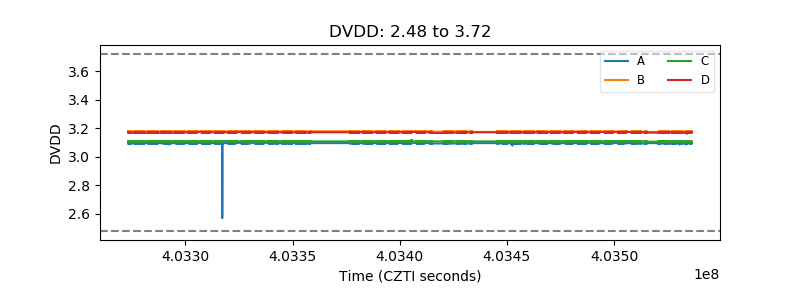 |
| Temperature 1 |  |
| Veto HV Monitor |  |
| Veto LLD |  |
| Alpha Counter |  |
| _CPM_Rate |  |
| CZT Counter |  |
| +2.5 Volts monitor |  |
| +5 Volts monitor |  |
| _ROLL_ROT |  |
| _Roll_DEC |  |
| _Roll_RA |  |
| Veto Counter |  |